Back to Journals » Diabetes, Metabolic Syndrome and Obesity » Volume 15
Associations Between GGT/HDL and MAFLD: A Cross-Sectional Study
Authors Xing Y, Chen J ![]() , Liu J, Ma H
, Liu J, Ma H
Received 4 October 2021
Accepted for publication 20 January 2022
Published 9 February 2022 Volume 2022:15 Pages 383—394
DOI https://doi.org/10.2147/DMSO.S342505
Checked for plagiarism Yes
Review by Single anonymous peer review
Peer reviewer comments 3
Editor who approved publication: Professor Ming-Hui Zou
Yuling Xing,1,2 Jinhu Chen,1,2 Jing Liu,1,2 Huijuan Ma1,3
1Department of Endocrinology, Hebei General Hospital, Shijiazhuang, 050017, People’s Republic of China; 2Graduate School of Hebei Medical University, Shijiazhuang, 050017, People’s Republic of China; 3Department of Internal Medicine, Hebei Medical University, Shijiazhuang, Hebei, 050017, People’s Republic of China
Correspondence: Huijuan Ma
Department of Endocrinology, Hebei General Hospital, Shijiazhuang, 050017, People’s Republic of China
, Tel +86 18032838686
, Email [email protected]
Purpose: To explore the association between γ-glutamyl transpeptidase to high-density lipoprotein ratio (GGT/HDL), triglyceride glucose-body mass index (TYG-BMI), and metabolic associated fatty liver disease (MAFLD) in a Chinese population with type 2 diabetes (T2DM) by cross-sectional analysis. To investigate the role of GGT/HDL played in MAFLD by TYG-BMI.
Patients and Methods: A total of 1434 adult patients hospitalized with T2DM at Hebei General Hospital (Shijiazhuang, China) were included in the study. Patients’ demographic and clinical data were collected. Spearman correlation was used to test for an association between GGT/HDL or TYG-BMI and related risk factors of MAFLD among T2DM patients. Multiple logistic regression analyses were performed to investigate the association between GGT/HDL or TYG-BMI and MAFLD. Mediation analysis was used to explore whether TYG-BMI mediated the association between GGT/HDL and MAFLD.
Results: A total of 1434 T2DM patients were enrolled, the MAFLD group showed a higher level of GGT/HDL compared to the non-MAFLD group. There was a progressive increase in the prevalence of MAFLD with increasing tertiles of GGT/HDL. After adjusting for confounding factors, multivariate logistic regression analysis revealed that high levels of GGT/HDL were independent risk factors for MAFLD in T2DM patients. BMI further grouped the patients: ≤ 23kg/m2,> 23kg/m2. GGT/HDL was found to be an independent risk factor for MAFLD but only in T2DM patients with a BMI greater than 23 kg/m2. Mediation analysis indicated that GGT/HDL had a significant direct effect on MAFLD.
Conclusion: GGT/HDL was positively associated with MAFLD incidence in T2DM patients with a BMI greater than 23 Kg/m2, and TYG-BMI partly mediated the association.
Keywords: type 2 diabetes mellitus, GGT/HDL, TYG-BMI, MAFLD
Introduction
Metabolic associated fatty liver disease (MAFLD) was characterized by liver fat depositions accompanied by metabolic dysregulation. Having evolved from the previous term of nonalcoholic fatty liver disease (NAFLD), the term MAFLD more closely implicates the presence of overweight/obesity, type 2 diabetes mellitus (T2DM), or metabolic dysregulation as essential pathogenic factors, leading to better identification of individuals with this metabolic liver disease.1 It is currently the most common chronic liver disease worldwide, with a global prevalence of around 25%. MAFLD imposes a considerable health burden on society, particularly in Europe, America, and the Asia-Pacific.2 MAFLD was increasingly recognized as a leading cause of liver morbidity and mortality. It has been estimated that more than a billion adults worldwide are now affected by MAFLD.2 In recent years, a close link between MAFLD and T2DM has been uncovered; over 70% of the patients with T2DM were perceived to be suffering from MAFLD.3 The development of NAFLD and T2DM share several common pathophysiologic mechanisms, such as IR, inflammation, and oxidative stress.4–7 Recently, some studies have shown that γ-glutamyl transpeptidase (GGT) and high-density lipoprotein cholesterol (HDL) were associated with NAFLD incidence. Cruz et al8 found that the level of GGT was more strongly associated with fatty liver severity than classical inflammatory markers such as Alanine Aminotransferase (ALT). Moreover, several studies have shown that serum GGT values above the median, but still within the normal range, are an independent predictor of cardiovascular mortality,9 stroke,10 T2DM,11 and Mets.12 Chen et al confirmed that elevated GGT was associated with hypersensitive C-reactive protein (hs-CRP), low adiponectin, the presence of chronic kidney disease (CKD), and hepatic steatosis. It was reported that GGT elevation was associated with hepatic steatosis, and fibrosis in patients with nonalcoholic fatty liver disease.13 In Chinese, recent studies explore the decreased GGT levels associated with the improvement of metabolic disturbances after the routine treatment of NAFLD.14 Several recent studies have proposed that GGT may be a simple and reliable marker of visceral and hepatic fat deposition and hepatic steatosis, which can lead to hepatic insulin resistance (IR), and long-term hepatic IR may lead to metabolic abnormalities.15 A decreased concentration of HDL was one of the manifestations of metabolic syndrome.16 MAFLD has been regarded as a liver manifestation of MetS.17 NAFLD presence was shown to be associated with the size and functional heterogeneity of HDL particles.18,19 Previous studies showed impaired HDL cholesterol efflux capacity in NAFLD.20 Karami et al found that HDL anti-oxidative functionality might contribute to NAFLD pathogenesis.21 A new indicator has recently been proposed by Ko et al, namely triglyceride glucose-body mass index (TYG-BMI). Noticeably, TYG-BMI was universally regarded as a more effective predictor of IR (Insulin resistance).22 It was well known that IR was closely related to the genesis and development of MAFLD.23 Given that GGT and HDL were both correlated with MAFLD, a hospital-based cross-sectional study was conducted to evaluate the association between GGT/HDL and the risk of MAFLD in Chinese adult patients with T2DM and investigate the association between GGT/HDL, TYG-BMI, and MAFLD.
Patients and Methods
Study Population
The Ethics Committee approved this study of Hebei General Hospital and the study was performed according to the Declaration of Helsinki. Patients hospitalised in Hebei General Hospital in Shijiazhuang-China from January 1, 2019 to December 31, 2019 were included. All the participants signed informed consent to be part of the study. Based on the preset inclusion and exclusion criteria, eligibility of the studies was evaluated. Inclusion criteria:1. Age ≥18 years.2. The diagnosis of T2DM required the following criteria: 1) Participants were deemed diabetics if they had already been diagnosed with T2DM or were taking insulin or oral hypoglycemic agents. 2)T2DM was diagnosed per the 1999 World Health Organization (WHO) criteria:24 Symptoms of hyperglycemia including Polyuria, polydipsia, polyphagia, weight loss plus random plasma glucose concentration ≥11.1mmol/l or fasting serum glucose was ≥ 7.0 mmol/l or a plasma glucose ≥ 11.1 mmol/L two hours after the glucose load. Patients without typical symptoms of T2DM should be rechecked another day; 3. In this study, the diagnosis of MAFLD was based on hepatic steatosis according to the ultrasonic findings and the presence of T2DM.1
Exclusion criteria: 1.other types of diabetes (eg, type 1 diabetes mellitus (T1DM), gestational diabetes mellitus (GDM) and other specific types); 2.patients had a previous history of myocardial infarction, Cerebral hemorrhage, severe hepato-renal dysfunction, acute infection, and stress condition in the past three months; 3.pregnant women. 4.patients would also be excluded if they had a malignant tumor, history of liver surgery, an earnest, uncontrollable medical condition, or a mental illness that limited their ability to comply with the study requirements.
Study Methods
A medical questionnaire was used to collect general information from each participant. Patient gender, age, duration of T2DM, family history of diabetes, smoking, drinking, hypertension, diabetic retinopathy (DR), diabetic peripheral neuropathy (DPN), diabetic kidney disease (DKD) were collected. BMI was calculated by measuring height and weight twice and calculating the average values. Venous blood was collected from patients on an empty stomach in the early morning of the next day after admission. All laboratory tests were completed in the Clinical Detection Department, using the same instruments and suitable reagents. Blood samples were analyzed for glycosylated hemoglobin (HbA1c), fasting glucose (FBG), albumin, Direct bilirubin (DBIL), Indirect calorimetry (IBIL), Alanine aminotransferase (ALT), Aspartate aminotransferase (AST), γ-glutamyl transpeptidase (GGT), bile acids (BA), uric acid (UA), total cholesterol (TC), triglyceride (TG), HDL, low-density lipoprotein cholesterol (LDL). All data were separately entered into an excel spreadsheet, independently cross-checked by two researchers, and tabulated.
Statistical Analysis
Statistical analyses were conducted using SPSS software, version 25.0. All continuous variables were expressed as mean ± standard deviation if normally distributed. Between-group comparisons were performed using the independent t-test. Data that did not conform to the normal distribution were presented as the median (P25 and P75). Statistical comparisons were made using nonparametric Kruskal–Wallis tests. Categorical variables were presented as n (%). Chi-square tests were utilized to compare categorical variables between the study groups. A Spearman correlation analysis was used to evaluate the correlation between GGT/HDL or TYG-BMI and the potential risk factors of MAFLD. Adjusted analyses were performed using multiple logistic regression to investigate the association between GGT/HDL or TYG-BMI and MAFLD. Mediation analysis was used to explore whether TYG-BMI mediated the association between GGT/HDL and MAFLD. Differences were considered statistically significant for p values < 0.05. This study categorized BMI into two groups: BMI<23kg/m2 and BMI≥23kg/m2. In terms of GGT/HDL level, it was classified into three groups (Q1 (GGT/HDL≤18.87; n=477), Q2 (18.87<GGT/HDL≤33.04; n=478), Q3 (GGT/HDL>33.04; n=479) by tertiles. Calculation formula: TYG-BMI: Ln[TG (mg/ dL) × fasting glucose (mg/dL)/2]*BMI. GGT/HDL: GGT/HDL (mmol/l).
Results
Comparisons of the Clinical Characteristics Between the MAFLD and Non-MAFLD Groups
1434 patients with T2DM were included in the study (Figure 1). There were 856 male and 578 female patients with a mean age of 58.65±15.06 years. In addition, subjects with T2DM were divided into two groups according to the results of liver ultrasonography: MAFLD (n=734) and non-MAFLD (n=700). The proportion of progressive liver fibrosis in the MAFLD group was 40.05%. T2DM participants with MAFLD had significantly higher levels of BMI, DBIL, IBIL, ALT, AST, GGT, FBG, TC, TG, LDL, UA, TYG-BMI, GGT/HDL, as well as lower levels of age, diabetes course, albumin, HDL levels than those in the non-MAFLD group (P < 0.05; Table 1). There was, however, no significant difference between BA, HBA1C levels in the two groups (P >0.05; Table 1).
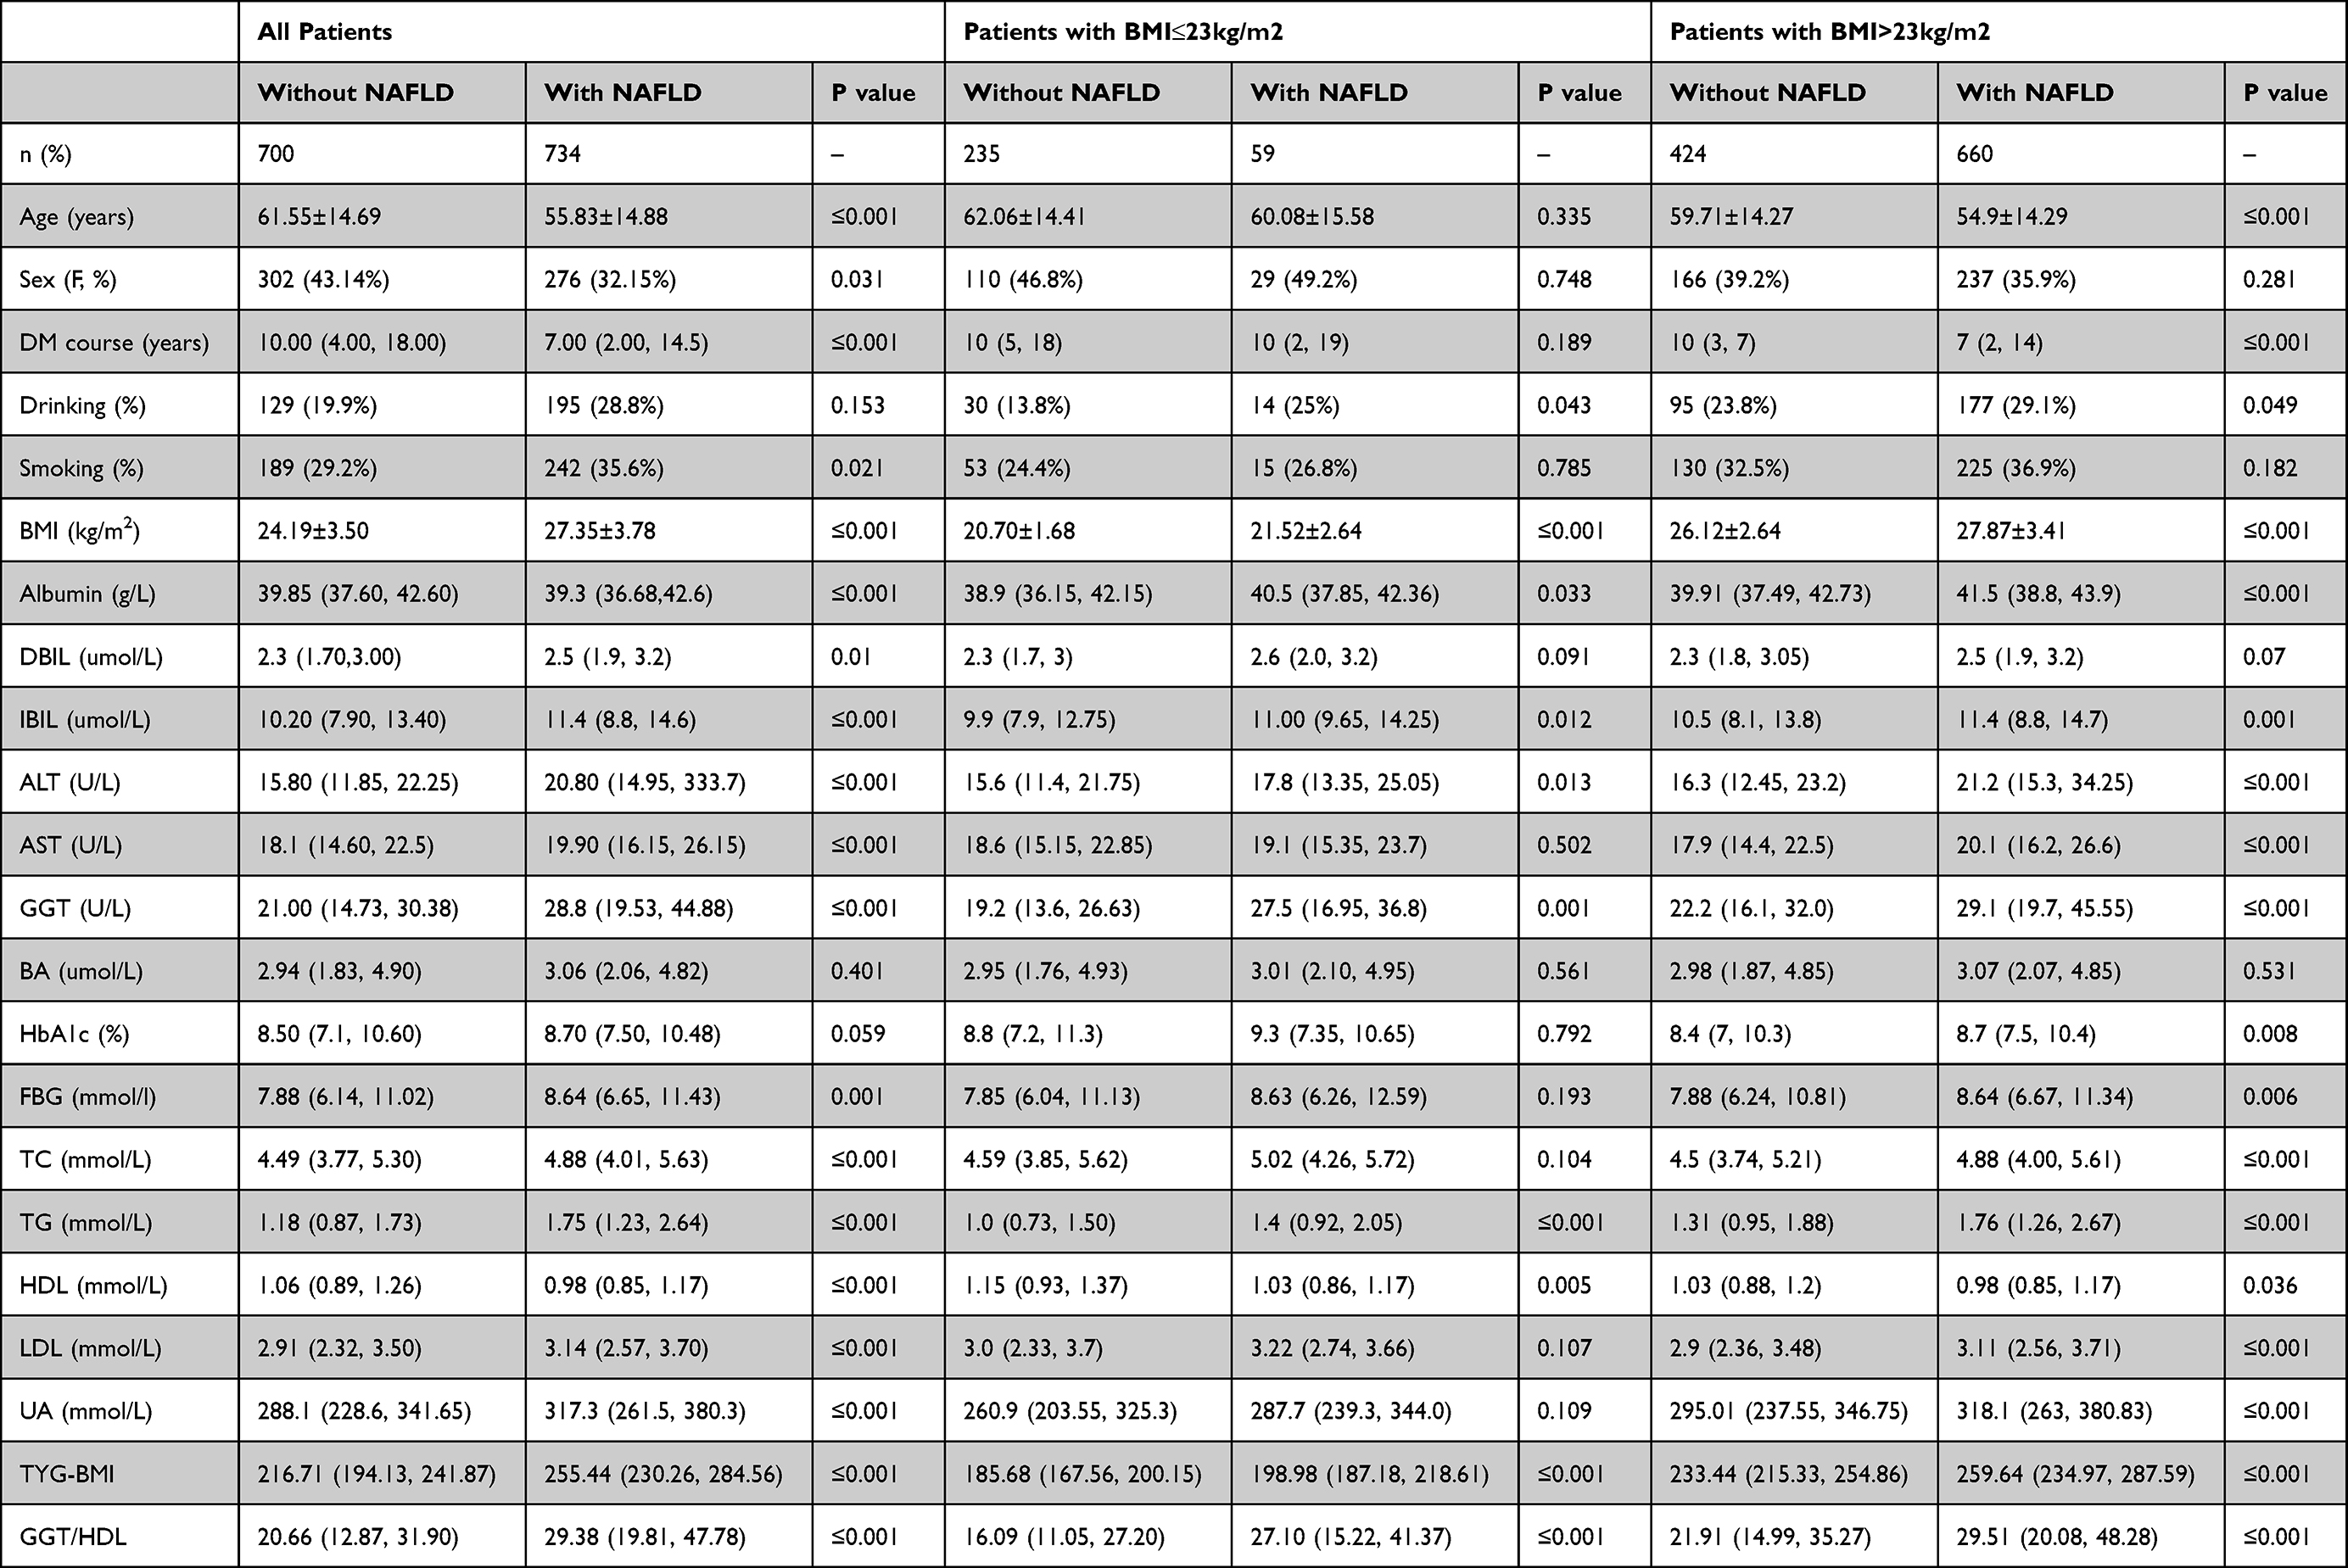 |
Table 1 The Characteristics in This Study |
 |
Figure 1 Flowchart of the patient selection process. |
Based on BMI, patients were divided into two groups: BMI≤23kg/m2 and BMI>23kg/m2. In T2DM patients with BMI<23kg/m2, the BMI, albumin, IBIL, ALT, GGT, TG, TYG-BMI, GGT/HDL levels in the T2DM patients with MAFLD were significantly higher when compared with the T2DM patients without MAFLD, while the HDL level and alcohol drinking prevalence were significantly lower than that in the non-MAFLD group, and a statistically significant difference was observed between the two groups (P<0.05 Table 1). In T2DM patients with BMI≥23kg/m2, compared with the non-MAFLD group, the levels of BMI, albumin, IBIL, ALT, AST, GGT, HBA1C, FBG, TG, TC, LDL, UA, GGT/GHL, TYG-BMI were obviously higher in MAFLD group, whereas HDL, age, diabetes course levels were significantly lower, and the difference was statistically significant (P<0.05 Table 1).
Comparison of MAFLD Prevalence and Clinical Characteristics in T2DM Patients with Different Levels of GGT/HDL
The baseline characteristics of subjects according to GGT/HDL tertiles are shown in Table 2. Participants with higher GGT/HDL ratios showed higher BMI, albumin, DBIL, IBIL, ALT, AST, GGT, BA, HbA1c, FBG, TG, UA, TYG-BMI, and a higher proportion of drinkers, smokers, and men. Conversely, there were lower levels of age, DM course, HDL, and fewer patients with DR, DPN in the tertiles with higher SUA/Cr levels. A positive trend was observed, and with high GGT/HDL tertiles, the prevalence of MAFLD also significantly increased (153 [34.0%] vs 249 [55.1%] vs 297 [65.7%]; P<0.001).
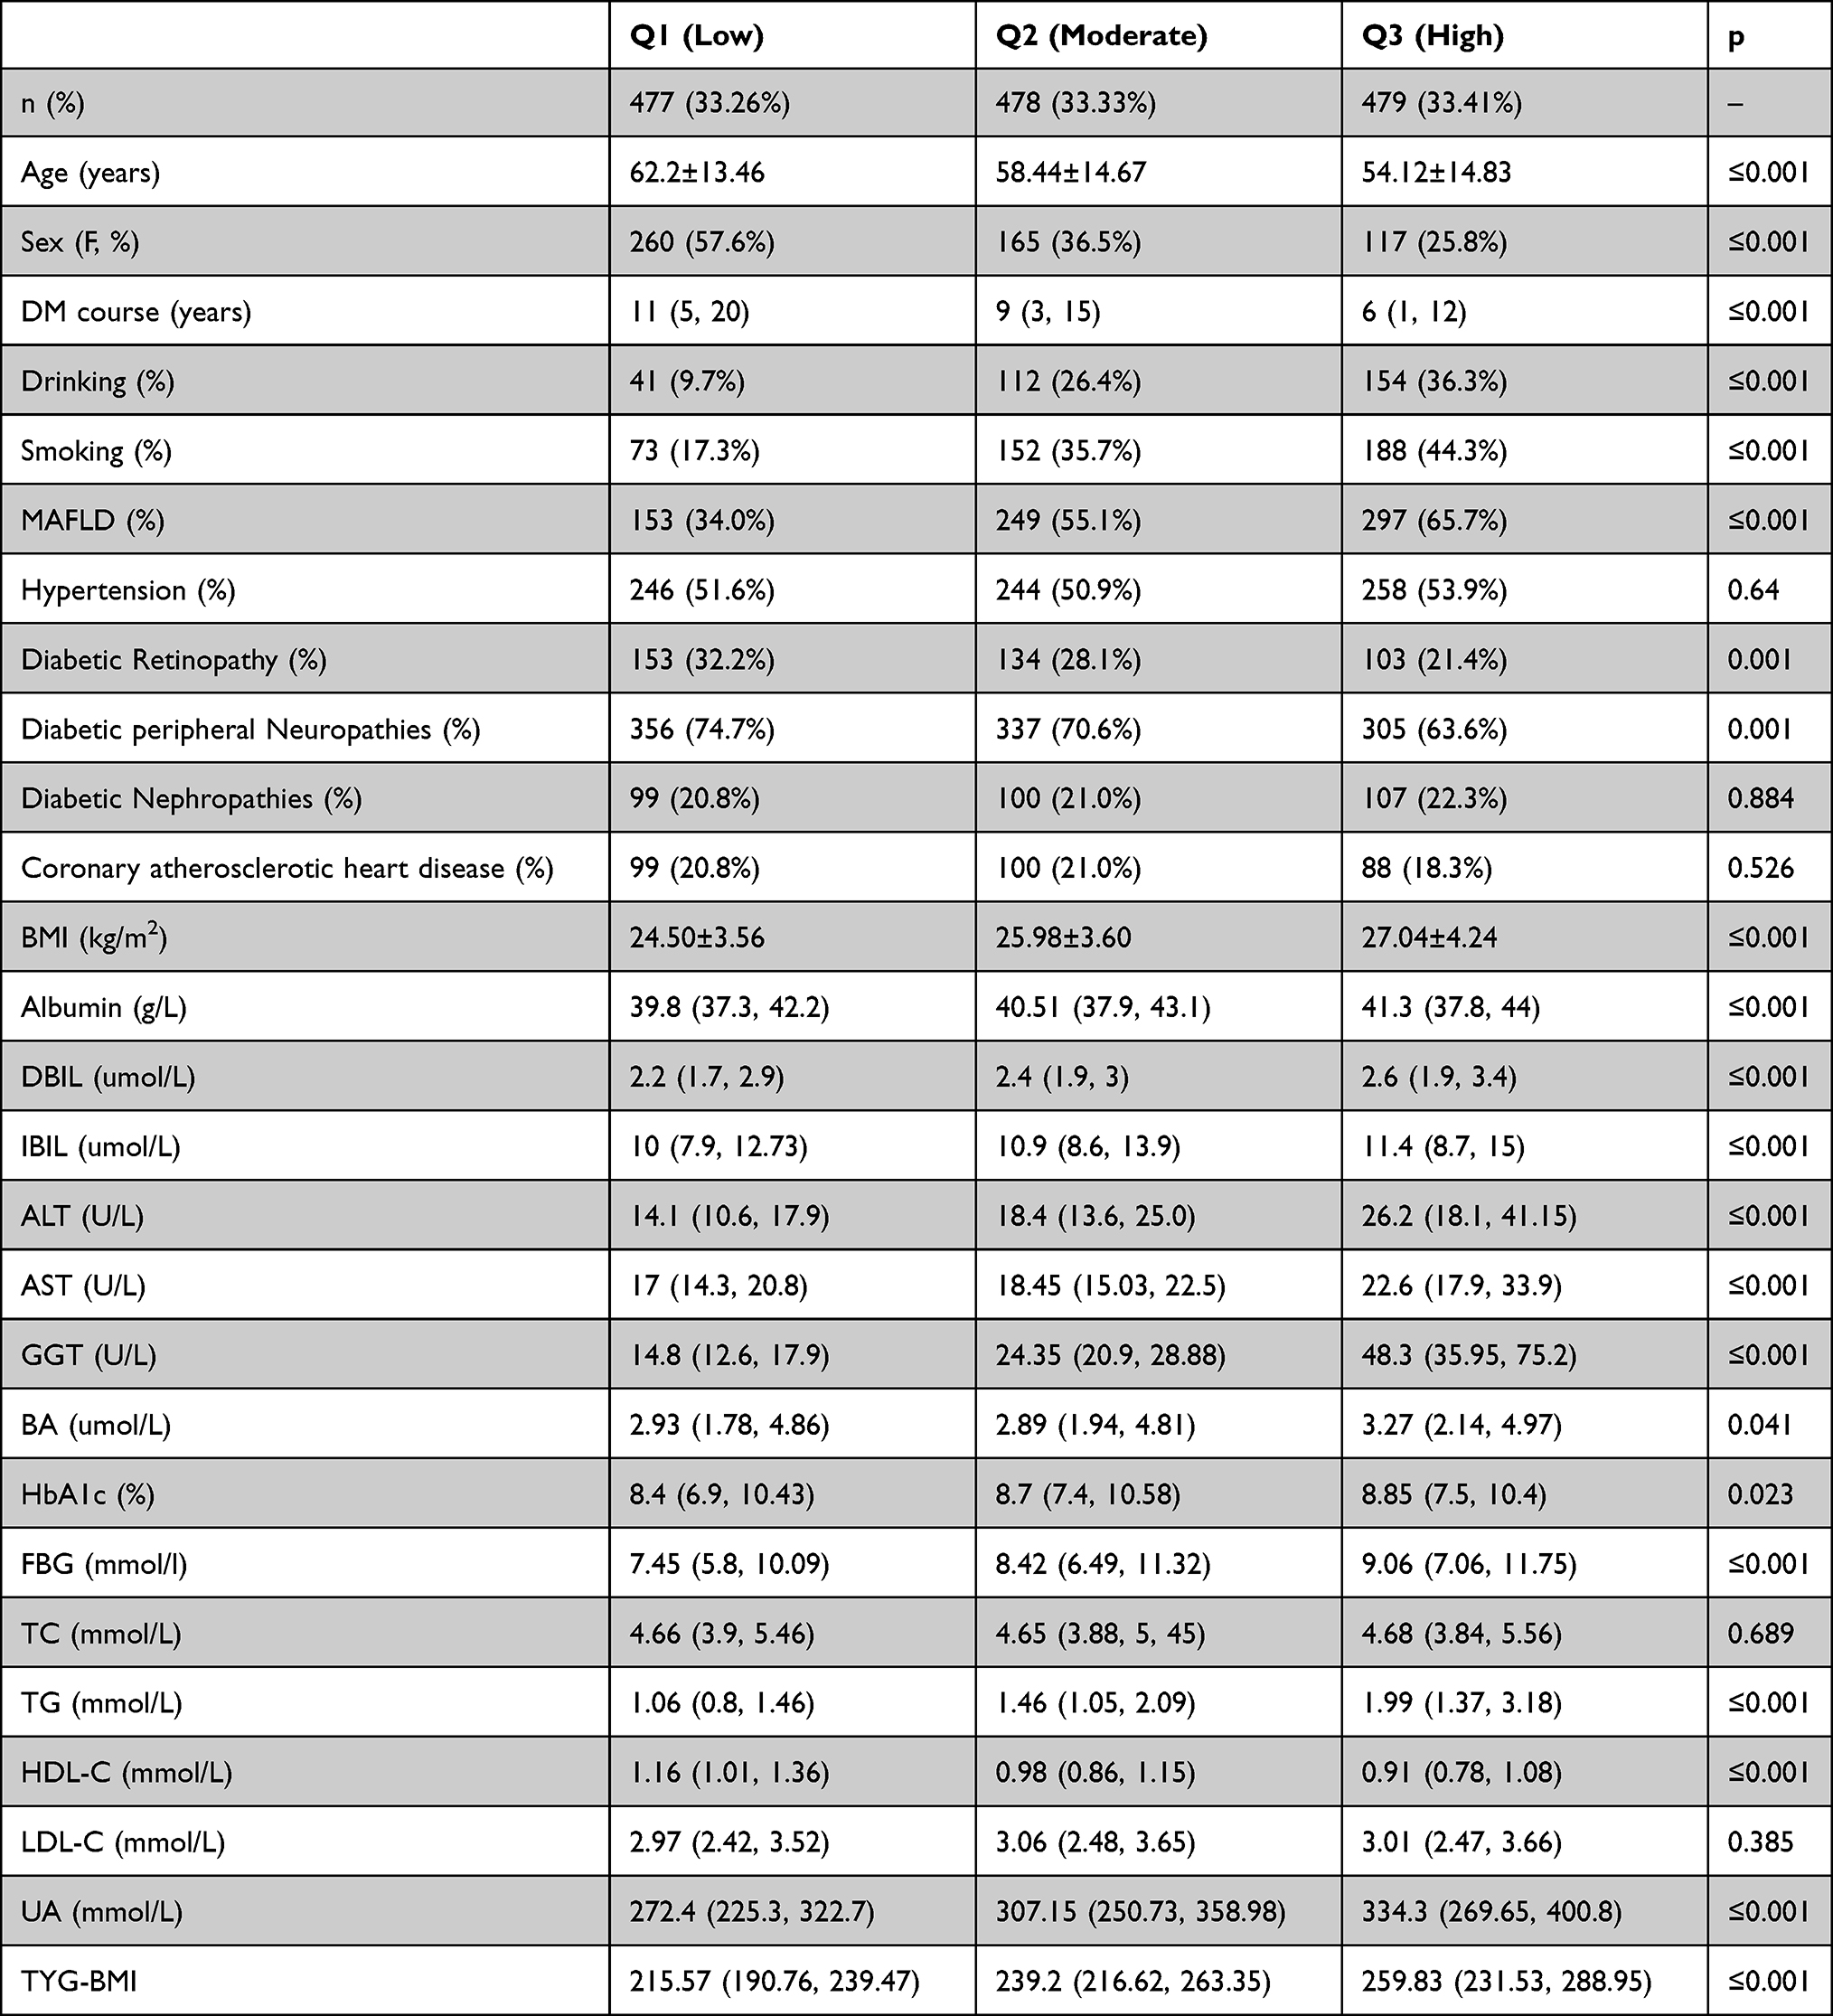 |
Table 2 Clinical Characteristics of Patients with T2DM by GGT/HDL Category |
Spearman Correlation of GGT/HDL or TYG-BMI with Potential MAFLD Risk Factors
As shown in Table 3, Spearman correlation analysis indicated that GGT/HDL was positively correlated with BMI (r=0.289, P≤0.001), ALT (r=0.509, P≤0.001), AST (r=0.370, P≤0.001), TG (r=0.448, P≤0.001), UA (r=0.273, P≤0.001), TYG-BMI (r=0.416, P≤0.001), but negatively correlated with age (r=−0.270, P≤0.001), diabetes course (r=−0.247, P≤0.001), HDL-C (r=−0.442, P≤0.001). Similarly, TYG-BMI was positively correlated with albumin (r=0.214, P≤0.001), ALT (r=0.273, P≤0.001), GGT (r=0.377, P≤0.001), TC (r=0.212, P≤0.001), UA (r=0.286, P≤0.001), GGT/HDL (r=0.416, P≤0.001), but negatively correlated with age (r=−0.322, P≤0.001), diabetes course (r=−0.231, P≤0.001), HDL (r=−0.252, P≤0.001).
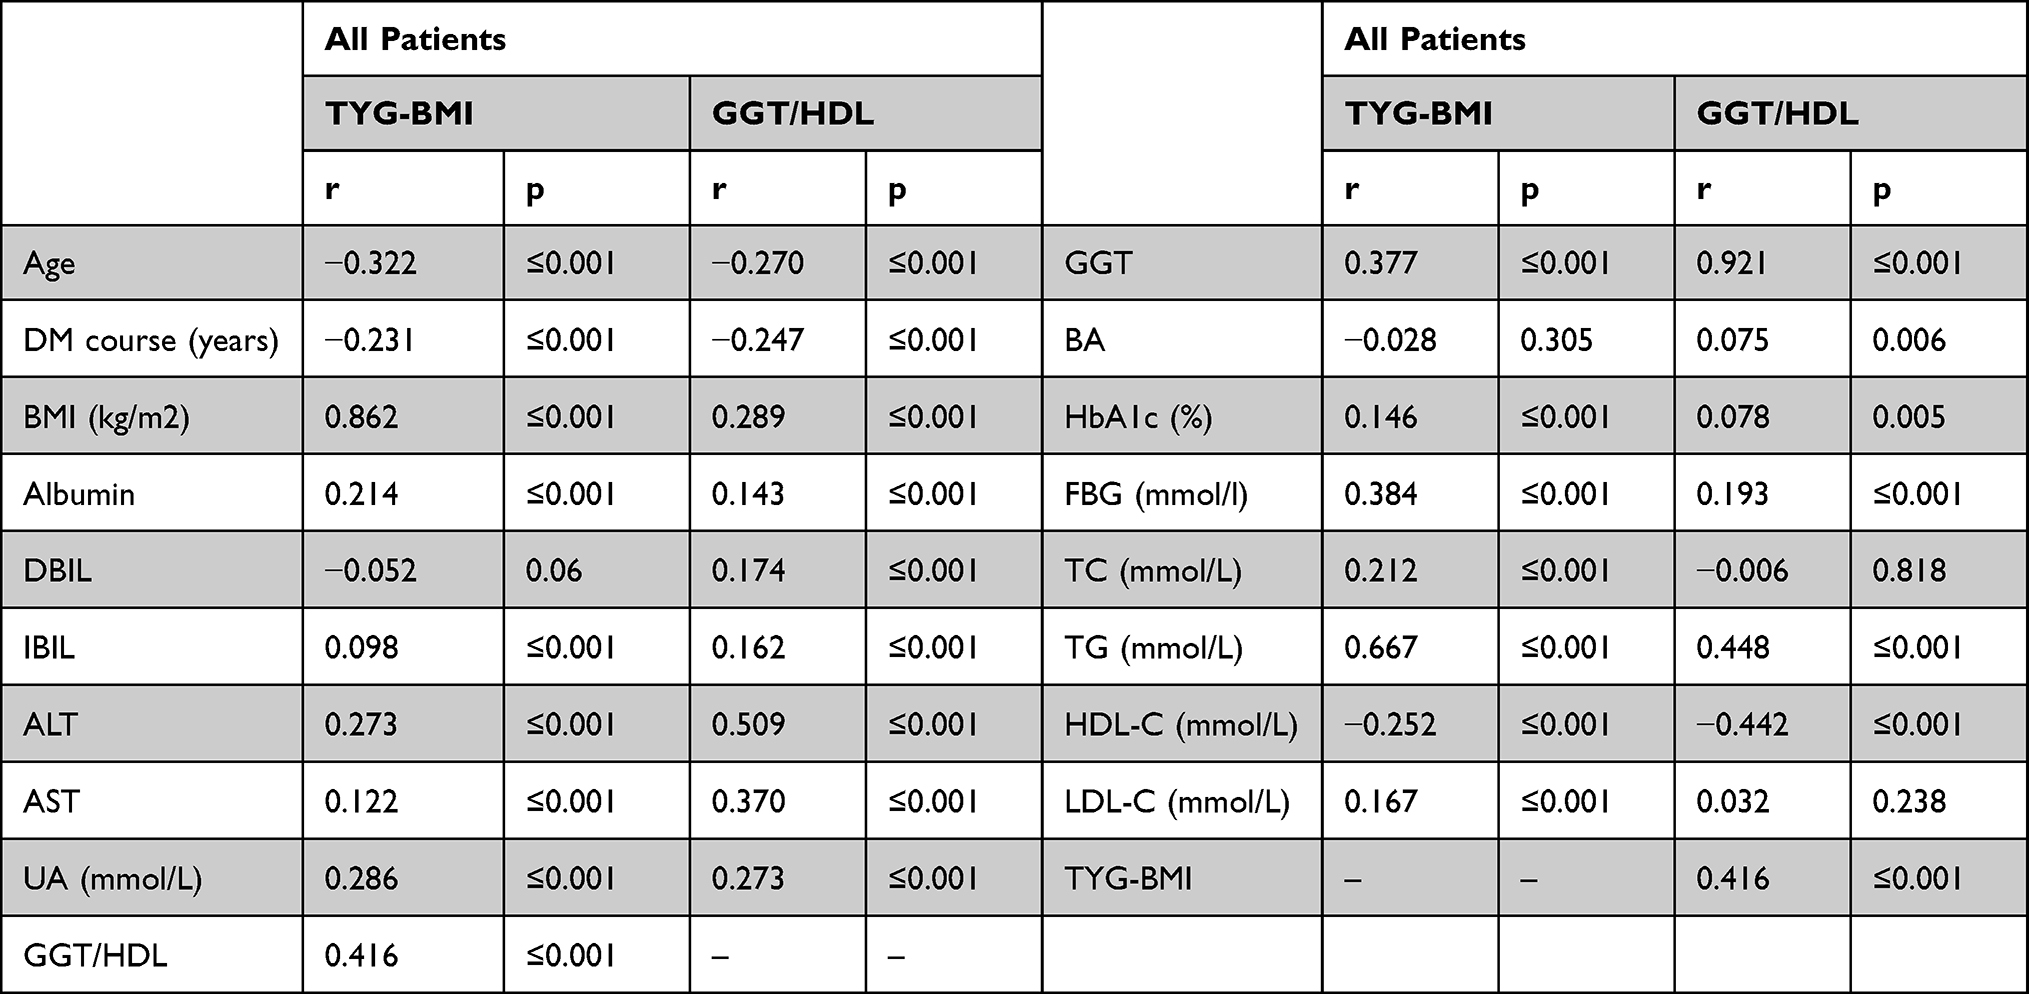 |
Table 3 Spearman Correlation of GGT/HDL or TYG-BMI with Potential MAFLD Risk Factors |
Association Between GGT/HDL and the Prevalence of MAFLD
Multiple logistic analysis indicated a positive association between GGT/HDL and the prevalence of MAFLD after adjustment for the confounders. Collinearity analysis demonstrated no collinearity among the variables. The prevalence of MAFLD in the Q3 group was 1.848 times that of those in the Q1 group[OR=1.848,95% CI: 1.235–2.765, P≤0.001] (Table 4).
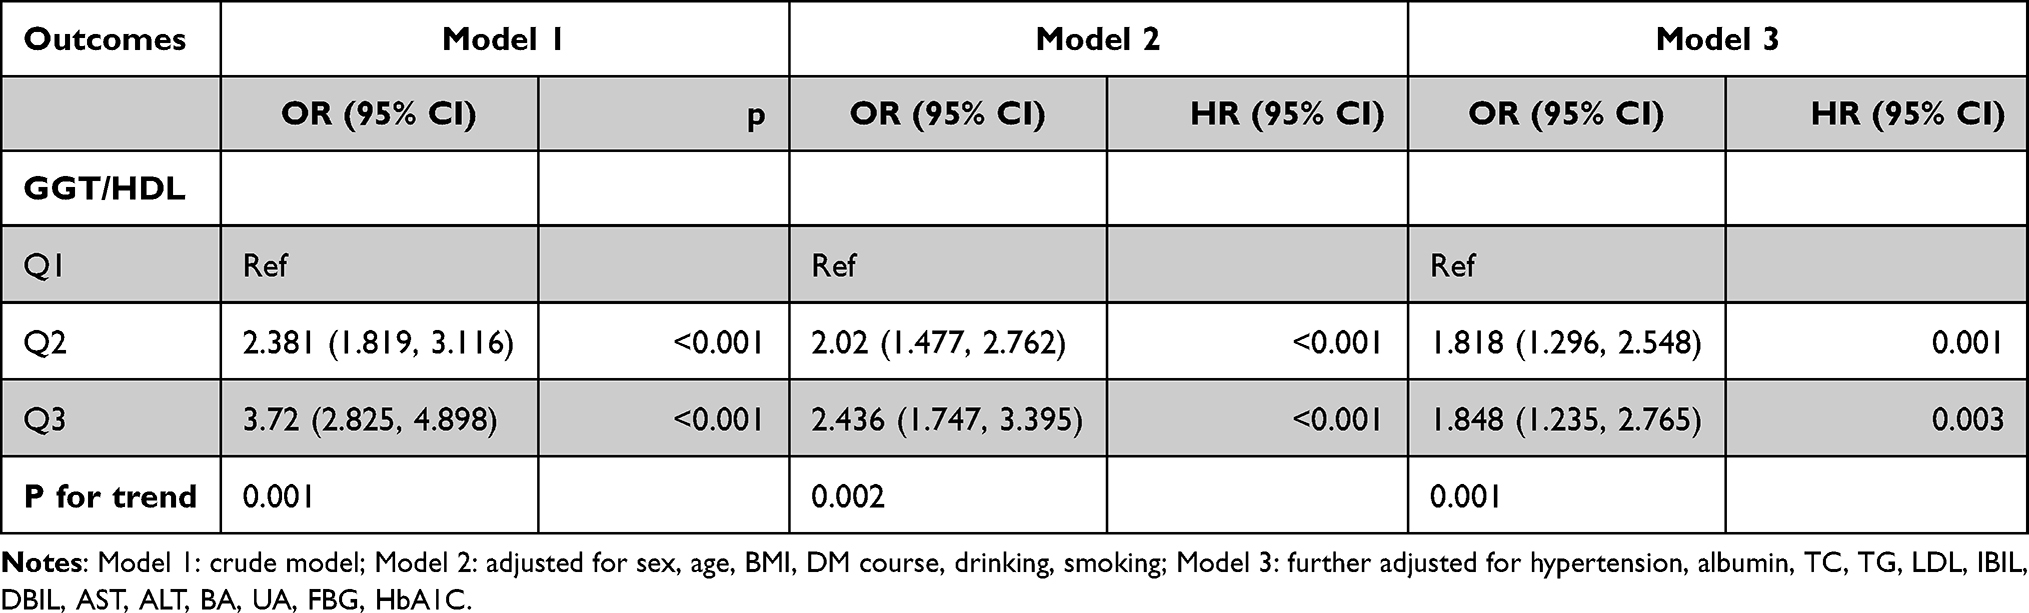 |
Table 4 Logistic Regression Analysis of GGT/HDL for MAFLD in Patients with T2DM |
Among T2DM patients with BMI ≤23kg/m2, multivariate logistic regression analysis revealed that GGT/HDL level was not independent risk factor for MAFLD with and without confounders adjustment (Table 5). Conversely, multivariate logistic regression analysis revealed that GGT/HDL level remained as an independent risk factor for MAFLD after adjusting for the confounders within the T2DM patients with BMI >23kg/m2. We thus found the prevalence of MAFLD was 1.584 times as great in the Q3 group than in the Q1 group[OR=1584,95% CI:1.018–2.465), P=0.041] (Table 6).
 |
Table 5 Logistic Regression Analysis of GGT/HDL for MAFLD in T2DM Patients with BMI >23kg/m2 |
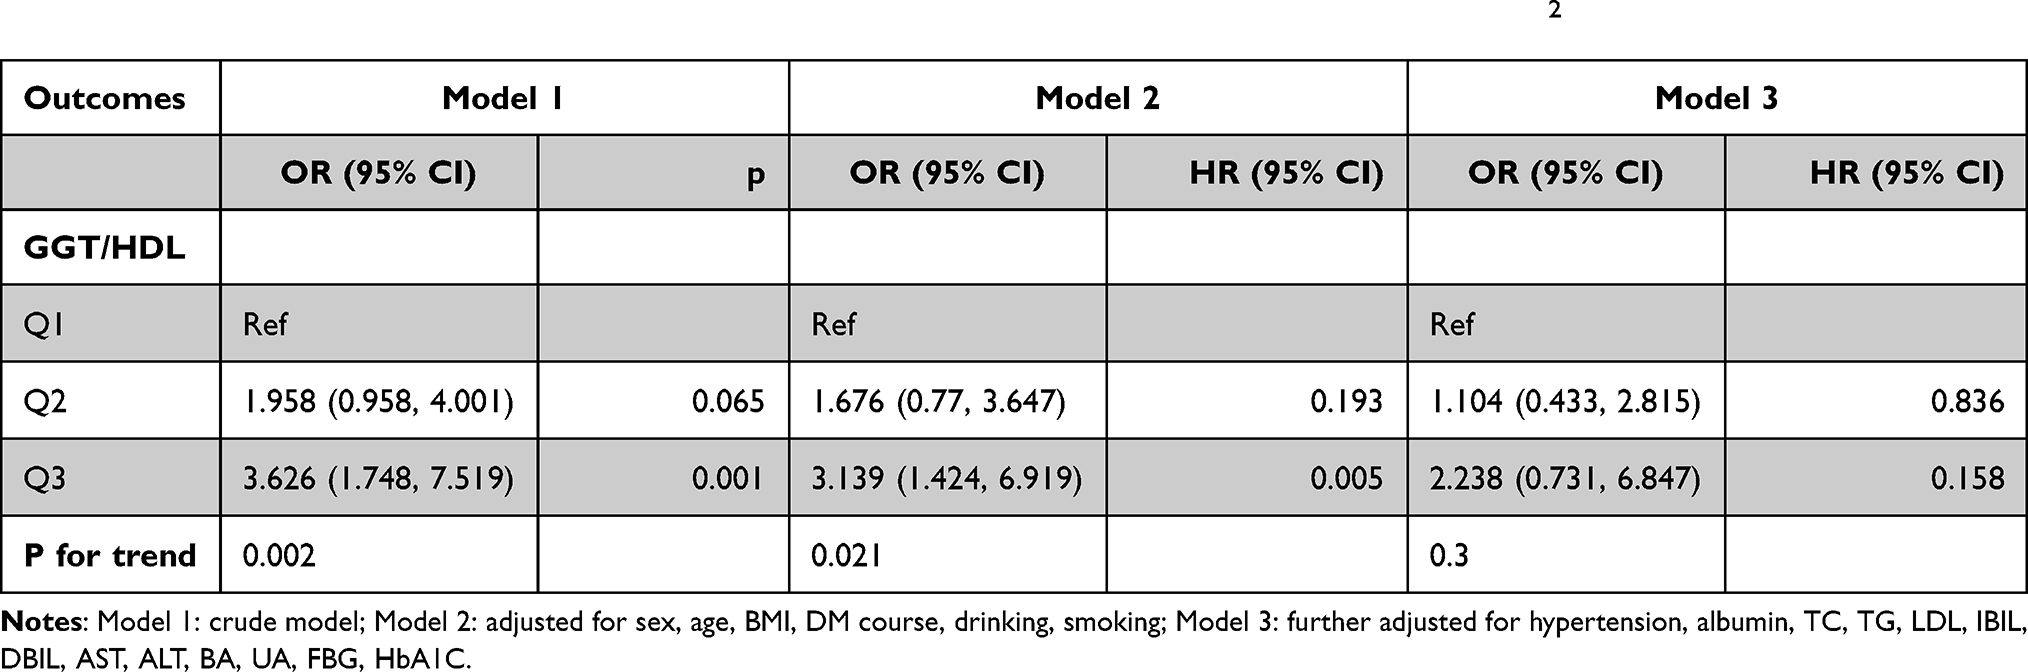 |
Table 6 Logistic Regression Analysis of GGT/HDL for MAFLD in T2DM Patients with BMI ≤23kg/m2 |
Association Between TYG-BMI and the Prevalence of MAFLD
Multivariate logistic regression analysis showed that a high TYG-BMI was an independent risk factor for comorbid MAFLD among patients with T2DM. The prevalence of MAFLD was 1.02 times greater in the Q3 group than in the Q1 group (Table 7).
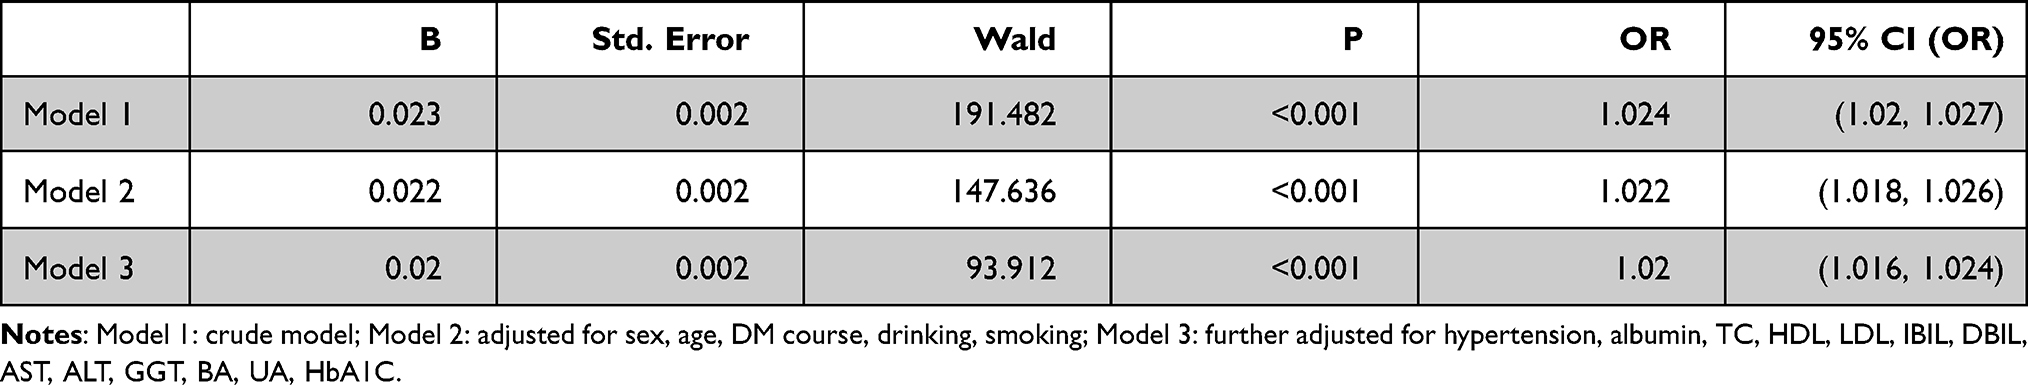 |
Table 7 Logistic Regression Analysis of TYG-BMI for MAFLD in Patients with T2DM |
Mediated Effect of TYG-BMI on the Association Between GGT/HDL and MAFLD
To explore the internal relationships between GGT/HDL, TYG-BMI, and MAFLD, we conducted a mediation analysis to investigate whether TYG-BMI mediated the association between GGT/HDL and MAFLD prevalence in T2DM patients. Both GGT/HDL and TYG-BMI were positively associated with MAFLD prevalence. At the same time, GGT/HDL was positively correlated with TYG-BMI, suggesting a mechanistic link between GGT/HDL and MAFLD (β =0.0030, 95% CI: 0.001—0.0059), possibly explained by TYG-BMI (β =0.0032, 95% CI: 0.0012—0.0064). A mediated percentage of 51.6% for the model (Figure 2A). As shown in Figure 2B, in the T2DM patients with BMI≥23kg/m2, mediation analysis indicated that GGT/HDL had a significant direct effect on MAFLD prevalence (β =0.0033, 95% CI: 0.001—0.0066), and TYG-BMI partly mediated the indirect impact of GGT/HDL on NAFLD incidence (β =0.0019, 95% CI: 0.005—0.0045). A mediated percentage of 36.5% for the model.
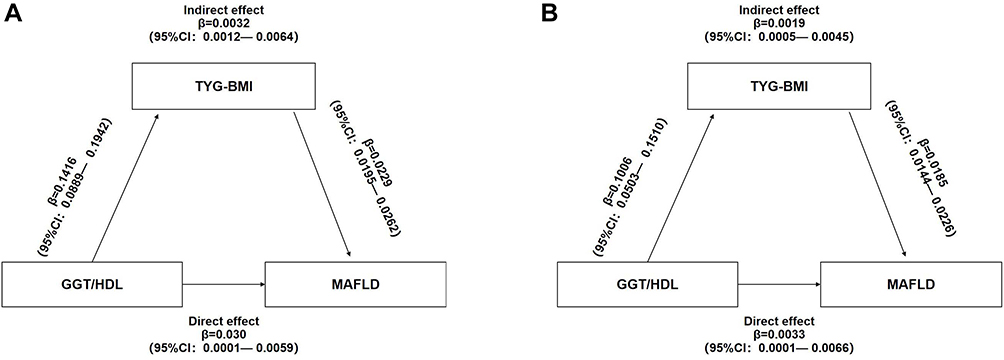 |
Figure 2 Mediation of TYG-BMI on the association between GGT/HDL and MAFLD: (A) all T2DM patients; (B) T2DM patients with BMI >23kg/m2. |
Discussion
The present analyses showed that T2DM patients with MAFLD were at a higher level of GGT/HDL. Through correlation analysis, we found a significant correlation between the level of GGT/HDL and ALT, AST, TYG-BMI in T2DM patients with MAFLD. To improve the power to discriminate the risk of MAFLD prevalence, patients with T2DM were divided into three groups according to the tertile of GGT/HDL: Q1 (lowest), Q2, Q3 (highest). And we found that the prevalence of MAFLD in the Q3 group was 1.848 times that of those in the Q1 group. In addition, the prevalence of MAFLD increased with higher tertile of GGT/HDL, and the association was of statistical significance. According to MAFLD’s definition of overweight/obesity in Asians1 (BMI > 23kg/m2) consequently, we conducted subgroup analyses according to BMI groups. Following our results, Feng et al showed that GGT/HDL levels in NAFLD patients were significantly higher than those in controls.25 They also found GGT/HDL can be considered to predict the prevalence of NAFLD after adjustment for confounding variables in both normal-weight and overweight Chinese populations. The results of our study showed that GGT/HDL was an independent risk factor for the prevalence of MAFLD only in T2DM patients with BMI>23kg/m2, however, this finding was not observed in T2DM patients with BMI ≤23kg/m2. We also found that our patients with MAFLD had worse glycemic and lipid control when BMI≥23kg/m2. Several studies have shown that total GGT activity is associated with NAFLD. Values close to the upper limit of the normal predict the development of T2DM and metabolic syndrome; these associations are more robust in the obese.26–28 In the context of obesity, GGT activity could also be a marker of chronic inflammation associated with decreased levels of adiponectin.29 The serum BA levels of BMI≤23kg/m2 and BMI>23kg/m2 patients were lack of difference in this study. BA-regulated signaling pathways have emerged as attractive targets for understanding the regulation of hepatic TG metabolism in health and disease and treating fatty liver disease and associated metabolic disorders, as evident in BA-mediated control of liver TG.30 It needs to be further studied.
Recently, an international expert consensus statement recommended an updated definition of MAFLD instead of NAFLD. The most notable and essential differences of the diagnostic criteria between MAFLD and NAFLD31 were the absence of exclusion of persons with chronic liver disease and alcohol intake,32 and the necessary condition for the diagnosis of metabolic syndrome.1 MAFLD was considered the manifestation of metabolic syndrome in the liver, affecting nearly 70% of T2DM patients and almost 80% of patients with metabolic syndrome.33,34 That‘s why T2DM patients were evaluated in the presented study.
In summary, the inner mechanisms underlying NAFLD are far from being clarified as per.35 Different mechanisms can be involved. Also, there is convincing evidence that IR was a crucial player in the initiation and progression of MAFLD.36,37 Furthermore, our results indicated that the effect of the GGT/HDL on MAFLD acted partly through TYG-BMI. It is well established that TYG-BMI has been previously shown to be a simple, efficient, and clinically useful surrogate marker of IR.22 According to the research results, TYG-BMI was recommended for investigating IR risk assessment in clinical practice and epidemiologic studies.38 Hossain et al39 found that elevated GGT may risk developing NAFLD. Significant correlation between GGT and HOMA-IR after controlling for the confounders. More recent studies indicated that GGT may be a reliable and straightforward marker of visceral and hepatic fat deposition and that hepatic fat denaturation can lead to hepatic IR, which can lead to metabolic abnormalities in the long term.15 Much research has shown a positive correlation between GGT and IR.40–42 Thus, the increase in GGT may be more reflective of increased IR.
Dyslipidemia is a well-recognized risk factor of MAFLD. In particular, low HDL levels played an essential role in the existence, development of MAFLD,43–46 suggesting the potential role of IR in mediating this process.47 HDL had anti-inflammatory, antioxidant, and antithrombotic properties and was associated with IR, dyslipidemia, atherogenic indices, and obesity.48,49 Simental-Mendía et al found a lower HDL level among patients with MAFLD.50 Alternatively, a decreased HDL level itself was characteristic of metabolic syndromes,16 Moreover, MAFLD was considered to be the manifestation of metabolic syndrome in the liver.
It was confirmed that oxidative stress and chronic inflammation were implicated in carcinogenesis and the development of MAFLD.23 As a surface enzyme, GGT can cleave extracellular glutathione (GSH), maintain the balance of GSH in vivo, and play a key role in alleviating the effects of oxidative stress.51 Previous studies showed that GGT was significantly related to markers of inflammation such as fibrinogen, C-reactive protein, and F2-isoprostanes.52,53 Ortega et al proposed that the increase of liver fat deposition leads to hepatocyte injury and stimulates the synthesis of GGT.54 These increased levels of GGT enhance free radicals and mitochondrial damage, which can cause severe proinflammation and oxidative stress. It was pointed out that GGT was regarded as an oxidative stress marker. Recent studies showed that serum GGT might be useful in oxidative stress estimation,55 Increases in serum GGT activity may respond to oxidative stress, making increased transport of glutathione into cells, supporting a role of serum GGT in the inflammation and oxidative stress. Elevated GGT activity is associated with MS, systemic inflammation, and oxidative stress, and serum GGT activity is widely used as a sensitive indicator of fatty liver disease, hepatic inflammation, and hepatitis.39,51 MetS and T2DM were diseases that the structure of gut microbiota can influence. The administration of prebiotics and probiotics in MetS was accompanied by numerous benefits in improving metabolic parameters such as BMI, insulin resistance, and inflammation parameters. The quality of the microbial flora also influenced numerous pathophysiological processes specific to MetS and T2DM (ie, IR, pro-inflammatory status, regulation of blood sugar or appetite).56,57 Accumulating evidence indicated that gut microbial dysbiosis was associated with the pathogenesis of MAFLD,58 which was related to low-grade inflammation.59 Therefore, GGT/HDL was closely correlated with MAFLD.
There were several potential limitations to the current study. First, as this is a cross-sectional study, causal inferences about the findings cannot be made. Secondly, the diagnosis of MAFLD was based on ultrasonography and was not confirmed by a liver biopsy to determine hepatic steatosis and its severity. Third, our sample was limited to Chinese adults, and it was not clear whether the findings apply to other populations. Despite these limitations, the large, well-characterized sample size, the use of multiple regression models to adjust for many confounding factors, and the fact that the GGT/HDL-C ratio is an easy and inexpensive marker with comprehensive application value were essential strengths of our study.
Conclusion
After adjustments for confounders, elevated GGT/HDL level should be considered as an independent risk factor for MAFLD only in T2DM patients with BMI>23kg/m2, and TYG-BMI partly mediated the association between GGT/HDL and MAFLD. However, prospective longitudinal studies are needed to verify this relationship.
Acknowledgments
The original data can be available by email request at any time (Yuling Xing: [email protected]).
Disclosure
The authors report no conflicts of interest in this work.
References
1. Eslam M, Newsome PN, Sarin SK, et al. A new definition for metabolic dysfunction-associated fatty liver disease: an international expert consensus statement. J Hepatol. 2020;73(1):202–209. doi:10.1016/j.jhep.2020.03.039
2. Younossi ZM, Koenig AB, Abdelatif D, Fazel Y, Henry L, Wymer M. Global epidemiology of nonalcoholic fatty liver disease-meta-analytic assessment of prevalence, incidence, and outcomes. Hepatology. 2016;64(1):73–84. doi:10.1002/hep.28431
3. Arrese M, Barrera F, Triantafilo N, Arab JP. Concurrent nonalcoholic fatty liver disease and type 2 diabetes: diagnostic and therapeutic considerations. Expert Rev Gastroenterol Hepatol. 2019;13(9):849–866.
4. Firneisz G. Non-alcoholic fatty liver disease and type 2 diabetes mellitus: the liver disease of our age?. World J Gastroenterol. 2014;20(27):9072–9089.
5. Tilg H, Moschen AR, Roden M. NAFLD and diabetes mellitus. Nat Rev Gastroenterol Hepatol. 2017;14(1):32–42. doi:10.1038/nrgastro.2016.147
6. Brown MS, Goldstein JL. Selective versus total insulin resistance: a pathogenic paradox. Cell Metab. 2008;7(2):95–96. doi:10.1016/j.cmet.2007.12.009
7. Saponaro C, Gaggini M, Gastaldelli A. Nonalcoholic fatty liver disease and type 2 diabetes: common pathophysiologic mechanisms. Curr Diab Rep. 2015;15(6):607. doi:10.1007/s11892-015-0607-4
8. Cruz MA, Cruz JF, Macena LB, et al. Association of the nonalcoholic hepatic steatosis and its degrees with the values of liver enzymes and homeostasis model assessment-insulin resistance index. Gastroenterol Res. 2015;8(5):260–264. doi:10.14740/gr685w
9. Ruttmann E, Brant LJ, Concin H, Diem G, Rapp K, Ulmer H. Gamma-glutamyltransferase as a risk factor for cardiovascular disease mortality: an epidemiological investigation in a cohort of 163,944 Austrian adults. Circulation. 2005;112(14):2130–2137. doi:10.1161/CIRCULATIONAHA.105.552547
10. Emdin M, Passino C, Donato L, Paolicchi A, Pompella A. Serum gamma-glutamyltransferase as a risk factor of ischemic stroke might be independent of alcohol consumption. Stroke. 2002;33(4):1163–1164. doi:10.1161/01.STR.0000012344.35312.13
11. Nannipieri M, Gonzales C, Baldi S, et al. Liver enzymes, the metabolic syndrome, and incident diabetes: the Mexico City diabetes study. Diabetes Care. 2005;28(7):1757–1762. doi:10.2337/diacare.28.7.1757
12. Lee DS, Evans JC, Robins SJ, et al. Gamma glutamyl transferase and metabolic syndrome, cardiovascular disease, and mortality risk: the Framingham Heart Study. Arterioscler Thromb Vasc Biol. 2007;27(1):127–133. doi:10.1161/01.ATV.0000251993.20372.40
13. Chen LW, Huang MS, Shyu YC, Chien RN. Gamma-glutamyl transpeptidase elevation is associated with metabolic syndrome, hepatic steatosis, and fibrosis in patients with nonalcoholic fatty liver disease: a community-based cross-sectional study. Kaohsiung J Med Sci. 2021;37(9):819–827. doi:10.1002/kjm2.12395
14. Zhou J, Bai L, Zhang XJ, Li H, Cai J. Nonalcoholic fatty liver disease and cardiac remodeling risk: pathophysiological mechanisms and clinical implications. Hepatology. 2021;74(5):2839–2847. doi:10.1002/hep.32072
15. Karp DR, Shimooku K, Lipsky PE. Expression of gamma-glutamyl transpeptidase protects ramos B cells from oxidation-induced cell death. J Biol Chem. 2001;276(6):3798–3804. doi:10.1074/jbc.M008484200
16. Cho J, Hong H, Park S, Kim S, Kang H. Insulin resistance and its association with metabolic syndrome in Korean children. Biomed Res Int. 2017;2017:8728017. doi:10.1155/2017/8728017
17. Marchesini G, Brizi M, Bianchi G, et al. Nonalcoholic fatty liver disease: a feature of the metabolic syndrome. Diabetes. 2001;50(8):1844–1850. doi:10.2337/diabetes.50.8.1844
18. Amor AJ, Pinyol M, Solà E, et al. Relationship between noninvasive scores of nonalcoholic fatty liver disease and nuclear magnetic resonance lipoprotein abnormalities: a focus on atherogenic dyslipidemia. J Clin Lipidol. 2017;11(2):551–561.e557. doi:10.1016/j.jacl.2017.02.001
19. Orozco Morales JA, Medina Urrutia AX, Torres Tamayo M, et al. Effects of fatty liver on the size and composition of high-density lipoprotein cholesterol subpopulations in adolescents with type 2 diabetes mellitus. Pediatr Diabetes. 2020;21(7):1140–1149. doi:10.1111/pedi.13103
20. Fadaei R, Poustchi H, Meshkani R, Moradi N, Golmohammadi T, Merat S. Impaired HDL cholesterol efflux capacity in patients with non-alcoholic fatty liver disease is associated with subclinical atherosclerosis. Sci Rep. 2018;8(1):11691. doi:10.1038/s41598-018-29639-5
21. Karami S, Poustchi H, Sarmadi N, et al. Association of anti-oxidative capacity of HDL with subclinical atherosclerosis in subjects with and without non-alcoholic fatty liver disease. Diabetol Metab Syndr. 2021;13(1):121. doi:10.1186/s13098-021-00741-5
22. Er LK, Wu S, Chou HH, et al. Triglyceride glucose-body mass index is a simple and clinically useful surrogate marker for insulin resistance in nondiabetic individuals. PLoS One. 2016;11(3):e0149731. doi:10.1371/journal.pone.0149731
23. Lim S, Kim JW, Targher G. Links between metabolic syndrome and metabolic dysfunction-associated fatty liver disease. Trends Endocrinol Metab. 2021;32(7):500–514.
24. Alberti KG, Zimmet PZ. Definition, diagnosis and classification of diabetes mellitus and its complications. part 1: diagnosis and classification of diabetes mellitus provisional report of a WHO consultation. Diabetic Med. 1998;15(7):539–553.
25. Feng G, Feng L, Zhao Y. Association between ratio of γ-glutamyl transpeptidase to high-density lipoprotein cholesterol and prevalence of nonalcoholic fatty liver disease and metabolic syndrome: a cross-sectional study. Ann Transl Med. 2020;8(10):634.
26. Mensah GA, Mokdad AH, Ford E, et al. Obesity, metabolic syndrome, and type 2 diabetes: emerging epidemics and their cardiovascular implications. Cardiol Clin. 2004;22(4):485–504.
27. Lim JS, Lee DH, Park JY, Jin SH, Jacobs DR A strong interaction between serum gamma-glutamyltransferase and obesity on the risk of prevalent type 2 diabetes: results from the Third National Health and Nutrition Examination Survey. Clin Chem. 2007;53(6):1092–1098.
28. Lee DH, Ha MH, Kim JH, et al. Gamma-glutamyltransferase and diabetes–a 4 year follow-up study. Diabetologia. 2003;46(3):359–364.
29. Campos SP, Baumann H. Insulin is a prominent modulator of the cytokine-stimulated expression of acute-phase plasma protein genes. Mol Cell Biol. 1992;12(4):1789–1797.
30. Fuchs C, Claudel T, Trauner M. Bile acid-mediated control of liver triglycerides. Semin Liver Dis. 2013;33(4):330–342.
31. Valenti L, Pelusi S. Redefining fatty liver disease classification in 2020. Liver Int. 2020;40(5):1016–1017.
32. European Association for the Study of The Liver, European Association for the Study of Diabetes. EASL-EASD-EASO Clinical Practice Guidelines for the Management of Non-Alcoholic Fatty Liver Disease. Obes Facts. 2016;9(2):65–90. doi:10.1159/000443344
33. Liu W, Baker RD, Bhatia T, Zhu L, Baker SS. Pathogenesis of nonalcoholic steatohepatitis. CMLS. 2016;73(10):1969–1987. doi:10.1007/s00018-016-2161-x
34. Brunt EM, Wong VW, Nobili V, et al. Nonalcoholic fatty liver disease. Nat Rev Dis Primers. 2015;1:15080.
35. Tarantino G, Citro V, Capone D. Nonalcoholic fatty liver disease: a challenge from mechanisms to therapy. J Clinl Med. 2019;9(1):15.
36. Chen S, Guo H, Xie M, Zhou C, Zheng M. Neutrophil: an emerging player in the occurrence and progression of metabolic associated fatty liver disease. Int Immunopharmacol. 2021;97:107609.
37. Sakurai Y, Kubota N, Yamauchi T, Kadowaki T. Role of insulin resistance in MAFLD. Int J Mol Sci. 2021;22(8):4156.
38. Lim J, Kim J, Koo SH, Kwon GC. Comparison of triglyceride glucose index, and related parameters to predict insulin resistance in Korean adults: an analysis of the 2007–2010 Korean National Health and Nutrition Examination Survey. PLoS One. 2019;14(3):e0212963.
39. Hossain IA, Rahman Shah MM, Rahman MK, Ali L. Gamma glutamyl transferase is an independent determinant for the association of insulin resistance with nonalcoholic fatty liver disease in Bangladeshi adults: association of GGT and HOMA-IR with NAFLD. Diabetes Metab Syndr. 2016;10(Suppl 1):S25–S29.
40. Kim CH, Park JY, Lee KU, Kim JH, Kim HK. Association of serum gamma-glutamyltransferase and alanine aminotransferase activities with risk of type 2 diabetes mellitus independent of fatty liver. Diabetes Metab Res Rev. 2009;25(1):64–69.
41. Kang YH, Min HK, Son SM, Kim IJ, Kim YK. The association of serum gamma glutamyltransferase with components of the metabolic syndrome in the Korean adults. Diabetes Res Clin Pract. 2007;77(2):306–313.
42. Lee MY, Koh SB, Koh JH, et al. Relationship between gamma-glutamyltransferase and metabolic syndrome in a Korean population. Diabetic Med. 2008;25(4):469–475.
43. Katsiki N, Mikhailidis DP, Mantzoros CS. Non-alcoholic fatty liver disease and dyslipidemia: an update. Metabolism. 2016;65(8):1109–1123.
44. Ren XY, Shi D, Ding J, et al. Total cholesterol to high-density lipoprotein cholesterol ratio is a significant predictor of nonalcoholic fatty liver: Jinchang cohort study. Lipids Health Dis. 2019;18(1):47.
45. Speliotes EK, Massaro JM, Hoffmann U, et al. Fatty liver is associated with dyslipidemia and dysglycemia independent of visceral fat: the Framingham Heart Study. Hepatology. 2010;51(6):1979–1987.
46. Tomizawa M, Kawanabe Y, Shinozaki F, et al. Triglyceride is strongly associated with nonalcoholic fatty liver disease among markers of hyperlipidemia and diabetes. Biomel Rep. 2014;2(5):633–636.
47. Sinn DH, Gwak GY, Park HN, et al. Ultrasonographically detected non-alcoholic fatty liver disease is an independent predictor for identifying patients with insulin resistance in non-obese, non-diabetic middle-aged Asian adults. Am J Gastroenterol. 2012;107(4):561–567. doi:10.1038/ajg.2011.400
48. Barbalho SM, Tofano RJ, de Oliveira MB, et al. HDL-C and non-HDL-C levels are associated with anthropometric and biochemical parameters. J Vasc Bras. 2019;18:e20180109. doi:10.1590/1677-5449.180109
49. Fadaei R, Meshkani R, Poustchi H, et al. Association of carotid intima media thickness with atherogenic index of plasma, apo B/apo A-I ratio and paraoxonase activity in patients with non-alcoholic fatty liver disease. Arch Physiol Biochem. 2019;125(1):19–24. doi:10.1080/13813455.2018.1429475
50. Simental-Mendía LE, Rodríguez-Morán M, Gómez-Díaz R, Wacher NH, Rodríguez-Hernández H, Guerrero-Romero F. Insulin resistance is associated with elevated transaminases and low aspartate aminotransferase/alanine aminotransferase ratio in young adults with normal weight. Eur J Gastroenterol Hepatol. 2017;29(4):435–440. doi:10.1097/MEG.0000000000000811
51. Ndrepepa G, Colleran R, Kastrati A. Gamma-glutamyl transferase and the risk of atherosclerosis and coronary heart disease. Clin Chim Acta. 2018;476:130–138. doi:10.1016/j.cca.2017.11.026
52. Lee DH, Jacobs DR Gross M, et al. Gamma-glutamyltransferase is a predictor of incident diabetes and hypertension: the Coronary Artery Risk Development in Young Adults (CARDIA) study. Clin Chem. 2003;49(8):1358–1366. doi:10.1373/49.8.1358
53. Liu CF, Gu YT, Wang HY, Fang NY. Gamma-glutamyltransferase level and risk of hypertension: a systematic review and meta-analysis. PLoS One. 2012;7(11):e48878. doi:10.1371/journal.pone.0048878
54. Ortega E, Koska J, Salbe AD, Tataranni PA, Bunt JC. Serum gamma-glutamyl transpeptidase is a determinant of insulin resistance independently of adiposity in Pima Indian children. J Clin Endocrinol Metab. 2006;91(4):1419–1422. doi:10.1210/jc.2005-1783
55. Hsueh WA, Quiñones MJ. Role of endothelial dysfunction in insulin resistance. Am J Cardiol. 2003;92(4a):10j–17j. doi:10.1016/S0002-9149(03)00611-8
56. Corb Aron RA, Abid A, Vesa CM, et al. Recognizing the benefits of pre-/probiotics in metabolic syndrome and type 2 diabetes mellitus considering the influence of akkermansia muciniphila as a key gut bacterium. Microorganisms. 2021;9(3):618.
57. Pavel FM, Vesa CM, Gheorghe G, et al. Highlighting the relevance of gut microbiota manipulation in inflammatory bowel disease. Diagnostics. 2021;11(6):1090.
58. Sharpton SR, Schnabl B, Knight R, Loomba R. Current concepts, opportunities, and challenges of gut microbiome-based personalized medicine in nonalcoholic fatty liver disease. Cell Metab. 2021;33(1):21–32. doi:10.1016/j.cmet.2020.11.010
59. Plaza-Díaz J, Solis-Urra P, Aragón-Vela J, Rodríguez-Rodríguez F, Olivares-Arancibia J, Álvarez-Mercado AI. Insights into the impact of microbiota in the treatment of NAFLD/NASH and its potential as a biomarker for prognosis and diagnosis. Biomedicines. 2021;9(2):145.
 © 2022 The Author(s). This work is published and licensed by Dove Medical Press Limited. The
full terms of this license are available at https://www.dovepress.com/terms
and incorporate the Creative Commons Attribution
- Non Commercial (unported, 3.0) License.
By accessing the work you hereby accept the Terms. Non-commercial uses of the work are permitted
without any further permission from Dove Medical Press Limited, provided the work is properly
attributed. For permission for commercial use of this work, please see paragraphs 4.2 and 5 of our Terms.
© 2022 The Author(s). This work is published and licensed by Dove Medical Press Limited. The
full terms of this license are available at https://www.dovepress.com/terms
and incorporate the Creative Commons Attribution
- Non Commercial (unported, 3.0) License.
By accessing the work you hereby accept the Terms. Non-commercial uses of the work are permitted
without any further permission from Dove Medical Press Limited, provided the work is properly
attributed. For permission for commercial use of this work, please see paragraphs 4.2 and 5 of our Terms.