
Back to Journals » International Journal of General Medicine » Volume 19
Associations Between Exercise Blood Pressure Responses and Oxygen Pulse During Cardiopulmonary Exercise Testing: A Cross-Sectional Study
Authors Wang Y  , Li Z, Wu F, Li G, Tao M
Received 11 March 2026
Accepted for publication 12 May 2026
Published 28 May 2026 Volume 2026:19 608564
DOI https://doi.org/10.2147/IJGM.S608564
Checked for plagiarism Yes
Review by Single anonymous peer review
Peer reviewer comments 2
Editor who approved publication: Dr Redoy Ranjan
Yuanyuan Wang,1 Zhaofeng Li,2 Fang Wu,1 GuangZhou Li,2 Mingli Tao2
1Cardiac Rehabilitation Center, RiZhao Hospital Affiliated to QingDao University / RiZhao International Heart Hospital, Rizhao, Shandong, 276800, People’s Republic of China; 2Department of Cardiology, RiZhao Hospital Affiliated to QingDao University / RiZhao International Heart Hospital, Rizhao, Shandong, 276800, People’s Republic of China
Correspondence: Yuanyuan Wang, Email [email protected]
Objective: To observe the impact of exaggerated blood pressure response during exercise on oxygen pulse (O2pulse), facilitating earlier and more precise identification of the subclinical threat of hypertension.
Methods: This cross-sectional study consecutively enrolled 262 patients with exaggerated blood pressure response (EBPR) (March 2023–March 2025). Based on peak O2pulse ≥ 80% of predicted value, patients were divided into Normal (n=149) and Reduced O2pulse (n=113) groups. Baseline characteristics, laboratory findings, and CPET parameters were collected. Binary logistic regression analysis was used to identify independent factors associated with reduced peak O2pulse ratio. Multiple linear regression models were employed with the relative increase of O2pulse before and after the anaerobic threshold (AT) as dependent variables to explore the associations of blood pressure increase and metabolic equivalent (MET)-adjusted blood pressure increase with changes in O2pulse relative increase.
Results: Compared with the Normal O2pulse group, the Reduced O2pulse group had a higher proportion of males, younger age, higher BMI, and worse metabolic profiles. Logistic regression identified advanced age and alcohol consumption as independent risk factors for reduced peak O2pulse, while female sex was protective. Regarding blood pressure, unadjusted SBP increase correlated positively with peak O2pulse ratio and O2pulse relative increase, whereas MET‑adjusted SBP increase showed a significant negative correlation with both. This inverse association suggests that an exaggerated blood pressure response per unit metabolic demand is linked to compromised cardiac pumping efficiency.
Conclusion: The negative correlation between ΔSBP/MET and O2pulse suggests that an exaggerated blood pressure response may come at the cost of compromised cardiac pumping efficiency. An excessively high ΔSBP/MET value often indicates more significant changes in the structure and function of the heart, and is an aspect that requires particular attention in the future.
Keywords: oxygen pulse, O2pulse, cardiopulmonary exercise testing, CPET, exaggerated blood pressure response, EBPR
Introduction
Exaggerated blood pressure response (EBPR) refers to an abnormally elevated blood pressure during physical exertion. This phenomenon is observed not only in patients with diagnosed hypertension but also in a considerable proportion of individuals with normal resting blood pressure, a population that faces a significantly increased risk of developing sustained hypertension and major adverse cardiovascular events in the future.1–4 Therefore, a deeper understanding of the hemodynamic mechanisms underlying EBPR is of great significance for elucidating the intrinsic nature of its adverse prognosis.
The cardiopulmonary exercise test (CPET) is the current gold standard for assessing cardiovascular responses to exercise. Oxygen pulse (O2pulse), defined as the ratio of oxygen uptake to heart rate, serves as a reliable indirect indicator of stroke volume efficiency in the absence of severe anemia or metabolic abnormalities.5,6 Unlike assessments of cardiac function that rely solely on resting conditions, the trend of O2pulse during exercise can reflect, in real time, the heart’s capacity to mobilize reserves during progressively increasing exercise workload.7,8 Previous studies have confirmed that an early plateau in the O2pulse curve is closely associated with impaired myocardial perfusion,9,10 suggesting that the morphological characteristics of O2pulse—rather than merely its peak absolute value—may provide incremental information for evaluating cardiac function. However, existing research on EBPR has predominantly focused on isolated factors such as sympathetic overactivation and vascular endothelial function, with few studies systematically investigating, from the perspective of O2pulse changes, the intrinsic relationship between blood pressure response patterns and cardiac work efficiency.11,12 Little is known about whether and how the intensity of blood pressure response, particularly when adjusted for metabolic demand, relates to the efficiency of cardiac pumping as reflected by O2pulse changes during exercise.
It is noteworthy that relying solely on absolute peak blood pressure values may introduce bias in assessing exercise-related risk. For instance, highly fit individuals can also achieve high peak systolic blood pressure during exercise. In such cases, adjusting for workload or metabolic equivalents (METs) allows for a more precise isolation of the impact of exercise intensity on cardiac output.13,14 Consequently, analyzing the correlation between MET-adjusted blood pressure increase and the trend of O2pulse may help clarify the hemodynamic essence of EBPR: whether it is predominantly characterized by an “excessive increase in cardiac output” or by “impaired cardiac pumping efficiency”.
Against this background, the present study adopted a cross-sectional design, using the trend of O2pulse during exercise as an entry point to systematically investigate the intrinsic relationship between the intensity of the exercise blood pressure response and cardiac work efficiency. We hypothesized that a higher MET‑adjusted increase in systolic blood pressure (ΔSBP/MET) would be associated with a lower O2pulse relative increase and a reduced peak O2pulse ratio. Identifying such a hemodynamic pattern may improve early risk stratification for individuals with EBPR, especially those with normal resting blood pressure who are often overlooked in routine clinical practice. This study aims to investigate the impact of an exaggerated blood pressure response during exercise on peak O2pulse and its trend, thereby facilitating an earlier and more precise understanding of the masked threats associated with exertional hypertension.
Materials and Methods
Study Design and Participants
This cross-sectional study consecutively enrolled 480 patients who underwent CPET at RiZhao International Heart Hospital between March 2023 and March 2025 and demonstrated an EBPR was defined as peak systolic blood pressure ≥210 mmHg in men or ≥190 mmHg in women during exercise.2 In accordance with the STROBE statement, 164 patients were excluded due to age >75 years, severe coronary artery disease without complete revascularization, hypertrophic cardiomyopathy, or severe heart failure (NYHA class III–IV). An additional 54 patients were excluded due to missing or duplicate data, resulting in a final analysis cohort of 262 patients with EBPR. Based on the percentage of predicted peak O2pulse achieved,15–17 patients were divided into two groups: the Normal O2pulse group (peak O2pulse ≥80% of predicted value, n=149) and the Reduced O2pulse group (peak O2pulse <80% of predicted value, n=113). Detailed inclusion and exclusion criteria are presented in Figure 1. The study was approved by the Ethics Committee of RiZhao International Heart Hospital (Approval No.: rzxzbyyll2021003) and was conducted in accordance with the Declaration of Helsinki. Written informed consent for the CPET procedure was obtained from all participants.
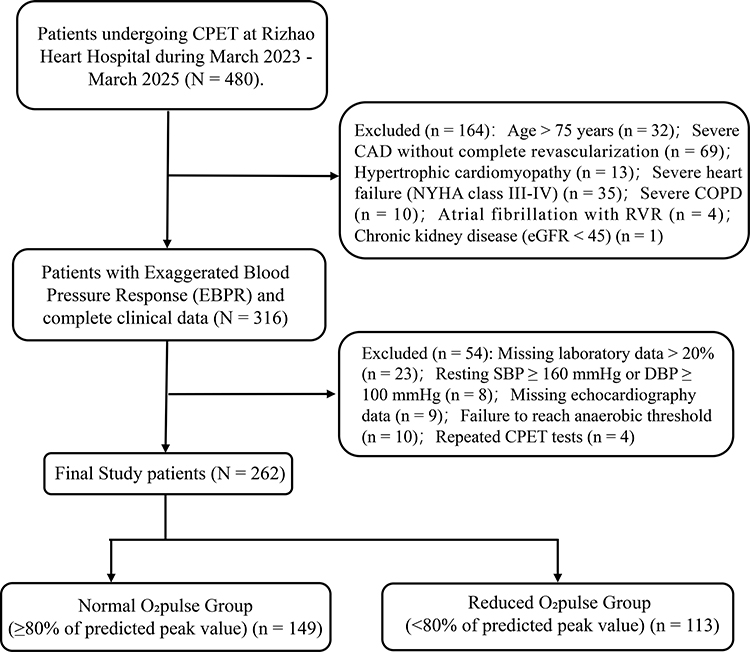 |
Figure 1 Flowchart of Patient Selection and Group Stratification. |
Inclusion Criteria: (1) Underwent CPET; (2) Increase in systolic blood pressure ≥20 mmHg per MET during exercise; (3) Peak systolic blood pressure during exercise met the criteria of ≥210 mmHg for men or ≥190 mmHg for women; (4) Complete clinical data available; (5) Provided informed consent.
Exclusion Criteria: (1) Age >75 years; (2) Severe coronary artery disease without complete revascularization (complete revascularization was defined as successful PCI or CABG for all stenoses ≥ 70% in epicardial vessels ≥ 2.5 mm in diameter, with no residual stenosis ≥ 50% post-procedure);18 (3) Hypertrophic cardiomyopathy; (4) Severe heart failure (NYHA functional class III–IV); (5) Pregnancy or gestational period; (6) Poor compliance due to mental illness; (7) Missing or duplicate clinical data.
CPET Protocol
CPET was performed using a Schiller CS-200 ergospirometry system (Schiller AG, Switzerland). The test was conducted by physicians/therapists with over one year of experience, following the guidelines of the American Heart Association and the American College of Sports Medicine.19 Participants were instructed to fast for at least 2 hours and avoid caffeine or tea prior to testing. A ramp protocol on a cycle ergometer was used for all tests. After at least 2 minutes of rest and 3 minutes of warm-up (0 W, 60 rpm), the workload increased incrementally each minute based on a pre-estimated ramp rate. The test was followed by a 5-minute recovery period. Indications for test termination included severe hypertension (SBP ≥250 mmHg and/or DBP ≥130 mmHg), significant ST-segment depression (≥0.1 mV) or elevation, new-onset severe arrhythmia, moderate-to-severe angina or dyspnea, leg weakness, dizziness, or extreme fatigue (Borg scale ≥18). In the absence of these criteria, patients were encouraged to exercise to maximal effort (respiratory exchange ratio, RER >1.10).
Measurements and Data Analysis
Blood Pressure Measurement
Brachial blood pressure was measured and recorded every 2 minutes throughout the test. Resting blood pressure was defined as the value measured after at least 5 minutes of rest before CPET. Anaerobic threshold (AT) blood pressure was measured within 2 minutes of reaching the AT. Peak blood pressure was defined as the highest value recorded during the final 2 minutes of exercise.
Echocardiographic Measurements
All patients underwent transthoracic echocardiography within 24 hours before cardiopulmonary exercise testing, performed by the same experienced echocardiographer. Examinations were conducted using a Philips EPIQ 7C ultrasound system equipped with an S5-1 transducer (1–5 MHz). Patients were placed in the left lateral decubitus position with simultaneous electrocardiographic monitoring, and images were acquired at end-expiration during quiet breathing. All measurements were averaged over three consecutive cardiac cycles.
MET Calculation
The blood pressure response per MET was calculated as the change in BP divided by the change in METs during specific phases. ΔDBP/MET (Rest-AT) and ΔDBP/MET (AT-Peak) were calculated similarly for diastolic BP. ΔSBP/MET (Rest-AT): (SBP@AT - SBP@Rest) / (METs@AT - METs@Rest). ΔSBP/MET (AT-Peak): (SBP@Peak - SBP@AT) / (METs@Peak - METs@AT).
CPET Parameters
Measured parameters included oxygen uptake (VO2), O2pulse, metabolic equivalents (METs), minute ventilation (VE), the VE/VCO2 slope, end-tidal partial pressures of O2 and CO2 (PETO2 and PETCO2), work rate (WR), heart rate (HR), and breathing reserve. Peak VO2 was defined as the average value during the last 15 seconds of exercise. The predicted percentage of peak VO2 (VO2peak/pred) and peak O2pulse (O2pulse/pred) were calculated. The AT was determined using the V-slope method combined with ventilatory equivalents.
O2pulse Relative Increase Calculation
To quantitatively analyze the trend of the O2pulse curve, we defined the relative increase in two distinct phases segmented by the AT (Figure 2). The O2pulse relative increase from rest to AT was calculated as: (O2pulse at AT - O2pulse at Rest) / O2pulse at Rest. The O2pulse relative increase from AT to peak exercise was calculated as: (O2pulse at Peak - O2pulse at AT) / O2pulse at AT. This calculation represents the fractional increase of O2pulse relative to its value at the beginning of each exercise phase, providing a normalized measure of its growth pattern.
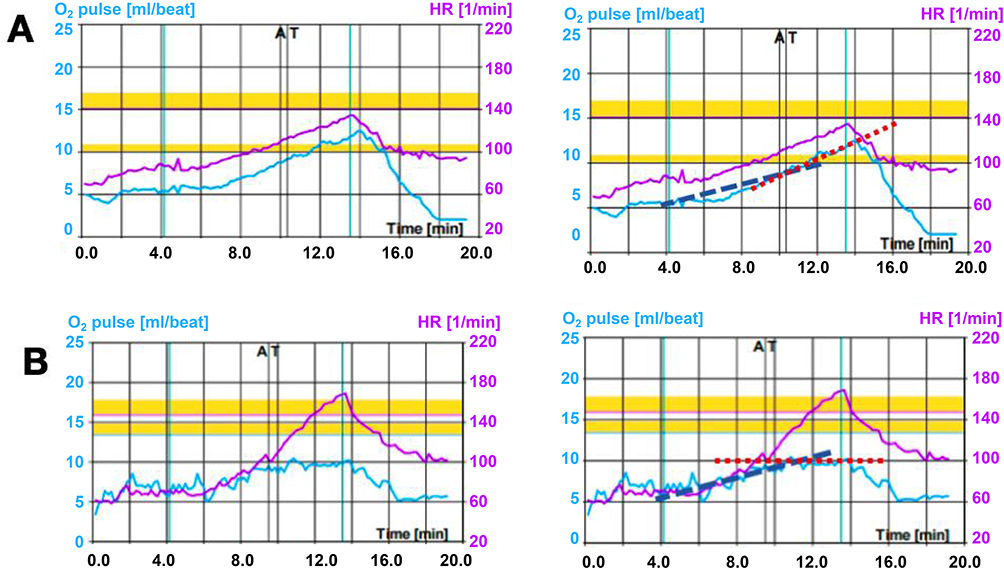 |
Figure 2 Pulse slope illustration. Notes: Red dashed line indicates heart rate (HR); blue dashed line indicates oxygen pulse (O2 pulse); (A) Normal oxygen pulse slope; (B) Early platform of oxygen pulse. |
Statistical Analysis
Statistical analysis was performed using SPSS 20.0 software. For continuous variables, the Shapiro–Wilk test for normality was used. Quantitative variables conforming to a normal distribution were expressed as x ± s, and independent samples t-tests were used for comparisons between two groups. Quantitative variables not conforming to a normal distribution were expressed as M (inter quartiles), and Mann–Whitney U-tests were used for comparisons between two groups. Categorical variables were expressed as counts (%), and Fisher’s exact test (χ2-test) was used for comparisons. Binary logistic regression was used to analyze the risk factors for the peak proportion of O2pulse, and multivariate linear regression was employed to screen the risk factors for the relative increase of O2pulse, and to calculate OR and 95% CI. For binary logistic regression, univariate analysis was first performed, and variables with P < 0.10 in univariate analysis were entered into the multivariate model using the enter method. For multiple linear regression, all clinically relevant variables were simultaneously entered into the model using the enter method. The distribution of the dependent variable was tested for normality using the Shapiro–Wilk test. If significant deviation from normality was detected, logarithmic transformation or a generalized linear model with appropriate distribution family would be considered. Collinearity was assessed using variance inflation factors (VIF), and variables with VIF > 5 were not included simultaneously in the same model. The significance level α was set at 0.05, and P < 0.05 was considered statistically significant. Post‑hoc power analysis was performed using GPower software (version 3.1). Assuming a medium effect size (f2 = 0.15 for linear regression models, and an odds ratio of 1.5 for logistic regression models), a sample size of 262, a two‑sided α of 0.05, and the number of predictors as in the final models (ranging from 4 to 6), the achieved power exceeded 0.90 for all regression analyses. This indicates that the study was adequately powered to detect clinically meaningful effect sizes.
Results
Baseline Clinical Characteristics
The O2pulse trajectory throughout exercise, normalized to peak workload, is illustrated. The Reduced O2pulse group demonstrated a flatter rise and lower peak value compared to the Normal group. Notably, the AT occurred earlier relative to peak workload in the Reduced group (Figure 3). The baseline characteristics of the 262 enrolled patients with EBPR are summarized in Table 1. Compared to the Normal O2pulse group, the Reduced O2pulse group was characterized by a higher proportion of males, a younger median age, a higher BMI, and a greater prevalence of smoking, Cr (Creatinine) and UA (Uric Acid) levels are higher, while HDL-C (High-Density Lipoprotein Cholesterol) level is lower (P < 0.05). It is noteworthy that 90 patients (34.35%) demonstrated an EBPR without a prior hypertension history. No significant intergroup differences were found in alcohol consumption, physical activity levels, or the prevalence of diabetes and coronary artery disease.
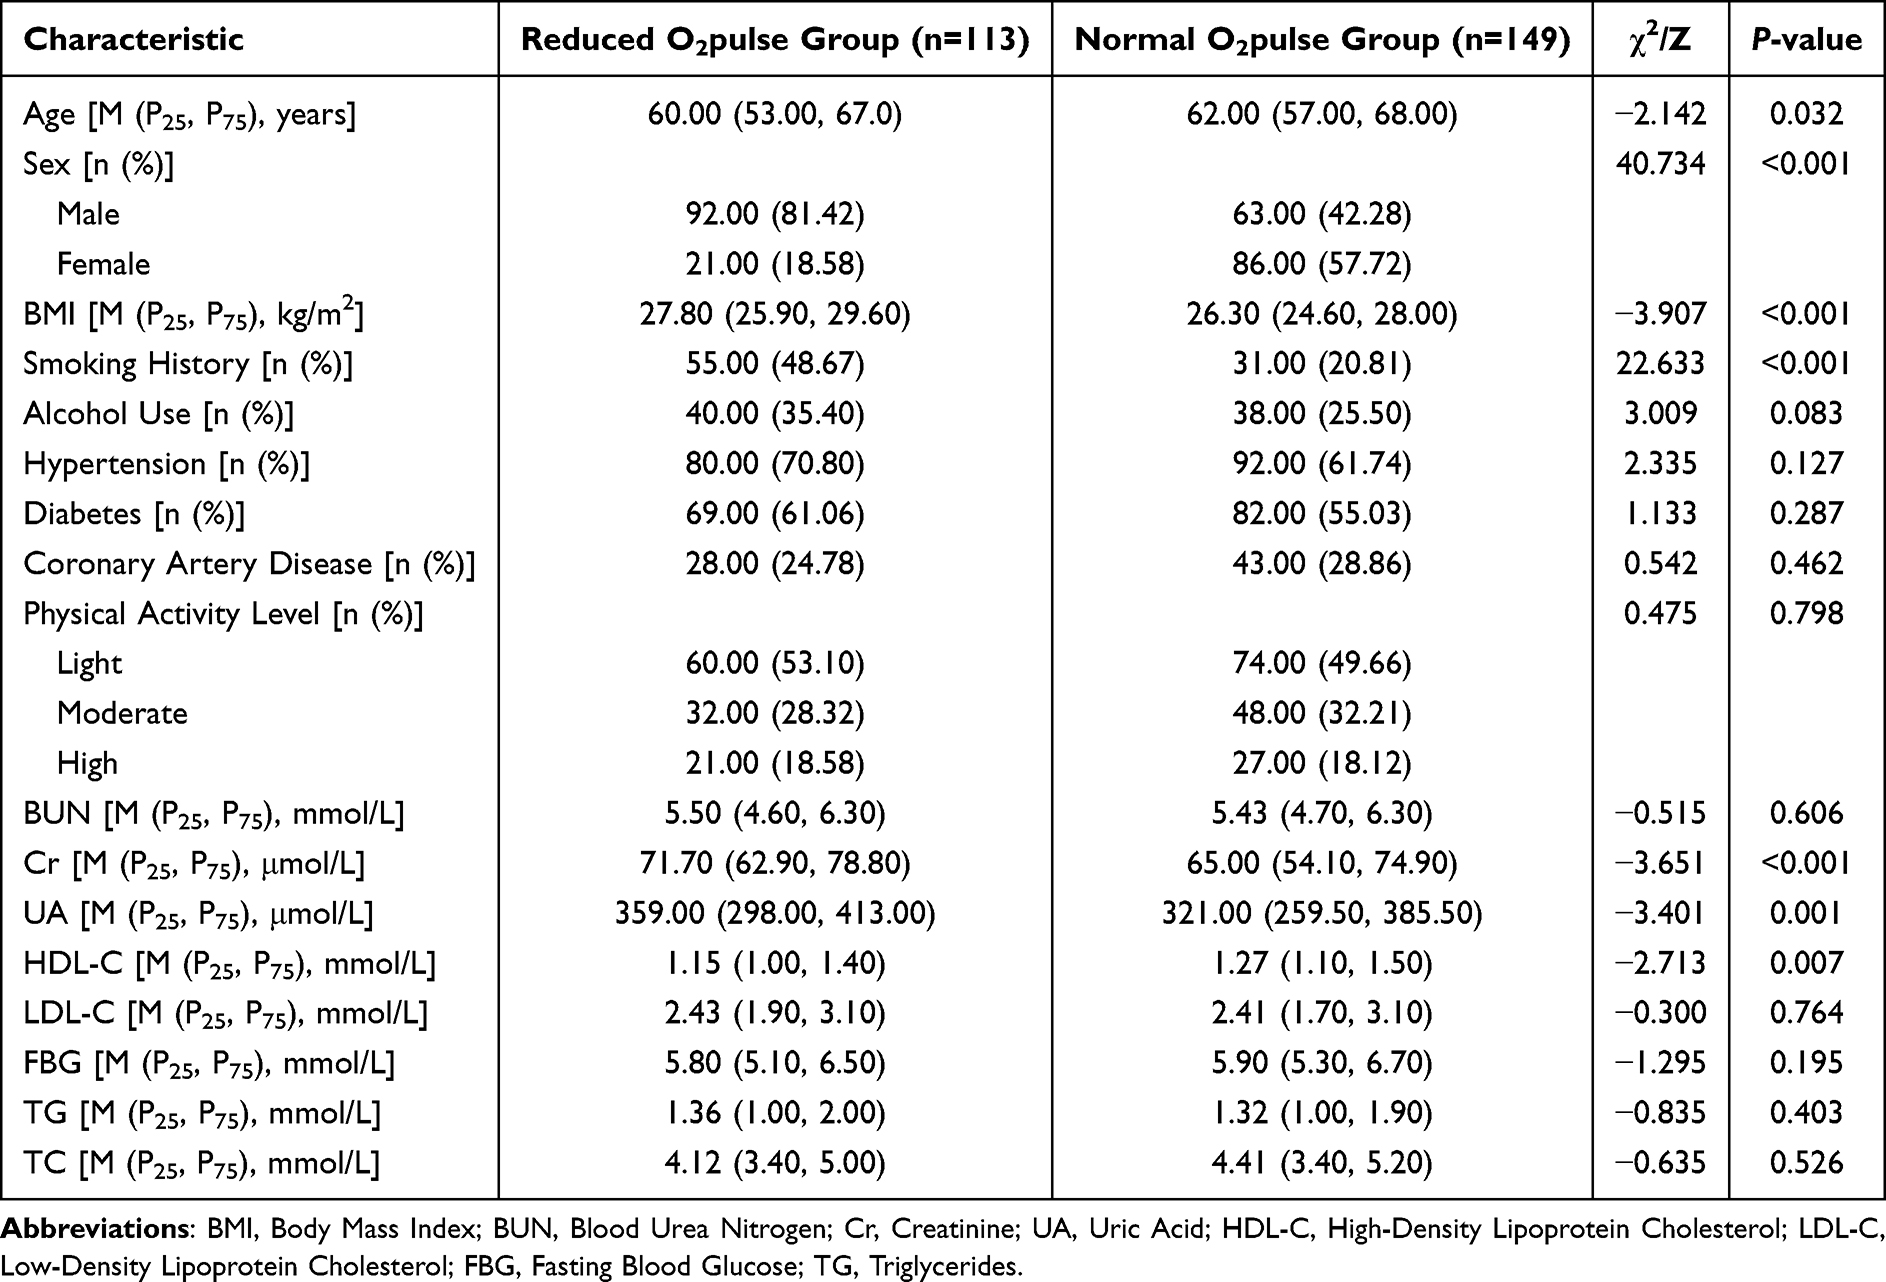 |
Table 1 Baseline Characteristics and Laboratory Inspection Indicators |
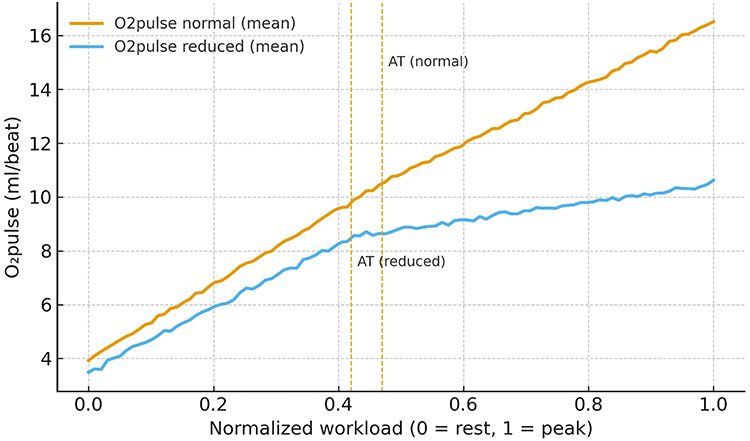 |
Figure 3 Exercise O2pulse Trajectories Stratified by Peak Function. |
CPET Parameters
Comprehensive CPET parameters are detailed in Table 2. The analysis delineated a clear profile for the Reduced O2pulse group, which was characterized by a consistent pattern of diminished cardiopulmonary functional reserve. This was evidenced by significantly lower values across all major aerobic capacity metrics, including VO2 at AT, peak VO2 (% predicted), peak METs, and peak WR (% predicted) (P < 0.05). Concurrently, this group exhibited a maladaptive hemodynamic profile, featuring an EBPR per metabolic equivalent (ΔSBP/MET and ΔDBP/MET) and higher HR both at the AT and at peak exercise (P < 0.05). To comprehensively present the study results, Figure 4 visually illustrates the trends of HR, SBP, and DBP at various time points. The results demonstrated that HR, SBP, and DBP in both groups exhibited an upward trajectory with increasing exercise workload. Specifically, no significant differences were observed in SBP between the two groups at any time point. For HR, no between-group difference was noted at rest; however, at the AT and peak exercise, HR was significantly higher in the Reduced O2pulse Group than in the Normal O2pulse Group (both P < 0.05). Regarding DBP, the Reduced O2pulse Group showed significantly higher values at rest and peak exercise compared with the Normal O2pulse Group (both P < 0.05).
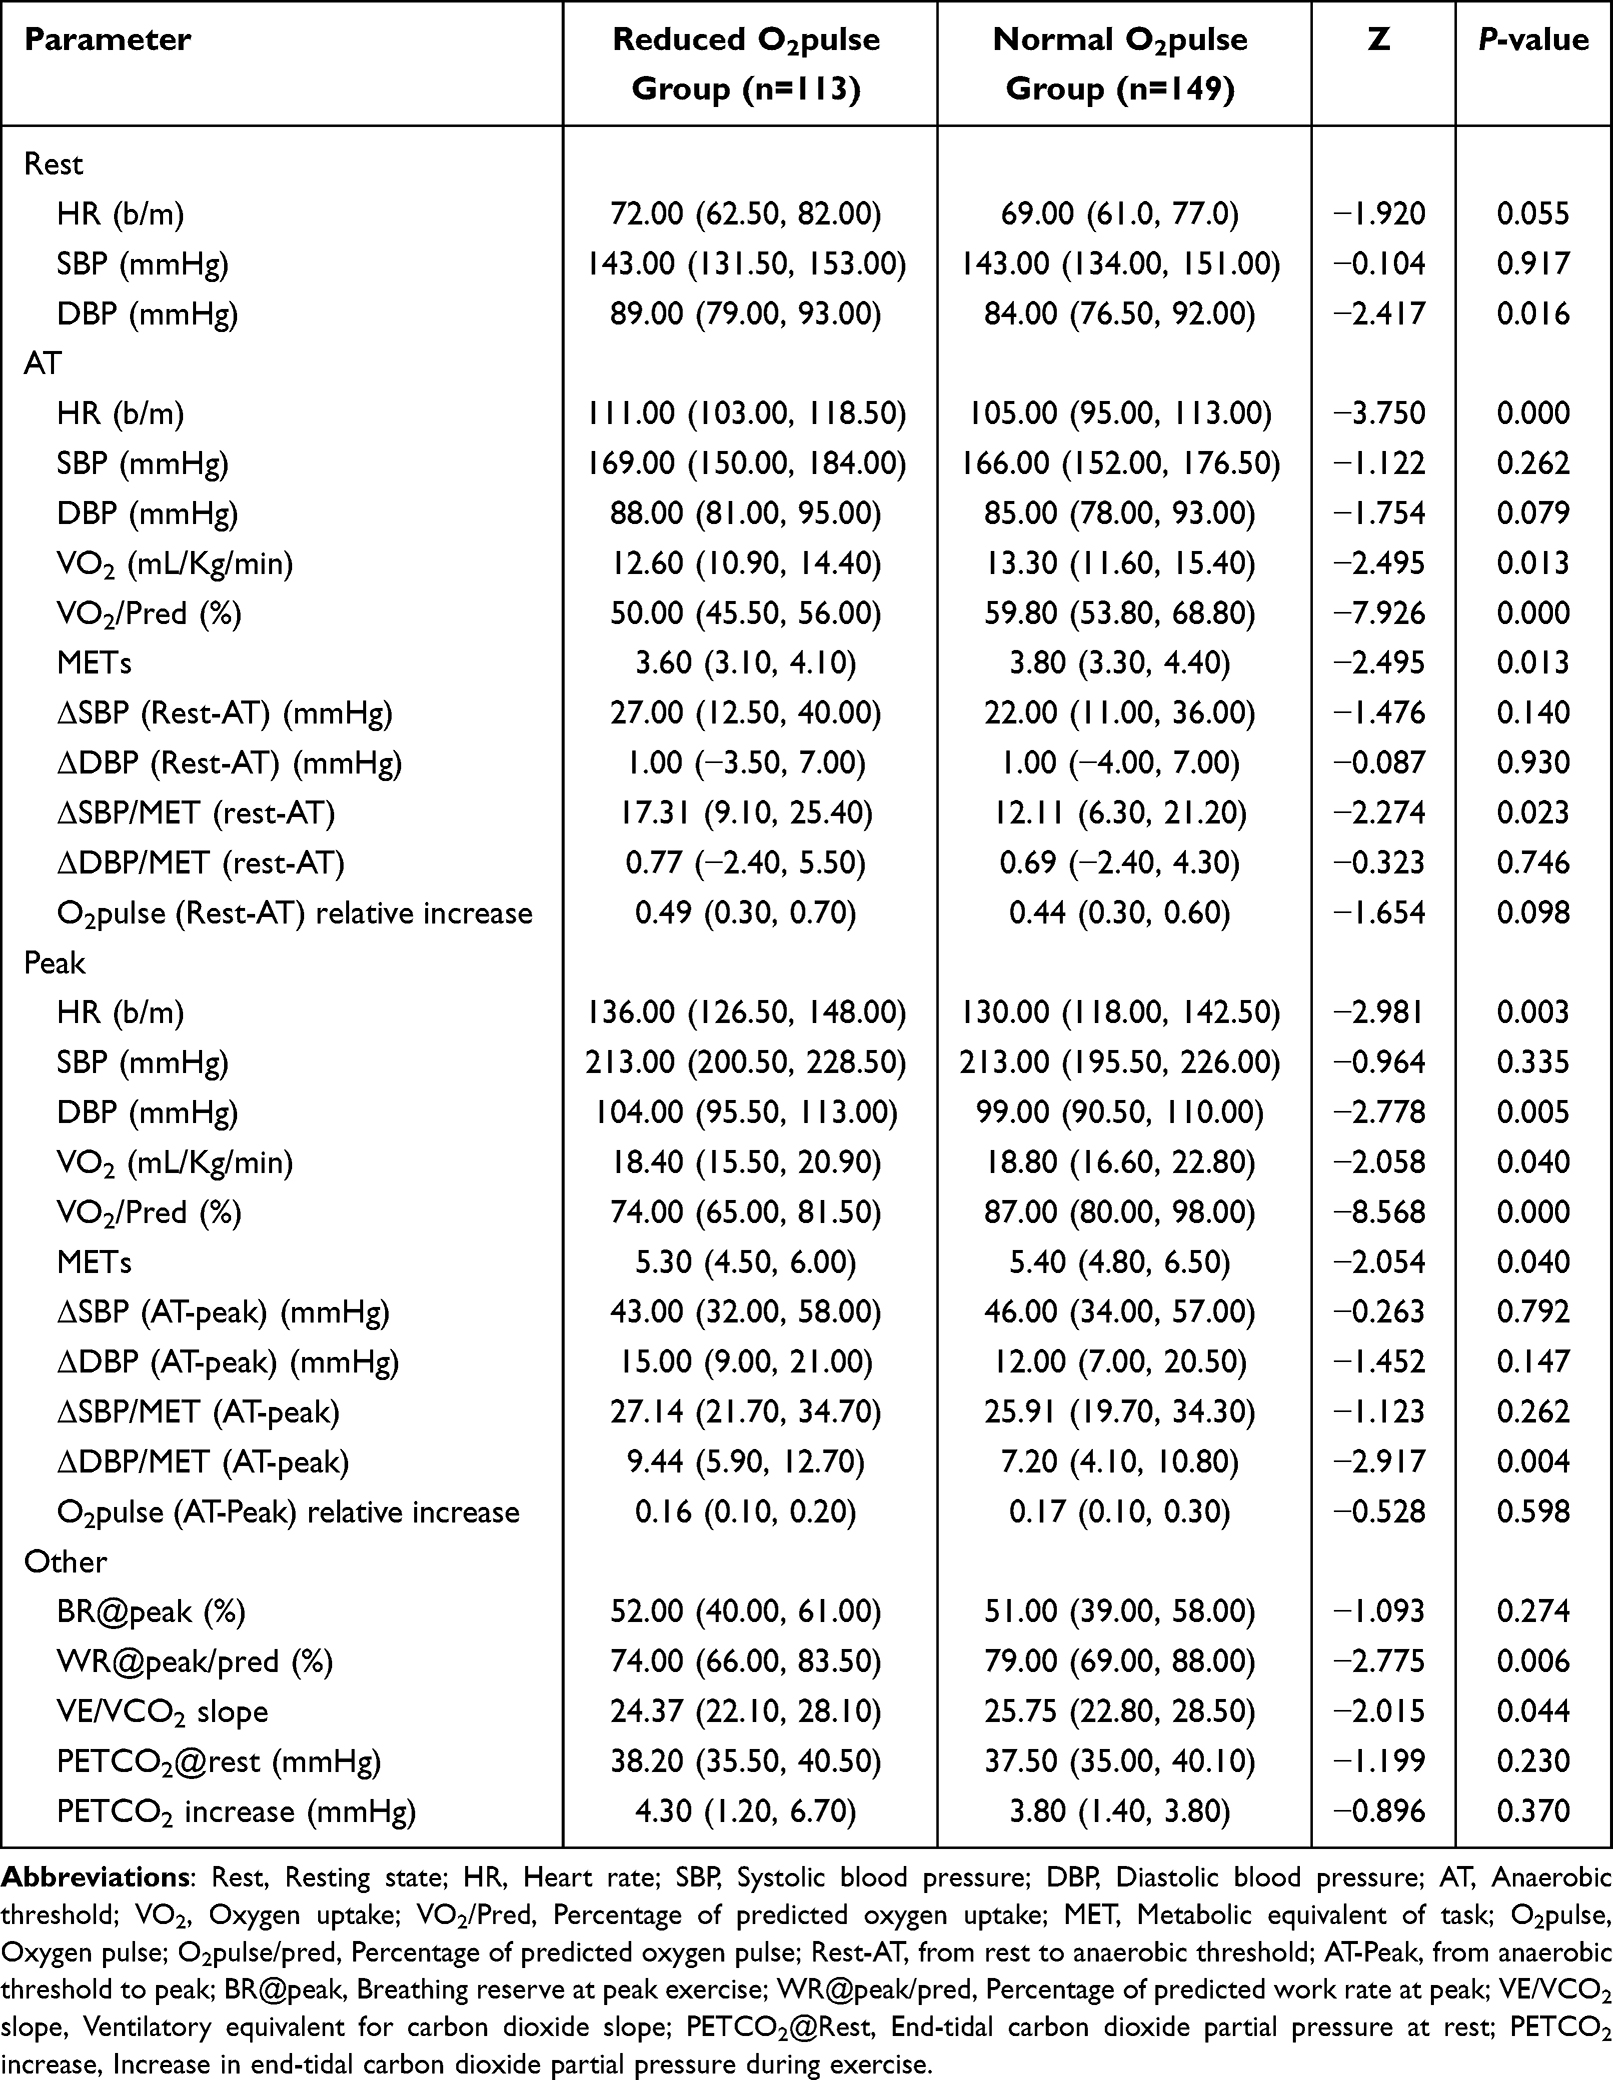 |
Table 2 Comparison of CPET Parameters |
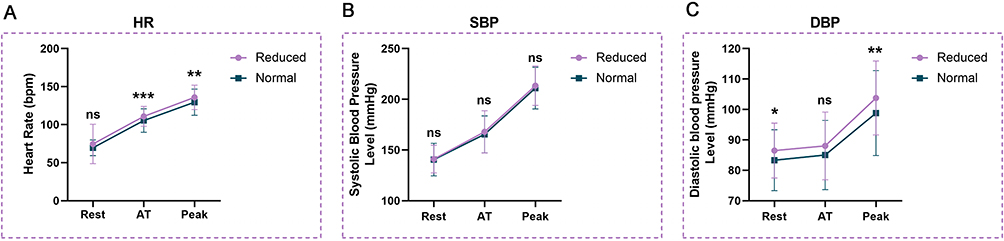 |
Figure 4 The changing trends of heart rate, systolic blood pressure and diastolic blood pressure of the two groups of patients at each time period. Abbreviations: ns, not significant; Rest, Resting state; AT, Anaerobic threshold; Peak, Peak value. Notes:, * (P<0.05), ** (P<0.01), *** (P<0.001); (A) Heart rate; (B) Systolic blood pressure; (C) Diastolic blood pressure. |
Echocardiogram Comparison Results
The results showed that compared with the normal group, the LA (Left Atrial diameter), LVEDD (Left Ventricular End-Diastolic Diameter), EDV (Left Ventricular End-Diastolic Diameter), and LVSD (Left Ventricular End-Systolic Diameter) in the O2pulse reduction group were all significantly increased (all P < 0.05). However, there was no statistically significant difference in left ventricular EF (Ejection Fraction) between the two groups (P > 0.05) (Figure 5).
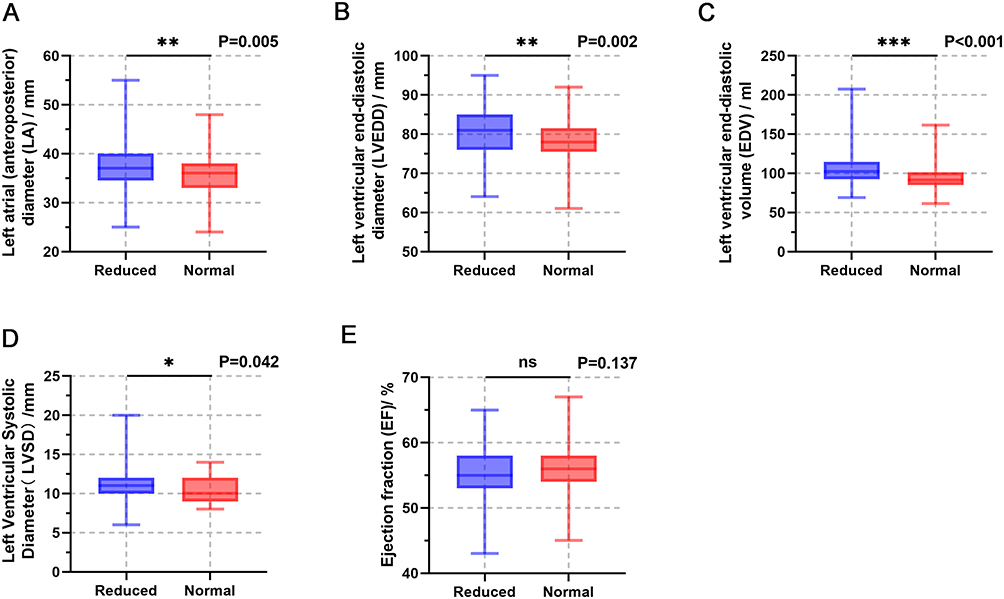 |
Figure 5 Comparison results of echocardiograms between the two groups of patients. Abbreviation: ns, not significant. Notes: * (P<0.05), ** (P<0.01), *** (P<0.001); (A) Left Atrial diameter; (B) Left Ventricular End-Diastolic Diameter; (C) Left Ventricular End-Diastolic Volume; (D) Left Ventricular End-Systolic Diameter; (E) Ejection Fraction. |
Factors Influencing O2pulse Ratio
The key independent risk factor for reduced peak O2pulse was advanced age, while female sex was protective. Using the presence of a reduced O2pulse ratio as the dependent variable, demographic variables, resting blood pressure, peak blood pressure, and exercise-induced blood pressure increase were sequentially entered into the regression model. The results showed that advanced age was an independent risk factor for reduced peak O2pulse (OR: 1.064, 95% CI: 1.016–1.114, P=0.008). Compared with males, female sex was a protective factor against reduced peak O2pulse (OR: 0.038, 95% CI: 0.013–0.086, P<0.001). Individuals with a history of alcohol consumption had a significantly higher risk of reduced peak O2pulse (OR: 1.766, 95% CI: 1.087–2.584, P=0.002). A greater increase in SBP from rest to peak (ΔSBPRest–Peak) was associated with an increased risk of reduced peak O2pulse (OR: 1.029, 95% CI: 1.011–1.048, P=0.002). Conversely, a greater MET-adjusted increase in SBP (ΔSBP/METRest–Peak) was associated with a lower risk of reduced peak O2pulse (OR: 0.842, 95% CI: 0.794–0.893, P<0.001). In addition, a higher peak DBP@Peak level was associated with a lower risk of reduced peak O2pulse (OR: 0.960, 95% CI: 0.933–0.987, P=0.004). In the logistic regression model, the VIF for all independent variables ranged from 1.053 to 1.538, all below the conventional threshold of 5, indicating no significant multicollinearity. Detailed results are presented in Table 3.
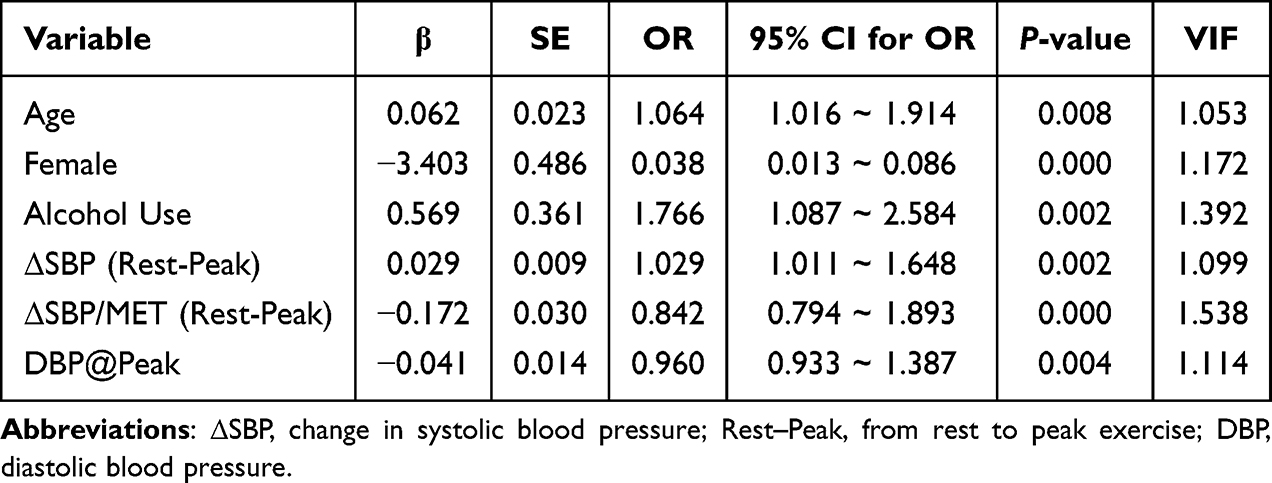 |
Table 3 Logistic Regression Analysis of Factors Influencing Peak O2pulse Percentage |
Factors Influencing the Relative Increase in O2pulse
Because the relative increase in O2pulse showed a skewed distribution, logarithmic transformation was applied before performing linear regression analysis. The core finding was that ΔSBP/MET was negatively correlated with the relative increase in O2pulse both before and after AT, whereas unadjusted ΔSBP showed a positive correlation. The analysis revealed that both before and after the AT, the unadjusted increase in SBP (ΔSBP) was significantly positively correlated with the O2pulse relative increase (pre-AT: β=0.005, 95% CI: 0.003–0.007, P<0.001; post-AT: β=0.004, 95% CI: 0.003–0.005, P<0.001). However, the MET-adjusted increase in SBP (ΔSBP/MET) was significantly negatively correlated with the O2pulse relative increase (pre-AT: β=−0.007, 95% CI: −0.009 to −0.005, P<0.001; post-AT: β=−0.004, 95% CI: −0.006 to −0.002, P<0.001). The increase in DBP, both unadjusted and MET-adjusted, showed no consistent effect on the O2pulse relative increase before or after the AT. In the linear regression models, the VIF for all independent variables ranged from 1.078 to 2.310, all below the threshold of 5, suggesting no significant multicollinearity. Detailed data are provided in Table 4 and Table 5. To assess the potential confounding effects of age and sex, we performed a sensitivity analysis by additionally including age and sex as covariates in the linear regression models. The results showed that the negative association between ΔSBP/MET and the relative increase in O2pulse remained significant both before and after the AT. After adjustment, the β value was −0.006 (95% CI: −0.008 to −0.004, P < 0.001) for the rest‑to‑AT phase, and −0.004 (95% CI: −0.006 to −0.002, P < 0.001) for the AT‑to‑peak phase. Based on these tabulated data, scatter plots were constructed to visualize the relationship between changes in SBP and the O2pulse relative increase during different exercise phases (Figure 6).
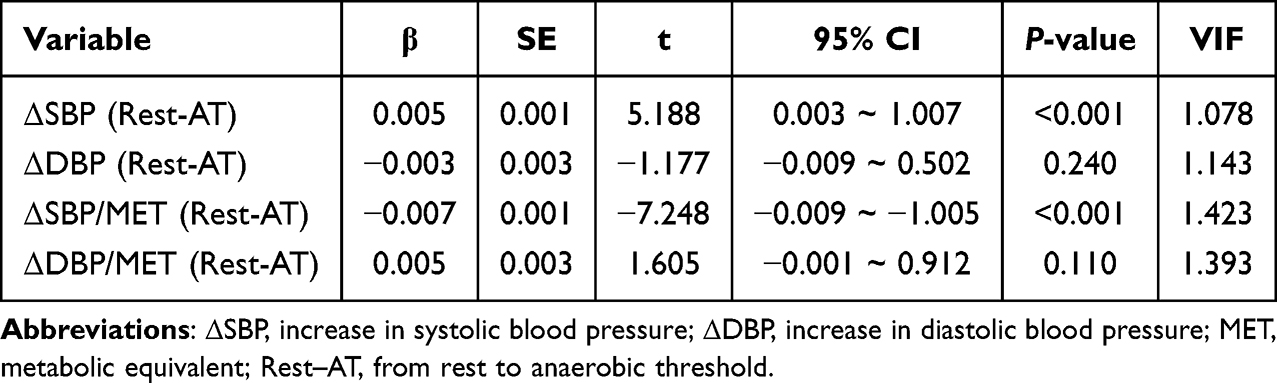 |
Table 4 Impact of Blood Pressure Increase on O2pulse Relative Increase Before AT |
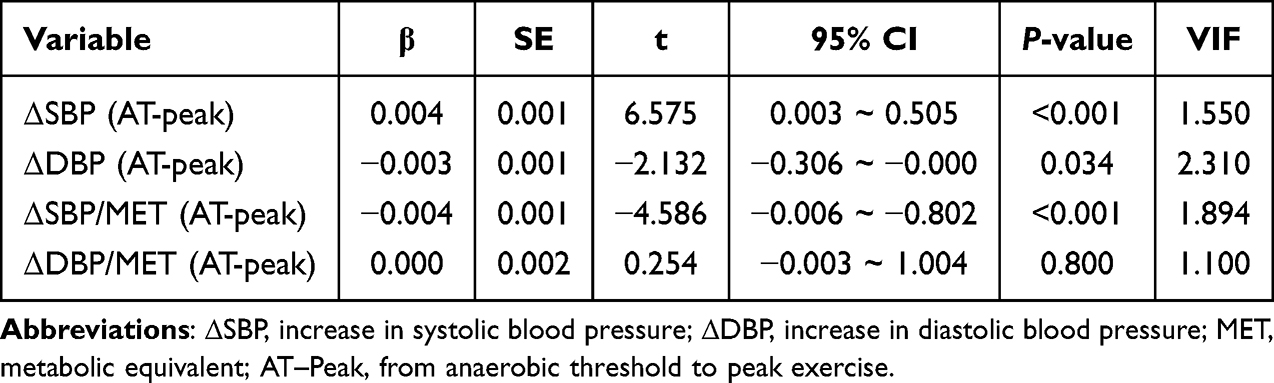 |
Table 5 Impact of Blood Pressure Increase on O2pulse Relative Increase After AT |
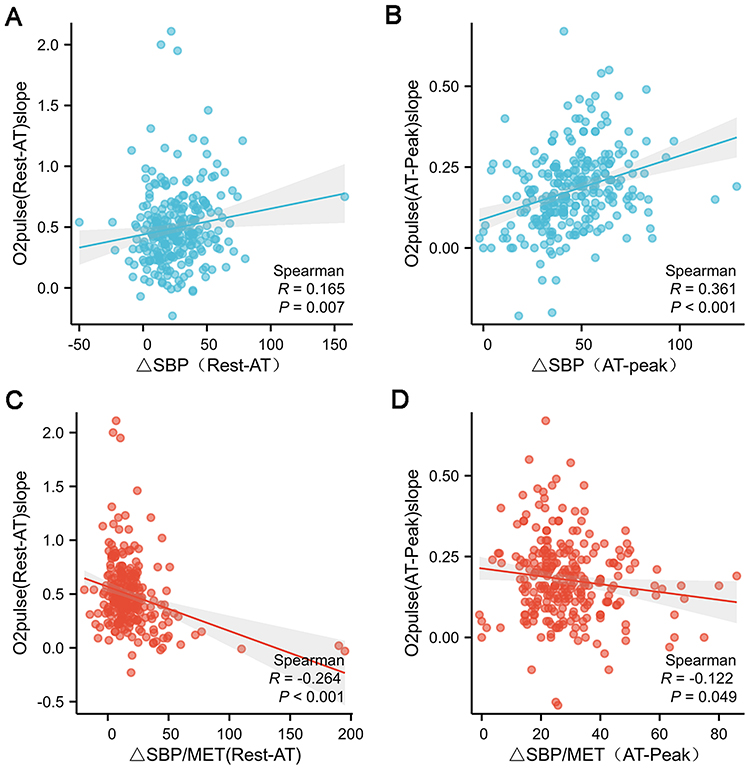 |
Figure 6 Correlation between systolic blood pressure changes and oxygen pulse relative increase across different exercise stages. Abbreviations: Rest, Resting state; SBP, Systolic blood pressure; AT, Anaerobic threshold; MET, Metabolic equivalent of task. Notes: (A) Relationship between the increase in systolic blood pressure from rest to anaerobic threshold (Rest-AT) and the oxygen pulse relative increase; (B) Relationship between the increase in systolic blood pressure from anaerobic threshold to peak exercise (AT-peak) and the oxygen pulse relative increase; (C) Ratio of pre-anaerobic threshold systolic blood pressure increase to MET; (D) Ratio of post-anaerobic threshold systolic blood pressure increase to MET. |
Discussion
Although previous studies have largely attributed the pathophysiological mechanisms of an EBPR to sympathetic overactivation, inadequate reduction in peripheral vascular resistance, or vascular endothelial dysfunction,13,20 the intrinsic relationship between EBPR and cardiac work efficiency has not been systematically elucidated.14 To study this part, the present study introduced METs to standardize the increase in blood pressure during exercise testing, aiming to systematically evaluate the association between blood pressure response patterns and O2pulse from the perspective of cardiac pumping efficiency. The core finding of this study is that ΔSBP/MET is significantly negatively correlated with both the relative increase and the peak value of O2pulse. This result suggests that when the magnitude of the blood pressure rise exceeds the appropriate range corresponding to the body’s current metabolic demand, the excessive hemodynamic response often comes at the cost of compromised cardiac pumping efficiency.21,22 In contrast, the unadjusted ΔSBP is positively correlated with O2pulse levels. The opposite directions of the ORs for reduced O2pulse observed in regression analyses are not a statistical contradiction but rather reflect distinct pathophysiological meanings: the unadjusted ΔSBP mainly increases with exercise workload, and its elevation may be matched by higher metabolic demand and compensatory cardiac output, thus showing a positive association with O2pulse in cross‑sectional data.14 In contrast, ΔSBP/MET, by removing the interference of metabolic demand, more precisely captures the cardiovascular dysregulation implied by “an excessive blood pressure rise per unit metabolic load”. Therefore, the true masked cardiovascular risk does not originate from the simple elevation of blood pressure values, but rather from the decreased cardiac work efficiency that becomes evident after metabolic standardization.14,23
Echocardiography showed that in EBPR patients with reduced O2pulse, although resting LVEF remained normal, left atrial diameter, left ventricular end‑diastolic diameter, and left ventricular end‑diastolic volume were significantly increased. This suggests that a chronically “high energy consumption, low efficiency” loading state may have triggered compensatory structural remodeling; such subclinical changes may represent an anatomical basis for future adverse outcomes such as heart failure.24–26 Laboratory findings also revealed that this patient group concurrently exhibited elevated serum uric acid levels and decreased HDL‑C levels. Elevated uric acid is not only a marker of endothelial dysfunction but may also directly interfere with myocardial energy metabolism, while decreased HDL‑C compromises cardiovascular protective mechanisms.27,28 Together, these factors constitute a metabolic microenvironment associated with reduced O2pulse efficiency, further indicating that EBPR may be a systemic risk network involving structural, functional, and metabolic dimensions.
Furthermore, 34.35% of EBPR patients in this study had completely normal resting blood pressure, a proportion significantly higher than previously reported in the literature.29 This finding suggests that reliance solely on office resting blood pressure monitoring is prone to miss many cases of masked exercise‑induced hypertension. These individuals appear healthy under resting conditions but reveal hemodynamic dysregulation under stress. Therefore, clinical assessment paradigms need to be extended from static to dynamic conditions, and from focusing merely on blood pressure values to an in‑depth evaluation of cardiac work efficiency, in order to achieve earlier risk identification. Another noteworthy paradox is that univariate analysis showed a younger median age in the reduced O2pulse group, yet multivariate logistic regression identified advanced age as an independent risk factor (OR = 1.064). This phenomenon may be explained by the compositional characteristics of the reduced O2pulse group: this group had a higher proportion of males and a higher BMI, both of which are positively associated with higher absolute O2pulse values. In the univariate comparison, the “positive” effects of these factors masked the true effect of age, resulting in a reduced O2pulse despite a younger age in this group. After adjusting for sex and BMI in the regression model, the true effect of age became apparent.
This study has several limitations. First, as a cross-sectional study, we can only reveal associations between blood pressure response patterns and O2pulse efficiency, but cannot establish causality. Whether the EBPR during exercise is a cause, a consequence, or both of decreased cardiac pump efficiency requires further validation through longitudinal follow-up or interventional studies. Second, the enrolled population exhibited a relatively wide age range, although the majority of patients were distributed between 46 and 74 years. Age remains a strong determinant of blood pressure, cardiac function, and arterial stiffness; therefore, further studies should refine the influence of age stratification on blood pressure and cardiopulmonary parameters. Third, detailed statistical analysis of medication regimens—particularly antihypertensive agents, statins, and beta-blockers—was not performed for all patients in the cohort, precluding precise identification of drug-related effects on O2pulse changes. Moreover, this was a single‑center study, which may introduce selection bias and limit generalizability. The lack of systematic medication records further compounds this limitation, as we could not adjust for potential confounding by these drugs. Fourth, We only used a simplified relative increase metric and did not analyze plateau or inflection points of the O2pulse curve. Future studies employing more detailed morphological analysis may provide additional insights. Fifth, O2pulse is an indirect surrogate for stroke volume and may be influenced by factors other than cardiac function. Although we excluded patients with severe anemia or metabolic abnormalities, this inherent limitation should be acknowledged.
Conclusion
In summary, by revealing the intrinsic association between an excessive rise in systolic blood pressure per unit metabolic load and a decrease in O2pulse efficiency, this study suggests that the hemodynamic essence of EBPR may be a “high energy consumption, low efficiency” cardiovascular response pattern. By focusing on ΔSBP/MET, it may be possible to use ΔSBP/MET to differentiate, from among individuals with seemingly ordinary blood pressure elevation, those whose hearts are already in a compensatory state of “high workload, low efficiency”. This finding offers a potential physiological perspective for understanding the masked threats of exertional hypertension, and provides potential considerations for subsequent risk stratification and optimization of intervention strategies.
Ethics Statement
This study was approved by the Ethics Committee of RiZhao International Heart Hospital (Approval No. rzxzbyyll2021003) and was conducted in accordance with the Declaration of Helsinki. All participants provided written informed consent prior to undergoing cardiopulmonary exercise testing.
Author Contributions
All authors made a significant contribution to the work reported, whether that is in the conception, study design, execution, acquisition of data, analysis and interpretation, or in all these areas; took part in drafting, revising or critically reviewing the article; gave final approval of the version to be published; have agreed on the journal to which the article has been submitted; and agree to be accountable for all aspects of the work.
Funding
Key Research and Development Program of Rizhao City (20212DYF020222).
Disclosure
The research was carried out without any financial or commercial ties that might be seen as a potential conflict of interest, according to the authors.
References
1. Keller K, Hartung K, Del Castillo Carillo L, et al. Exercise hypertension in athletes. J Clin Med. 2022;11(16):4870. doi:10.3390/jcm11164870
2. Petrasch G, Brito DSH, Heller V, et al. Definitions for hypertensive response to exercise: a systematic review. Minerva Med. 2025;116(5):416–13. doi:10.23736/S0026-4806.25.09678-8
3. Cuspidi C, Tadic M. Cardiovascular risk stratification: how important is the hypertensive response to exercise? J Hypertens. 2022;40(1):27–29. doi:10.1097/HJH.0000000000003015
4. Bouzas-Mosquera MC, Bouzas-Mosquera A, Peteiro J. Excessive blood pressure increase with exercise and risk of all-cause mortality and cardiac events. Eur J Clin Invest. 2016;46(10):833–839. doi:10.1111/eci.12665
5. Laveneziana P, Di Paolo M, Palange P. The clinical value of cardiopulmonary exercise testing in the modern era. Eur Respir Rev. 2021;30(159):200187. doi:10.1183/16000617.0187-2020
6. Mazaheri R, Schmied C, Niederseer D, Guazzi M. Cardiopulmonary exercise test parameters in athletic population: a review. J Clin Med. 2021;10(21):5073. doi:10.3390/jcm10215073
7. Arena R, Myers J, Harber M, et al. Peak oxygen pulse responses during maximal cardiopulmonary exercise testing: reference standards from FRIEND (Fitness Registry and the Importance of Exercise: an International Database). Int J Cardiol. 2020;301:180–182. doi:10.1016/j.ijcard.2019.11.106
8. Milani M, Bekhuis Y, Falter M, et al. Oxygen pulse during cardiopulmonary exercise testing in cardiac patients as a surrogate of stroke volume: fact or fiction? Eur Heart J Cardiovasc Imaging. 2025;26(Supplement_1):
9. Huang S, Wang L, Li J, et al. Oxygen pulse variation in symptomatic patients with suspected coronary artery disease: a diagnostic analysis. Ann Transl Med. 2022;10(22):1225. doi:10.21037/atm-22-5279
10. Geng L, Huang S, Zhang T, et al. The association between O(2)-pulse slope ratio and functional severity of coronary stenosis: a combined cardiopulmonary exercise testing and quantitative flow ratio study. Int J Cardiol Heart Vasc. 2024;52:101409. doi:10.1016/j.ijcha.2024.101409
11. Nickolay T, McGregor G, Powell R, et al. Inter- and intra-observer reliability and agreement of O2Pulse inflection during cardiopulmonary exercise testing: a comparison of subjective and novel objective methodology. PLoS One. 2024;19(3):e0299486. doi:10.1371/journal.pone.0299486
12. Mert KU, Şener E, Yılmaz AS, et al. The association of exaggerated hypertensive response to exercise and beta-blockers use in hypertensives. Clin Exp Hypertens. 2020;42(8):707–713. doi:10.1080/10641963.2020.1779284
13. Schultz MG, Otahal P, Cleland VJ, et al. Exercise-induced hypertension, cardiovascular events, and mortality in patients undergoing exercise stress testing: a systematic review and meta-analysis. Am J Hypertens. 2013;26(3):357–366. doi:10.1093/ajh/hps053
14. Nayor M, Gajjar P, Murthy VL, et al. Blood pressure responses during exercise: physiological correlates and clinical implications. Arterioscler Thromb Vasc Biol. 2023;43(1):163–173. doi:10.1161/ATVBAHA.122.318512
15. Lafeta ML, Souza VC, Menezes TCF, et al. Cardiopulmonary exercise test 3 to 12 months after COVID-19 hospitalization. Eur Respir J. 2024;64(suppl 68):PA5267.
16. Ruigrok D, Handoko ML, Meijboom LJ, et al. Noninvasive follow-up strategy after pulmonary endarterectomy for chronic thromboembolic pulmonary hypertension. ERJ Open Res. 2022;8(2):00564–2021. doi:10.1183/23120541.00564-2021
17. Albouaini K, Egred M, Alahmar A, Wright DJ. Cardiopulmonary exercise testing and its application. Postgrad Med J. 2007;83(985):675–682. doi:10.1136/hrt.2007.121558
18. Ali ZA, Horst J, Gaba P, et al. Standardizing the definition and analysis methodology for complete coronary artery revascularization. J Am Heart Assoc. 2021;10(9):e020110. doi:10.1161/JAHA.120.020110
19. Glaab T, Taube C. Practical guide to cardiopulmonary exercise testing in adults. Respir Res. 2022;23(1):9. doi:10.1186/s12931-021-01895-6
20. Kader AWM. Is an exaggerated blood pressure response to exercise in hypertensive patients a benign phenomenon or a dangerous alarm? Eur J Prev Cardiol. 2016;23(6):572–576. doi:10.1177/2047487315583136
21. Zhu ZM, Wu H. [Metabolism-related hypertension: a driving force for cardiometabolic diseases]. Zhonghua Xin Xue Guan Bing Za Zhi. 2023;51(12):1228–1233. Chinese. doi:10.3760/cma.j.cn112148-20231007-00213
22. Silva Ruiz C, Sharman JE, Otahal P, et al. P135 fitness influences the relationship between exercise blood pressure and left ventricular structure: evidence from the exercise stress test collaboration (exertion) study. J Hypertens. 2024;42(Suppl 3).
23. Most A, Kraushaar L, Dörr O, et al. Association of central blood pressure with an exaggerated blood pressure response to exercise among elite athletes. Eur J Appl Physiol. 2024;124(4):1239–1252. doi:10.1007/s00421-023-05353-7
24. Egbe AC, Miranda WR, Jain CC, Borlaug BA, Connolly HM. Prognostic implications of exercise-induced hypertension in adults with repaired coarctation of aorta. Hypertension. 2022;79(12):2796–2805. doi:10.1161/HYPERTENSIONAHA.122.19735
25. Choi YJ, Kim SH, Kang SH, et al. Reconsidering the cut-off diastolic blood pressure for predicting cardiovascular events: a nationwide population-based study from Korea. Eur Heart J. 2019;40(9):724–731. doi:10.1093/eurheartj/ehy801
26. Moore MN, Climie RE, Otahal P, Sharman JE, Schultz MG. Exercise blood pressure and cardiac structure: a systematic review and meta-analysis of cross-sectional studies. J Sci Med Sport. 2021;24(9):925–930. doi:10.1016/j.jsams.2021.02.014
27. Borghi C, Fogacci F, Cicero AF. Crystal clear - Part II: the role of uric acid in cardiorenal disease. Eur J Intern Med. 2025;142:106554. doi:10.1016/j.ejim.2025.106554
28. Linton MF, Yancey PG, Tao H, Davies SS. HDL function and atherosclerosis: reactive dicarbonyls as promising targets of therapy. Circ Res. 2023;132(11):1521–1545. doi:10.1161/CIRCRESAHA.123.321563
29. Xavier T, Brisson C, Gilbert-Ouimet M, et al. Masked hypertension incidence: risk factors in a prospective cohort study. J Hypertens. 2018;36:e2. doi:10.1097/01.hjh.0000538967.58643.f6
 © 2026 The Author(s). This work is published and licensed by Dove Medical Press Limited. The
full terms of this license are available at https://www.dovepress.com/terms
and incorporate the Creative Commons Attribution
- Non Commercial (unported, 4.0) License.
By accessing the work you hereby accept the Terms. Non-commercial uses of the work are permitted
without any further permission from Dove Medical Press Limited, provided the work is properly
attributed. For permission for commercial use of this work, please see paragraphs 4.2 and 5 of our Terms.
© 2026 The Author(s). This work is published and licensed by Dove Medical Press Limited. The
full terms of this license are available at https://www.dovepress.com/terms
and incorporate the Creative Commons Attribution
- Non Commercial (unported, 4.0) License.
By accessing the work you hereby accept the Terms. Non-commercial uses of the work are permitted
without any further permission from Dove Medical Press Limited, provided the work is properly
attributed. For permission for commercial use of this work, please see paragraphs 4.2 and 5 of our Terms.