")
Back to Journals » Clinical Ophthalmology » Volume 17
Association of Triglyceride Glucose Index with Prevalence and Incidence of Diabetic Retinopathy in a Singaporean Population
Authors Neelam K, Aung KCY, Ang K, Tavintharan S, Sum CF, Lim SC
Received 25 July 2022
Accepted for publication 2 November 2022
Published 2 February 2023 Volume 2023:17 Pages 445—454
DOI https://doi.org/10.2147/OPTH.S382336
Checked for plagiarism Yes
Review by Single anonymous peer review
Peer reviewer comments 2
Editor who approved publication: Dr Scott Fraser
Kumari Neelam,1,2,* Khin Chaw Yu Aung,3,* Keven Ang,3 Subramaniam Tavintharan,3,4 Chee Fang Sum,4 Su Chi Lim3– 6
1Department of Ophthalmology and Visual Sciences, Khoo Teck Puat Hospital, Singapore; 2Singapore Eye Research Institute, Singapore; 3Clinical Research Unit, Khoo Teck Puat Hospital, Singapore; 4Diabetes Centre, Admiralty Medical Centre, Singapore; 5Saw Swee Hock School of Public Health, National University of Singapore, Singapore; 6Lee Kong Chian School of Medicine, Nanyang Technological University, Singapore
*These authors contributed equally to this work
Correspondence: Su Chi Lim, Clinical Research Unit, Khoo Teck Puat Hospital, 90 Yishun Central, 728828, Singapore, Email [email protected]
Objective: To examine the association of triglyceride glucose (TyG) index (product of fasting triglyceride and glucose) with prevalence and incidence of diabetic retinopathy (DR) in type 2 diabetes.
Methods: 1339 patients from an ongoing Singapore Study of Macro-angiopathy and Micro-Vascular Reactivity in Type 2 Diabetes (SMART2D) were included in this study. Fasting triglyceride and glucose levels were quantified and color fundus photographs were assessed for DR presence and severity. Logistic regression models were used to evaluate associations of TyG index with DR prevalence and incidence (median follow-up period = 3.2 years).
Results: Mean TyG index was higher in patients with DR than no DR (9.24± 0.7 versus 9.04± 0.6, p< 0.001). TyG index was significantly associated with DR prevalence (OR=1.4, CI 1.1– 1.7, p=0.002) and incidence (OR=1.8, CI 1.04– 2.9, p=0.03), after adjusting for confounders. In a stratified analysis, the association between TyG index and DR prevalence reached significance only in the subgroup with HbA1c levels < 7.0% (OR=2, CI 1.1– 3.8, p=0.03). TyG index significantly predicted DR prevalence and incidence with area under receiver operating curve as 0.77 (CI 0.74– 0.80, p < 0.001) and 0.66 (CI 0.57– 0.76, p value < 0.01), respectively.
Conclusion: TyG index is a good predictor for DR prevalence and incidence. It can also be a secondary treatment target for patients with optimally controlled levels of HbA1c.
Keywords: triglyceride glucose index, diabetic retinopathy, insulin resistance, prevalence, incidence
Introduction
Diabetes is increasing in epidemic proportion, affecting an estimated 463 million adults worldwide.1 The increasing prevalence of diabetes places an ever-increasing burden on healthcare systems due to the disease and its complications. Diabetic retinopathy (DR) is the most specific microvascular complication of diabetes, with proliferative DR (PDR) and diabetic macular edema representing the vision-threatening form of DR. DR is the leading cause of vision loss and preventable blindness in working age adults (20–65 years).2 Globally approximately 35.4% of diabetic patients have DR, of which a third have vision-threatening DR.3 In Singapore, prevalence of DR and vision-threatening DR is higher (33.9%, 8.9%) than other Asian countries but comparable to that of Western populations.4
Currently, optimal glycaemic control is a mainstay in the prevention of DR. Insulin resistance (IR), described by decreased cell sensitivity to insulin, also plays a pivotal role in the development of type 2 diabetes and its associated vascular complications.5 Diabetic patients with IR have a characteristic dyslipidemia in the form of abnormally high levels of plasma triglycerides (TG) that interfere with glucose metabolism in muscles, fat and pancreatic cells.6 This is consistent with the hypothesis that TG elevation in serum and tissue is related to a decrease in insulin sensitivity. Moreover, it has been demonstrated that lowering TG, such as fibrates do, can significantly attenuate the process of developing IR, and often helped improve glycemic control.
IR can be measured using direct methods, such as hyper-insulinemic euglycemic clamp (gold standard),7 or using indirect methods involving formulas developed with fasting insulin levels in their calculations, such as homeostatic model assessment of IR (most widely used), Raynaud and reciprocal insulin.8 However, all these measurement methods are limited by high biological variability of insulin levels (intra and inter-subject variability), difficulty in fasting insulin measurements and non-standardized techniques for quantification. Moreover, these methods are invasive, expensive, and complicated and hence not suitable for clinical and epidemiological studies. Therefore, insulin-free surrogate for evaluating IR is being sought.
Guerrero et al showed that the product of TG and glucose, the so-called triglycerides and glucose index (TyG), could be a useful estimate of IR.9 Indeed, past studies have demonstrated that the TyG index has a predictive role in identifying patients with type 2 diabetes at elevated risk of developing future macro-vascular complications, particularly cardiovascular events. To date, three past studies evaluated the relationship between TyG index and DR prevalence; however, the findings from these studies are inconsistent.10–12 Moreover, there is no published data on TyG index and incidence of DR, and therefore, the role of TyG index in identifying patients at risk of developing DR remains unclear. The current study examined the relationship of TyG index with the prevalence and incidence of DR in a multiethnic cohort study.
Materials and Methods
Study Population
In this study, we included a subset of 1339 patients from the SMART2D study, a prospective cohort study with patient’s recruitment between February 2011 and March 2014. The study complied with the Declaration of Helsinki and was approved by the National Healthcare Group (Domain Specific Review Board) in Singapore. The methodology of SMART2D has been previously described in detail elsewhere.13
In brief, patients with age ranging from 21 to 83 years, either gender and ethnicity and with a positive history of type 2 diabetes were included in the study. Diagnosis of type 2 diabetes was based on the American Diabetes Association criteria.14 The exclusion criteria were as follows: unable to give informed consent, patients with type 1 diabetes, pregnancy, malignancy, pacemaker/any device that could interfere with the flow of electric current, use of non-steroidal anti-inflammatory drugs on assessment day or oral steroids with dosage equivalent > 5 mg per day of prednisolone. Participants were instructed not to take insulin injection on the day of the study visit. After phlebotomy, those with fasting glucose < 4.5 mmol/l or > 15.0 mmol/l, and subjects with HbA1c > 108 mmol/mol (> 12%) were excluded from the study.
Data Collection
Following written informed consent, trained research nurses collected data on socio-demographic, lifestyle, medical history, and family history using a standardized questionnaire during face-to-face interviews. Anthropometric measurements were assessed in all study subjects and included weight (kg), height (cm) and body mass index, BMI=Weight (kg)/Body Height2 (m2). Waist circumference (between uppermost lateral border of right and left ilium) and hip circumference (widest part of the hip at the level of the greater trochanter) were measured using non-stretchable plastic tape to the nearest 0.1 cm. Hypertension was defined as a self-reported hypertension, currently taking anti-hypertensive drugs or measured systolic blood pressure (SBP) ≥140 mmHg and/or diastolic blood pressure (DBP) ≥90 mmHg. Following 10 minutes of rest, BP was measured in sitting position on the right arm of subject using a standardized mercury sphygmomanometer and repeated twice with average of the two recorded sets of values used in the analyses.
Assessment of DR
Non-mydriatic digital images of the retina for both eyes were taken by a trained research nurse using a retinal camera (TRC-NW200, Topcon Co., Japan). Digital color fundus photographs were assessed in a masked fashion for the presence and severity of DR (categorized into non-proliferative DR, NPDR and proliferative DR, PDR) to minimize any possible bias. DR was considered present if any characteristic lesions as defined by the Early Treatment Diabetic Retinopathy Study, such as microaneurysms, hemorrhages, cotton wool spots, intraretinal microvascular abnormalities, hard exudates, and new retinal vessels were present.15 The minimum criterion for diagnosis of DR was the presence of at least one definite microaneurysm and/or retinal hemorrhage. The fundus photographs were not graded and labeled as ungradable if more that 50% of the retinal photographs were not clearly visible. Subjects without the presence of any DR were included in the control group.
Biochemical Analysis
On the day of the study visit, fasting blood samples were taken after 12–14h of overnight fasting for biochemical measurements that were performed and quantified by our hospital laboratory accredited by the College of the American Pathologists. HbA1c was measured based on monoclonal antibody agglutination reaction by a point-of-care immunoassay analyzer that has met the National Glycohemoglobin Standardization Program performance standard (DCA Vantage Analyzer; Siemens: Erlangen, Germany). HDL cholesterol and LDL cholesterol were quantified by enzymatic method using Kodak Ektachem chemistry slides. Urinary albumin-to-creatinine ratio (uACR) was determined by urinary creatinine measured by enzymatic method on Roche/Hitachi cobas c system (Roche Diagnostic GmbH, Mannheim, Germany) and albumin measured by a solid-phase competitive chemiluminescent enzymatic immunoassay with a lower detection limit of 2.5 µg/mL (Immulite; DPC, Gwynedd, UK). Estimated GFR (eGFR) was calculated based on a widely used Chronic Kidney Disease Epidemiology Collaboration (CKD-EPI) equation in patients with diabetes.16 Diabetic nephropathy (Chronic kidney disease) was defined by the presence of eGFR <60 mL/min per 1.73m2 or uACR≥30mg/g.17
Estimation of TyG Index
Blood levels of glucose and triglycerides were estimated enzymatically using the Hitachi auto-analyzer. The TyG index was calculated as the natural logarithm (Ln) of the product of plasma glucose and TG using the formula: Ln (TG [mg/dL] × glucose [mg/dL]/2).
Statistical Analysis
Group comparisons of categorical and continuous variables were performed using chi-squared test or analysis of variance, as appropriate. Non-parametric tests such as the Mann–Whitney U-test and the Kruskal–Wallis were also performed. In logistic regression and Cox regression analyses, DR prevalence and DR incidence were analyzed as dependent variables. Odds ratio (OR) of association for TyG index (continuous variables) was estimated in base models (Model 1: unadjusted), and adjusted in hierarchical models that controlled for age, gender, ethnicity (Model 2); and finally, with duration of type 2 diabetes, BMI, eGFR, uACR and SBP (Model 3). To assess the effect of modification of HbA1c, patients were stratified into two groups based on HbA1C level (HbA1c <7.0 and HbA1c ≥ 7.0). Accuracy was measured by the Area under the Curves using ROC analyses and C statistics.
A total of 1339 patients were included for analysis of DR prevalence. For the analysis of DR incidence, 210 of the 1339 patients were included. These patients had DR assessment at baseline as well as follow-up visit with a median of 3.2 years and did not have any DR at baseline. A 2-sided p value of less than 0.05 was considered as statistically significant. All analyses were conducted with SPSS statistical software version 24.0 (Armonk, NY: IBM Corp.).
Results
In this study, we included data from 1339 diabetic subjects who participated in the SMART2D cohort study. The mean age of study population was 59.2 years ± SD, with a slight preponderance of participants with male gender (55.9%) and Chinese ethnicity (53%).
The TyG index and the prevalence of DR
Presence of any DR were detected in 404 of the 1339 participants (prevalence = 30.17%). Table 1 displays baseline characteristics of the study participants with NDR and DR. Participants with DR were found to have significantly higher TyG index, HbA1c levels, systolic BP, uACR, longer duration of type 2 diabetes and lower eGFR when compared to those with NDR.
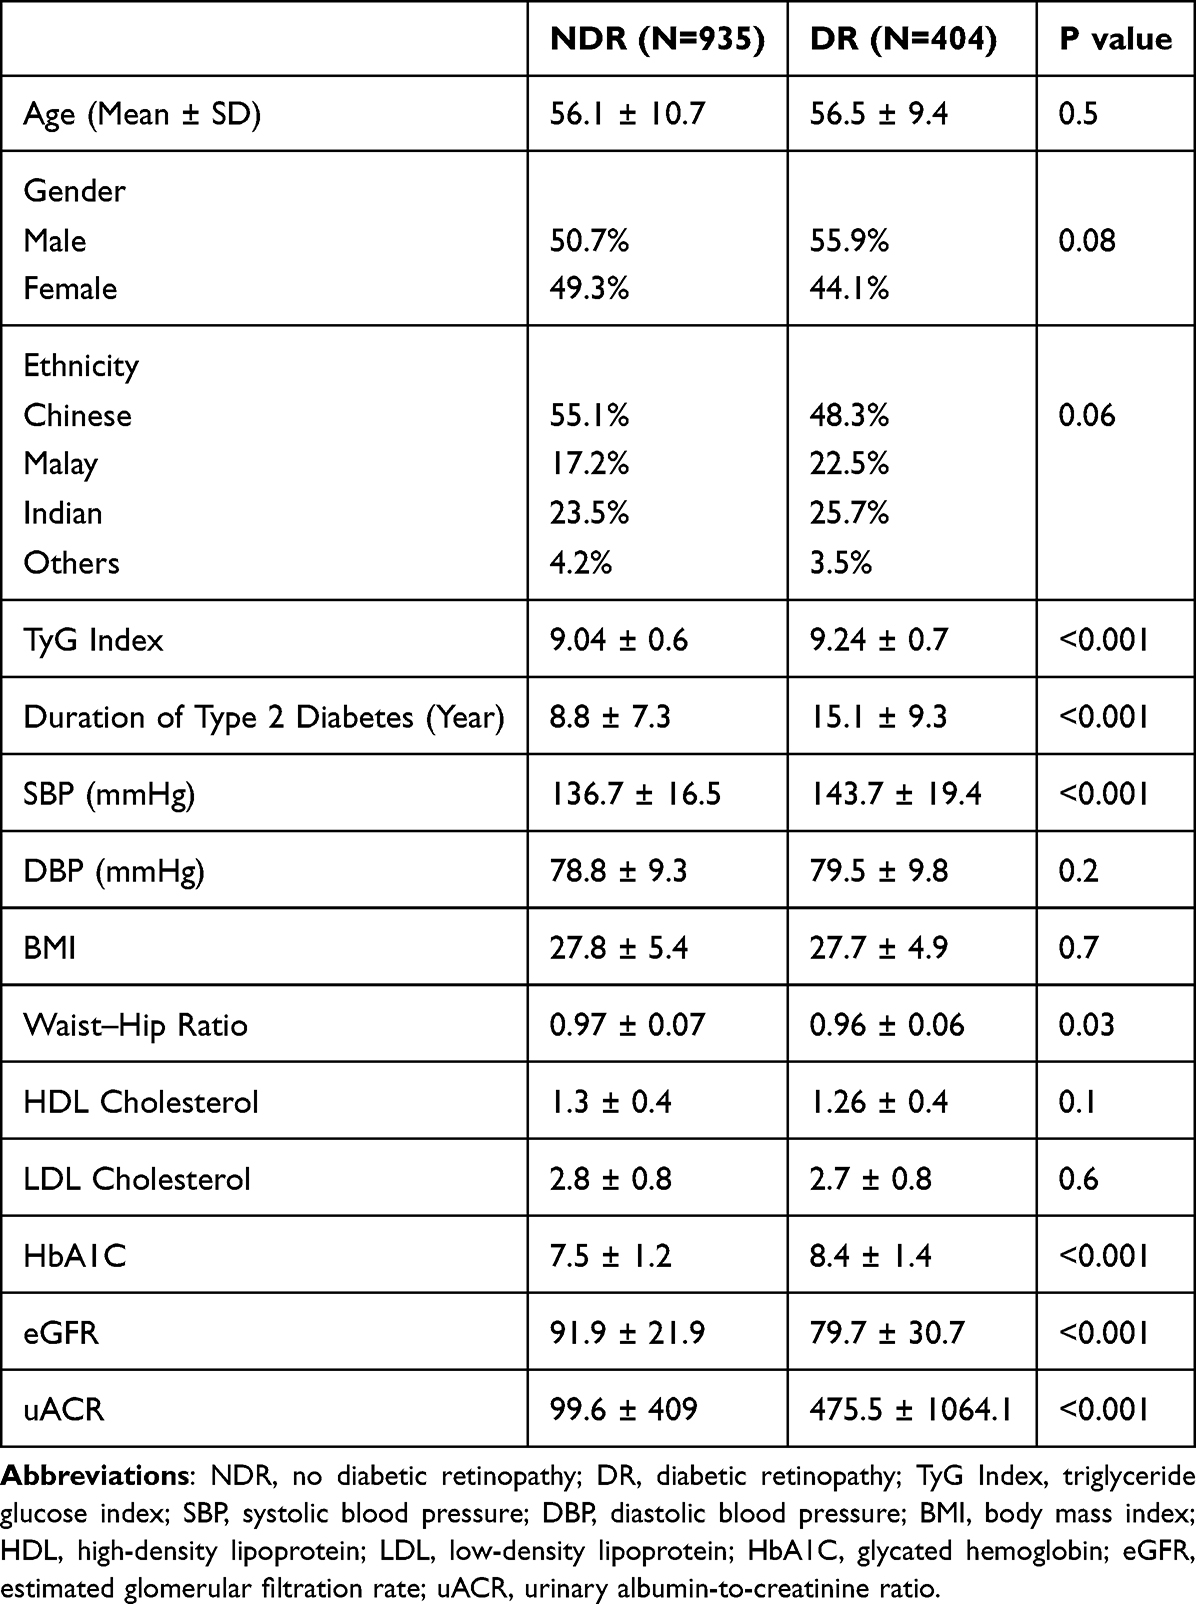 |
Table 1 Patient Baseline Characteristics Between Follow-Up Diabetic Retinopathy (N=1339) |
Logistic regression analyses (Table 2) showed that TyG index was significantly associated with DR prevalence (OR 1.6, 95% CI 1.3–1.9, p <0.001) in the unadjusted base model (Model 1) and adjusted model (OR 1.7, 95% CI 1.4–1.9, p <0.001) for age, gender, ethnicity (Model 2). The TyG index remained significantly associated with DR prevalence (OR 1.4, 95% CI 1.1–1.7, p=0.002) with further adjustments for duration of type 2 diabetes, BMI, eGFR, uACR and SBP (Model 3). When patients were stratified with respect to the HbA1c level, the TyG index was significantly associated with DR prevalence in the subgroup with HbA1c level < 7.0% (OR 2.0, 95% CI 1.1–3.8, p =0.03) but a null association between the TyG index and the prevalence of DR in the subgroup with HbA1C ≥ 7.0% (OR 1.1, 95% CI 0.8–1.4, p= 0.5).
 |
Table 2 Logistic Regression Analysis of the TyG Index and Other Risk Factor for the Prevalence of DR |
The ROC curve (Figure 1) showed that the optimal cut-off value of the TyG index level for predicting DR prevalence was 0.29 (sensitivity 70% and specificity 26%), with an area under the curve of 0.77 (95% CI 0.74–0.80, p value <0.001). Adding the TyG index to the model of established risk factors significantly improved the prediction of DR (p value <0.001).
 |
Figure 1 Area under the ROC curve (AUC) of the DR prevalence. |
TyG index and Incidence of DR
Of the 210 participants with NDR at baseline, 30 participants developed DR over a median follow-up period of 3.2 years (incidence = 14.28%), with 29 (96.6%) having NPDR and 1 (3.4%) having PDR. Table 3 shows characteristics of study participants with incident no DR and DR. Participants who developed DR were found to have significantly higher TyG index and mean HbA1c levels when compared to those with NDR at follow-up visit.
 |
Table 3 Patient Baseline Characteristics: Diabetic Retinopathy Incidence (N=210) |
Cox regression analyses showed (Table 4) that TyG index was significantly associated with DR incidence (OR=1.6, 95% CI 1.1–2.9, p=0.02) in the unadjusted base model (Model 1) and adjusted model (OR=1.8, 95% CI 1.1–2.9, p=0.01) for age, gender, ethnicity (Model 2). TyG index remained significantly associated with DR incidence (OR=1.8, 95% CI 1.13–2.9, p=0.01) with further adjustments for duration of type 2 diabetes, BMI, eGFR, and uACR (Model 3). The HbA1c level did not have a modifying effect on the TyG index and incidence of DR (p =0.6).
 |
Table 4 Cox Regression Analysis of TyG Index and Other Risk Factors for DR Incidence |
The ROC analysis (Figure 2) showed that the optimal cut-off value of the TyG index level for predicting DR incidence was 0.11 (sensitivity 84% and specificity 50%), with an area under the curve of 0.66 (95% CI 0.57–0.76, p value < 0.01). Adding the TyG index to the model of established risk factors improved the prediction of incident DR marginally (p value < 0.01).
 |
Figure 2 Area under the ROC curve (AUC) of the DR incidence. |
Discussion
This is the first study to examine the association of TyG index with prevalence and incidence of DR in a multi-ethnic cohort study. The data showed that there is an independent association of TyG index with prevalence as well as incidence of DR and addition of TyG index into clinical model with established risk factors significantly improved the prediction of DR. Moreover, HbA1c level modified the effect of TyG index on prevalence of DR but not incident DR. These observations suggest that TyG index may be a novel marker for risk stratification of DR in patients with type 2 diabetes.
Currently, there is paucity of data relating to TyG index and prevalence of DR with none on the incidence of DR. In the past, three studies evaluated the association of TyG index with DR.10–12 Our findings are consistent with a single study that reported positive association between TyG index and DR, the observed relationship between TyG index and DR was stronger in our study (OR 1.6 vs 1.45).10 In addition to age, smoking and BP, our study adjusted for additional confounding factors using a hierarchical regression model, as shown in Table 3. Of the past three studies, two failed to demonstrate a meaningful relationship between TyG index and DR (negative in one and null in the other).11,12 This may be attributable to differences in study population (disease severity, duration of diabetes, burden of comorbidities) and methodology, such as detection of DR using ophthalmic examination in the study showing null association.
In this study, the prevalence and incidence rate of DR was found to be 30.17% and 14.28%, respectively, and these rates are comparable to those reported in Asian18 and Western3 populations. Consistent with past studies, we also identified HbA1c, systolic BP and duration of diabetes as factors associated with prevalence of DR, whereas HbA1c was the one and only factor associated with incidence of DR.3,19,20 Furthermore, lower e-GFR and higher uACR, two distinct but complementary markers suggestive of chronic kidney disease, were also associated with DR prevalence in our study. Few studies in the past have reported a good degree of correlation between the presence of albuminuria and the degree of retinopathy.21,22 It was also proposed that this correlation may be attributable to common mechanisms, such as impairment of endothelial cells, involved in renal and retinal tissue damage.
It is well established that plasma HbA1c is the most reliable marker for evaluating long term glycemic control and has been consistently demonstrated to be associated with risk of DR development and progression. Our results show that addition of TyG index to the clinical model with established risk factors, such as HbA1c, significantly improved the prediction of prevalence and incidence of DR as suggested by ROC analyses. We believe that this observation may be because TyG index better reflects the joint role of glucose and TG in DR. Indeed, a combination of glucotoxicity (hyperglycemia) and lipotoxicity (increase TG) exacerbates the reactive oxygen–species production in mitochondria and intensifies the underlying pathological processes in DR, such as endothelial dysfunction.23 In a stratified analysis, the TyG index was associated with DR prevalence only in the subgroup with HbA1c level < 7% but not in the subgroup with HbA1c level 7 and above, indicating that HbA1c has a modifying effect in the subgroup with optimal glycemic control. Clinically, it will therefore be beneficial to consider TyG index as a secondary treatment target in patients with good glycaemic control. The modifying effect of HbA1c on TyG index was not observed with incidence of DR due to small number of patients for DR incidence analysis.
The TyG index is believed to be a simple and reliable marker for IR.24 IR plays a key role in the pathogenesis of DR, but the underlying mechanisms remain unclear. Ischemic damage in DR can be further amplified by IR which has been related to a lower ability of insulin to induce vasodilation through impaired nitric oxide endothelial production and/or accelerated inactivation.25 Also, defective fibrinolysis caused by excess plasminogen activator inhibitor-1 activity and selective inhibition of some anti-atherogenic effects of insulin may promote further occlusion of retinal micro-capillaries and secondary ischemia.26 Moreover, past studies have demonstrated that IR is associated with pathological process, such as endothelial dysfunction (associated with DR via oxidative stress), alterations in hemostatic process and inflammation, and all these processes may further increase the risk of DR.27,28
The TyG index, as the product of fasting plasma glucose and TG, has been suggested as a simple, easy to use and cost-effective method for evaluating IR due to the simplicity of calculation from two routine low-cost biochemical measurements. When compared to insulin levels, fasting TGs have lower within-subject (19.9%) and between-subject biological variability (32.7%). The testing of TGs by enzymatic methods is standardized and analytically accessible to all clinical laboratories. This novel index is also believed to be a reliable surrogate of IR with good sensitivity (96.5%) and specificity (85.0%) for IR detection when compared to the gold standard.29 In addition, the TyG index is believed to be superior to HOMA-IR, the most common method for IR assessment, since it does not require quantification of insulin, may apply to all of the patients treated with insulin, and more representative of hepatic IR.30
The strength of our study is the cohort study design, multi-ethnic population and grading of DR using fundus photograph. The limitations of the study include, the number of patients and short follow-up period for incidence analysis. Also, the measurement of TG and fasting glucose were only conducted at baseline so within-subject biological variability of these measurements could not therefore be minimized. Moreover, other confounding factors, such as exercise habit and nutritional status as part of diabetes, were not included in the model for analysis and may have affected our observations.
Conclusion
The TyG index (composed of fasting triglyceride and fasting glucose) is a useful marker that may help optimize risk stratification for DR in patients with type 2 diabetes. It may be beneficial to consider TyG index as a secondary treatment target in patients with optimally controlled HbA1c. We suggest that educational interventions should be provided for patients with a high TyG index with regard to lifestyle changes. Future population-based studies with larger sample and longer duration are required to confirm our observations.
Abbreviations
TyG index, triglyceride glucose index; DR, diabetic retinopathy; IR, insulin resistance; NDR, No diabetic retinopathy; NPDR, non-proliferative; DR, PDR, proliferative DR; SBP, systolic blood pressure; DBP, diastolic blood pressure; BMI, body mass index; HDL, high-density lipoprotein; LDL, low-density lipoprotein; HbA1C, glycated hemoglobin; eGFR, estimated glomerular filtration rate; uACR, urinary albumin-to-creatinine ratio.
Acknowledgment
This study is supported by Singapore Ministry of Health’s National Medical Research Council under its CS-IRG (MOH-000066). The corresponding author is supported by the Singapore Ministry of Health’s National Medical Research Council under its Clinician Scientist Award (MOH-000714–01).
The authors would like to sincerely thank Esther Ho Lirong for helping with the revision and submission of the manuscript.
Author Contributions
All authors made a significant contribution to the work reported, whether that is in the conception, study design, execution, acquisition of data analysis and interpretation, or in all these areas; took part in drafting, revising or critically reviewing the article; gave final approval of the version to be published; have agreed on the journal to which the article has been submitted; and agree to be accountable for all aspects of the work.
Disclosure
The authors report no conflicts of interest in this work.
References
1. Facts & figures. Available from: https://idf.org/aboutdiabetes/what-is-diabetes/facts-figures.html.
2. Lee R, Wong TY, Sabanayagam C. Epidemiology of diabetic retinopathy, diabetic macular oedema and related vision loss. Eye Vision. 2015;2:17. doi:10.1186/s40662-015-0026-2
3. Yau JWY, Rogers SL, Kawasaki R, et al. Global prevalence and major risk factors of diabetic retinopathy. Diabetes Care. 2012;35(3):556–564. doi:10.2337/dc11-1909
4. Wong TY, Sabanayagam C. The war on diabetic retinopathy: where are we now? Asia-Pacific J Ophthalmol. 2019;8(6):448–456. doi:10.1097/APO.0000000000000267
5. Courtney CH, Olefsky JM. Insulin Resistance. in Mechanisms of Insulin Action: Medical Intelligence Unit 185–209. New York: Springer; 2007. doi:10.1007/978-0-387-72204-7_10
6. Jin JL, Cao YX, Wu LG, et al. Triglyceride glucose index for predicting cardiovascular outcomes in patients with coronary artery disease. J Thorac Dis. 2018;10(11):6137–6146. doi:10.21037/jtd.2018.10.79
7. Gutch M, Kumar S, Razi SM, Gupta KK, Gupta A. Assessment of insulin sensitivity/resistance. Indian J Endocrinol Metab. 2015;19(1):160–164. doi:10.4103/2230-8210.146874
8. Antoniolli LP, Nedel BL, Pazinato TC, de Andrade Mesquita L, Gerchman F. Accuracy of insulin resistance indices for metabolic syndrome: a cross-sectional study in adults. Diabetol Metab Syndr. 2018;10(1):65. doi:10.1186/s13098-018-0365-y
9. Guerrero-Romero F, Simental-Mendia LE, Gonzalez-Ortiz M, et al. The product of triglycerides and glucose, a simple measure of insulin sensitivity Comparison with the Euglycemic-Hyperinsulinemic Clamp. J Clin Endocrinol Metabol. 2010;95(7):3347–3351. doi:10.1210/jc.2010-0288
10. Srinivasan S, Singh P, Kulothungan V, Sharma T, Raman R. Relationship between triglyceride glucose index, retinopathy and nephropathy in Type 2 diabetes. Endocrinol Diabetes Metabol. 2021;4(1):e–00151. doi:10.1002/edm2.151
11. Chiu H, Tsai HJ, Huang JC, et al. Associations between triglyceride-glucose index and micro-and macro-angiopathies in type 2 diabetes mellitus. Nutrients. 2020;12(2):328. doi:10.3390/nu12020328
12. Yao L, Wang X, Zhong Y, et al. The triglyceride–glucose index is associated with diabetic retinopathy in Chinese patients with type 2 diabetes: a hospital-based, nested, case–control study. Diabetes Metabol Syndrome Obesit. 2021;14:1547–1555. doi:10.2147/DMSO.S294408
13. Liu JJ, Tavintharan S, Yeoh LY, et al. High normal albuminuria is independently associated with aortic stiffness in patients with type 2 diabetes. Diabetic Med. 2014;31(10):1199–1204. doi:10.1111/dme.12461
14. American Diabetes Association (ADA). Diagnosis and classification of diabetes mellitus. Diabetes Care. 2006;29(29):S43–48. doi:10.2337/diacare.29.s1.06.s43
15. Wilkinson CP, Ferris FL, Klein RE, et al. Proposed international clinical diabetic retinopathy and diabetic macular oedema disease severity scales. Ophthalmology. 2003;110(9):1677–1682. doi:10.1016/S0161-6420(03)00475-5
16. Rognant N, Lemoine S, Laville M, et al. Performance of the chronic kidney disease epidemiology collaboration equation to estimate glomerular filtration rate in diabetic patients. Diabetes Care. 2011;34(6):1320–1322. doi:10.2337/dc11-0203
17. KIDGO. Kidney Disease: Improving Global Outcomes (KDIGO) CKD Work Group. KDIGO 2012 clinical practice guideline for the evaluation and management of chronic kidney disease. Kidney Int Suppl. 2013;3:1–150.
18. Majithia S, Tham YC, Chee ML, et al. Cohort profile: the Singapore Epidemiology of Eye Diseases study (SEED). Int J Epidemiol. 2021;50(1):41–42. doi:10.1093/ije/dyaa238
19. Matuszewski W, Stefanowicz-Rutkowska MM, Szychlińska M, Bandurska-Stankiewicz E. Differences in risk factors for diabetic retinopathy in type 1 and type 2 diabetes mellitus patients in north-east Poland. Medicina. 2020;56(4):177. doi:10.3390/medicina56040177
20. Lind M, Pivodic A, Svensson AM, Olafsdottir AF, Wedel H, Ludvigsson J. HbA1c level as a risk factor for retinopathy and nephropathy in children and adults with type 1 diabetes: Swedish population based cohort study. Br Med J. 2019;366:14894.
21. Zhuang X, Cao D, Yang D, et al. Association of diabetic retinopathy and diabetic macular oedema with renal function in southern Chinese patients with type 2 diabetes mellitus: a single-centre observational study. Br Med J Open. 2019;9:e031194.
22. Deckert T, Feldt-Rasmussen B, Borch-Johnsen K, Jensen T, Kofoed-Enevoldsen A. Albuminuria reflects widespread vascular damage - The Steno hypothesis. Diabetologia. 1989;32(4):219–226. doi:10.1007/BF00285287
23. Klein R, Sharrett AR, Klein BE, et al. The association of atherosclerosis, vascular risk factors, and retinopathy in adults with diabetes: the Atherosclerosis Risk in Communities Study. Ophthalmology. 2002;109(7):1225–1234. doi:10.1016/S0161-6420(02)01074-6
24. Unger G, Benozzi SF, Perruzza F, Pennacchiotti GL. Triglycerides and glucose index: a useful indicator of insulin resistance. Endocrinología y Nutrición. 2014;61(10):533–540. doi:10.1016/j.endoen.2014.11.006
25. Kolluru GK, Bir SC, Kevil CG. Endothelial dysfunction and diabetes: effects on angiogenesis, vascular remodelling, and wound healing. Int J Vasc Med. 2012;2012:30.
26. Kearney K, Tomlinson D, Smith K, Ajjan R. Hypofibrinolysis in diabetes: a therapeutic target for the reduction of cardiovascular risk. Cardiovasc Diabetol. 2017;16(1):34. doi:10.1186/s12933-017-0515-9
27. Grauslund J, Green A, Kawasaki R, Hodgson L, Sjolie AK, Wong TY. Retinal vascular fractals and microvascular and macrovascular complications in type 1 diabetes. Ophthalmology. 2010;117(7):1400–1405. doi:10.1016/j.ophtha.2009.10.047
28. Kumar B, Kowluru A, Kowluru RA. Lipotoxicity augments glucotoxicity-induced mitochondrial damage in the development of diabetic retinopathy. Invest Ophthalmol Vis Sci. 2015;56:2985–2992. doi:10.1167/iovs.15-16466
29. Wang S, Shi J, Peng Y, et al. Stronger association of triglyceride glucose index than the HOMA-IR with arterial stiffness in patients with type 2 diabetes: a real-world single-centre study. Cardiovasc Diabetol. 2021;20(1):82. doi:10.1186/s12933-021-01274-x
30. Thompson DS, Boyne MS, Osmond C, et al. Limitations of fasting indices in the measurement of insulin sensitivity in Afro-Caribbean adults. BioMed Centr Res Notes. 2014;7:98. doi:10.1186/1756-0500-7-98
 © 2023 The Author(s). This work is published and licensed by Dove Medical Press Limited. The full terms of this license are available at https://www.dovepress.com/terms.php and incorporate the Creative Commons Attribution - Non Commercial (unported, v3.0) License.
By accessing the work you hereby accept the Terms. Non-commercial uses of the work are permitted without any further permission from Dove Medical Press Limited, provided the work is properly attributed. For permission for commercial use of this work, please see paragraphs 4.2 and 5 of our Terms.
© 2023 The Author(s). This work is published and licensed by Dove Medical Press Limited. The full terms of this license are available at https://www.dovepress.com/terms.php and incorporate the Creative Commons Attribution - Non Commercial (unported, v3.0) License.
By accessing the work you hereby accept the Terms. Non-commercial uses of the work are permitted without any further permission from Dove Medical Press Limited, provided the work is properly attributed. For permission for commercial use of this work, please see paragraphs 4.2 and 5 of our Terms.