Back to Journals » International Journal of General Medicine » Volume 18
Association of Systemic Inflammation Indexes with 90-Day Functional Outcomes in Acute Ischemic Stroke Patients Undergoing Intravenous Thrombolysis
Authors Wang W, Huang H, Ma Q, Cao K
Received 19 June 2025
Accepted for publication 1 October 2025
Published 23 October 2025 Volume 2025:18 Pages 6425—6441
DOI https://doi.org/10.2147/IJGM.S545138
Checked for plagiarism Yes
Review by Single anonymous peer review
Peer reviewer comments 2
Editor who approved publication: Dr Redoy Ranjan
Weijun Wang,1,* Huiying Huang,2,* Qing Ma,1 Kun Cao1
1Department of Neurology, North Sichuan Medical College, Nanchong, Sichuan, 637000, People’s Republic of China; 2Department of Neurology, People’s Hospital of Leshan, Leshan, Sichuan, 614000, People’s Republic of China
*These authors contributed equally to this work
Correspondence: Huiying Huang, Department of Neurology, People’s Hospital of Leshan, No. 639, Huian Road, Shizhong District, Leshan, Sichuan, 614000, People’s Republic of China, Tel +86 2090900, Email [email protected]
Background and Purpose: The neutrophil-to-lymphocyte ratio (NLR) is a well-established inflammatory marker, while newer indices such as the systemic inflammation response index (SIRI), inflammation prognostic index (IPI), systemic immune-inflammation index (SII), and pan-immune-inflammation value (PIV) provide broader insights into systemic inflammation and immune status. This study evaluated the association between these composite indices, their dynamic changes after intravenous thrombolysis, and 90-day outcomes in acute ischemic stroke (AIS).
Methods: We retrospectively included AIS patients treated with intravenous rt-PA within 4.5 hours at Leshan People’s Hospital and Qianwei County People’s Hospital (September 2021–January 2025). Hematological parameters at admission and day 7 were used to calculate NLR, SIRI, SII, IPI, and PIV. Outcomes were assessed by the modified Rankin Scale (mRS) at 3 months, categorized as favorable (mRS 0– 2) vs unfavorable (mRS 3– 6), or survival (mRS 0– 5) vs death (mRS 6). Multivariable logistic regression and receiver operating characteristic (ROC) analyses were performed.
Results: Among 269 patients, inflammatory indices showed distinct patterns across groups. SII, SIRI, PIV, and IPI increased in patients with unfavorable outcomes or death but decreased in those with favorable outcomes or survival. T2 values and relative changes (FC) were significantly associated with outcomes. In adjusted models, IPI, SIRI, and PIV at T2 and their dynamic changes remained independent predictors, while SII was significant for unfavorable outcomes but marginal for mortality (P = 0.072). ROC analysis showed moderate discrimination (AUC > 0.6), with IPI and SIRI demonstrating the best predictive value.
Conclusion: Dynamic changes in composite inflammatory indices after thrombolysis are closely associated with 3-month outcomes in AIS. As simple and reproducible markers derived from routine blood tests, these indices may aid short-term risk stratification and individualized management.
Keywords: systemic inflammation index, systemic immune-inflammation index, inflammation prognostic index, pan-immune-inflammation value, acute ischemic stroke, intravenous thrombolysis, retrospective study
Introduction
Stroke is one of the leading causes of death in China and globally, characterized by high mortality and disability rates.1 The prevalence of stroke in China (2.6% in 2020) was higher than the global estimate (1.2% in 2019). The incidence rate of first-ever stroke in China (505.2 per 100,000 person-years in 2020) also exceeded that reported in Japan (317.0 per 100,000 person-years for individuals aged ≥45 years in 2011), Singapore (229.6 per 100,000 population in 2017), and the European Union.2,3 Although there is no universally accepted definition for the acute phase of stroke, it is generally considered to encompass the first two weeks after onset, with the acute phase of mild stroke typically lasting up to one week, and that of severe stroke extending up to one month.4 Intravenous thrombolysis within 4.5 hours of symptom onset remains the standard treatment for AIS. However, despite timely and standardized therapy, a considerable proportion of patients still experience unfavorable outcomes.5 Therefore, developing effective models for functional outcome prediction holds substantial clinical value for individualized treatment and prognosis improvement.
In recent years, the role of immune-inflammatory mechanisms in influencing stroke outcomes has garnered increasing attention.6 Studies have demonstrated that various blood cell-based systemic inflammatory markers—such as the neutrophil-to-lymphocyte ratio (NLR), platelet-to-lymphocyte ratio (PLR), lymphocyte-to-monocyte ratio (LMR), systemic immune-inflammation index (SII), pan-immune-inflammation value (PIV), and systemic inflammation response index (SIRI)—have significant clinical relevance in AIS.7,8 These biomarkers can be readily quantified using peripheral blood samples, offering advantages such as simplicity, low invasiveness, and cost-effectiveness. As emerging prognostic indicators that integrate NLR with other inflammatory parameters, PIV, NLR, IPI, SII, and SIRI provide a simple and reproducible method for stroke outcome prediction. They may also assist in early identification of high-risk patients and guide targeted interventions. Although previous studies have indicated the potential of SII, PLR, and NLR in predicting outcomes in AIS patients receiving thrombolytic therapy,9,10 most were limited by small sample sizes, regional variability, and lack of dynamic assessment. Therefore, we conducted this study to further evaluate the associations of PIV, IPI, SII, SIRI, and their temporal changes with short-term outcomes in AIS patients receiving thrombolysis, aiming to provide potential predictive tools for precision management.
Materials and Methods
Study Design and Participants
This retrospective study included consecutive AIS patients who received intravenous recombinant tissue-type plasminogen activator (rt-PA) between September 2021 and January 2025. A total of 721 patients were enrolled (635 from Leshan People’s Hospital and 86 from Qianwei County People’s Hospital). Inclusion criteria were: (1) age ≥18 years; (2) diagnosis of AIS according to Chinese guidelines; (3) intravenous thrombolysis with rt-PA within 4.5 hours of symptom onset; and (4) pre-stroke modified Rankin Scale (mRS) score ≤2. Exclusion criteria included: (1) malignancy, autoimmune disease, or hematologic disorders; (2) acute or chronic infection; (3) severe hepatic or renal dysfunction; (4) missing follow-up data; (5) parasitic infection; (6) significant trauma (eg, fracture); and (7) oral anticoagulant use with INR >1.5 or heparin therapy within 48 hours (abnormal APTT); and (8) absence of hematological data at 7 days.
Functional outcomes were assessed via telephone follow-up at 90 days post-stroke onset. The patient screening flowchart is illustrated in Figure 1.
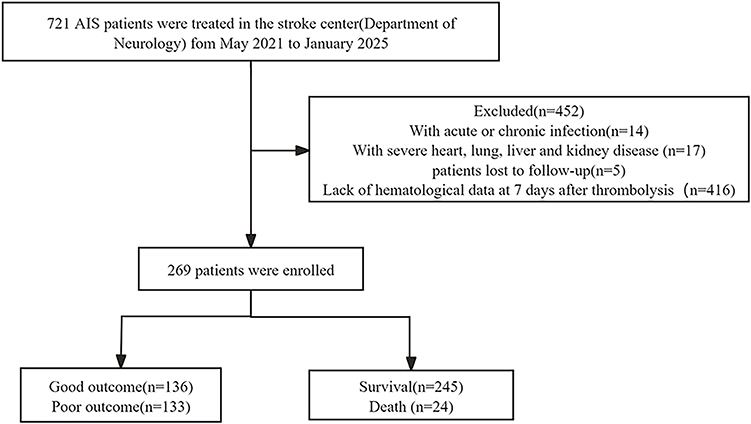 |
Figure 1 Flow diagram showing the patient selection process. |
Intravenous Rt-PA Thrombolytic Therapy
The standard dose of recombinant tissue-type plasminogen activator (rt-PA) was 0.9 mg/kg (10% administered as a bolus injection and the remaining 90% infused continuously over 1 hour; maximum dose: 90 mg). A low-dose regimen of 0.6 mg/kg (15% bolus and 85% continuous infusion over 1 hour; maximum dose: 60 mg) was also applied in some patients. All patients received a single thrombolytic treatment.11
Definitions of Inflammatory Indices
The following inflammatory indices were calculated based on peripheral blood parameters:
NLR = Neutrophil count / Lymphocyte count
IPI = High-sensitivity C-reactive protein (Hs-CRP) × NLR / Albumin (ALB)
SII = Platelet count × Neutrophil count / Lymphocyte count
SIRI = Monocyte count × Neutrophil count / Lymphocyte count
PIV = (Neutrophil count × Platelet count × Monocyte count) / Lymphocyte count
Data Collection
Demographic information (age, sex), medical history (hypertension, diabetes, atrial fibrillation, coronary artery disease, prior stroke, smoking and alcohol consumption), and pre-stroke medications (antiplatelet agents, statins, anticoagulants) were collected. Stroke severity and functional status at admission were assessed by experienced clinicians using the modified Rankin Scale (mRS). At 3 months, functional outcomes were evaluated by telephone follow-up conducted independently by two trained physicians. Favorable outcome was defined as functional independence (mRS score 0–2), while an mRS (3–6) considered unfavorable. Survival was defined as an mRS score of 0–5, and an mRS score of 6 indicated death.12
Measurement of Composite Inflammatory Ratios Based on Blood Tests
Venous blood samples were collected within 24 hours of admission and again on day 7 during hospitalization. If multiple tests were performed within 24 hours, the first result was used. Recorded laboratory parameters included neutrophil, lymphocyte, monocyte, and platelet counts, as well as levels of Hs-CRP and albumin.
Statistical Analysis
Continuous variables were first tested for normality using the Shapiro–Wilk test. Variables with approximate normal distribution were expressed as mean ± standard deviation (SD) and compared using the independent-samples t test, while non-normally distributed variables were presented as median (interquartile range, IQR) and compared using the Wilcoxon rank-sum test (Mann–Whitney U-test). Categorical variables were expressed as counts (percentages) and compared using Pearson’s χ²-test or Fisher’s exact test when expected frequencies were <5. Dynamic changes in inflammatory indices (SII, SIRI, PIV, and IPI) between baseline (T1) and day 7 (T2) were evaluated using the paired Wilcoxon signed-rank test and visualized with line plots. Fold change (FC) was calculated as T2/T1 (percentage change = (T2/T1 − 1) × 100%). To reduce skewness and facilitate effect size interpretation, log-transformed values (logT1 and logT2, base 10) were entered into regression models. Univariable logistic regression was used to assess associations between inflammatory indices and 3-month unfavorable outcome or mortality, followed by multivariable logistic regression adjusting for age, sex, and baseline NIHSS score. Predictive performance was evaluated using receiver operating characteristic (ROC) curves and the area under the curve (AUC). All tests were two-sided, and a P value <0.05 was considered statistically significant. Statistical analyses were performed with R software (version 4.3.2; R Foundation for Statistical Computing, Vienna, Austria).
Results
A total of 269 patients were enrolled, with a mean age of 70.59 ± 11.58 years. Patients were stratified into favorable versus unfavorable outcome groups, and survival versus death groups, for comparative analysis (Table 1). Compared with the favorable outcome group, patients with unfavorable outcomes had significantly higher levels of SII, SIRI, PIV, and IPI at T2, as well as higher IPI at T1. They were also older, had lower serum albumin and hemoglobin, and more frequently presented with hypertension, cardiac disease, and pulmonary disease. Compared with survivors, patients in the death group exhibited significantly higher SII, SIRI, and IPI at T2, as well as higher IPI at T1. Pulmonary disease was more prevalent and hemoglobin levels were lower in the death group.
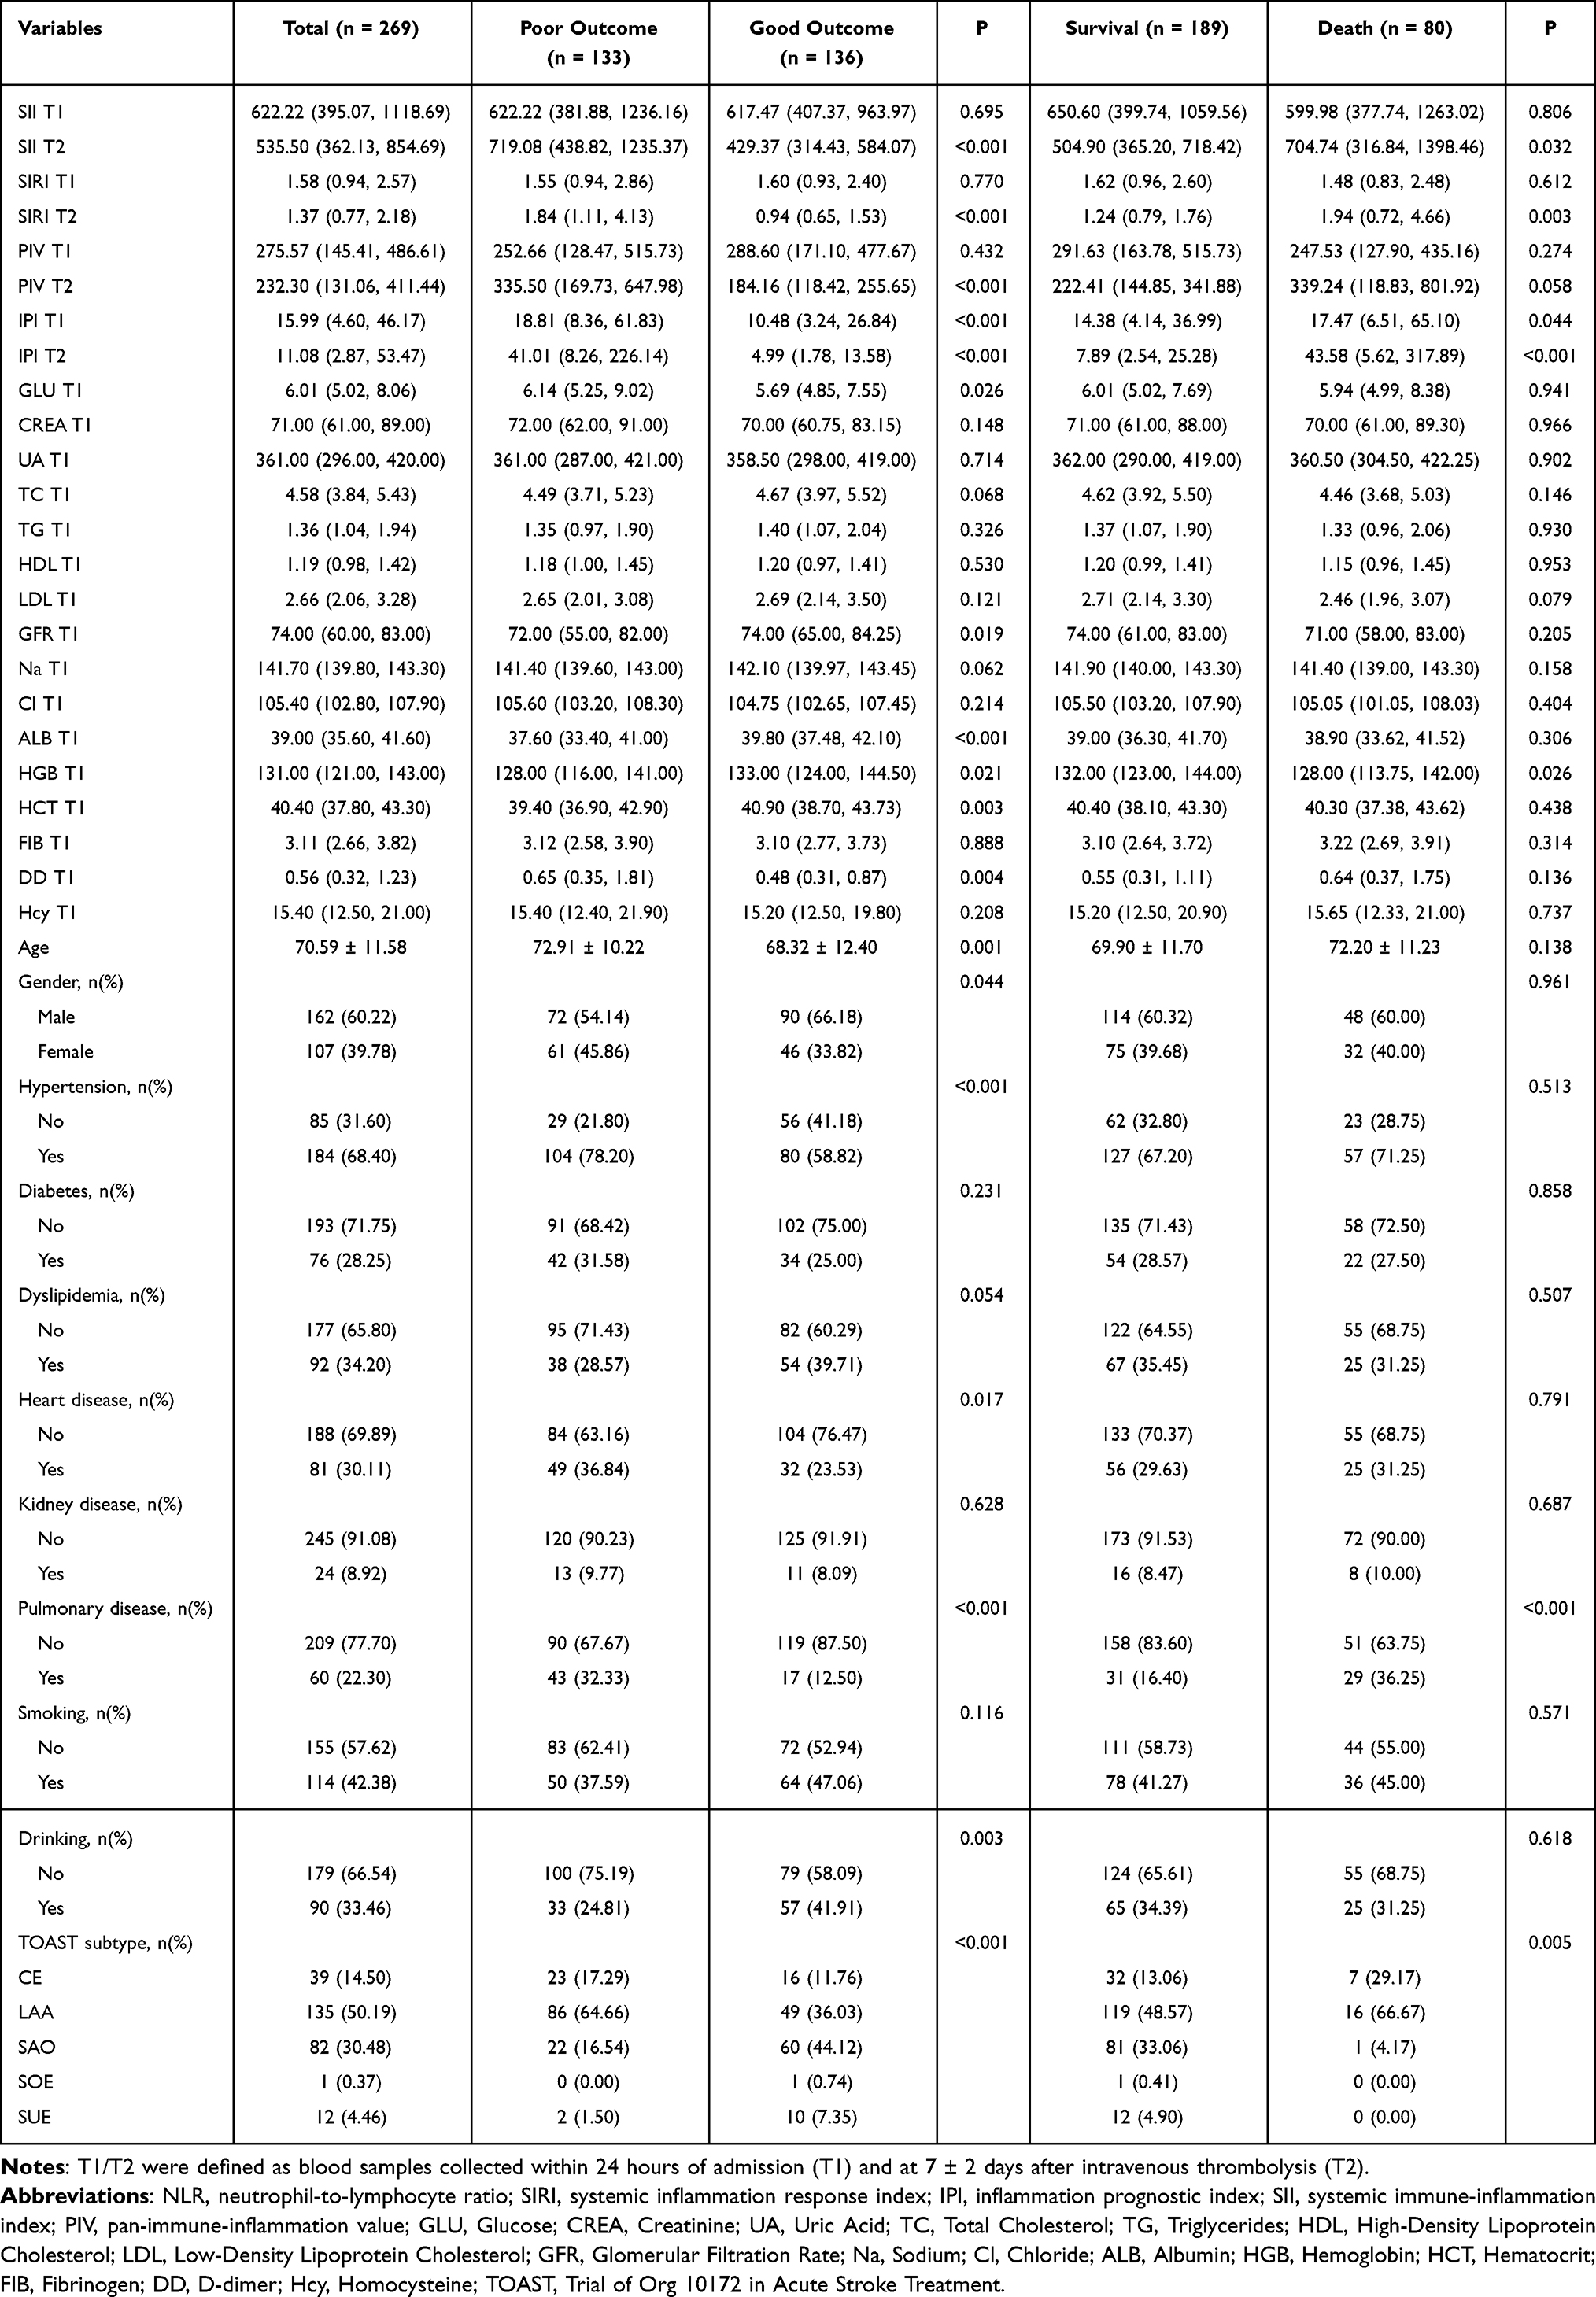 |
Table 1 Comparison of Clinical Characteristics Between Good and Poor Outcomes (or Survival and Death) |
The overall dynamic changes of inflammatory composite indices (SII, SIRI, PIV, and IPI) from T1 to T2 are shown in Figure 2. Except for IPI, all four indices demonstrated significant reductions between T1 and T2 at the population level. When stratified by 3-month functional outcomes or survival status, significant differences in the magnitude and distribution of changes were observed between groups. Patients with unfavorable outcomes or death exhibited a general upward trend, whereas those with favorable outcomes or survival showed a downward trend (Figures 3 and 4).
 |
Figure 2 Dynamic changes in composite inflammatory indices from T1 to T2. (a) SII; (b) SIRI; (c) PIV; (d) IPI. P values from the Wilcoxon signed-rank test. Abbreviations: SII, systemic immune-inflammation index; SIRI, systemic inflammation response index; PIV, pan-immune-inflammation value; IPI, inflammation prognostic index; T1, within 24 h of admission; T2, day 7 after IVT. |
 |
Figure 3 T1–T2 changes in inflammatory indices by 3-month functional outcome (good vs poor). (a) SII; (b) SIRI; (c) PIV; (d) IPI. P values from the Wilcoxon signed-rank test. Abbreviations: SII, systemic immune-inflammation index; SIRI, systemic inflammation response index; PIV, pan-immune-inflammation value; IPI, inflammation prognostic index; T1, within 24 h of admission; T2, day 7 after IVT. |
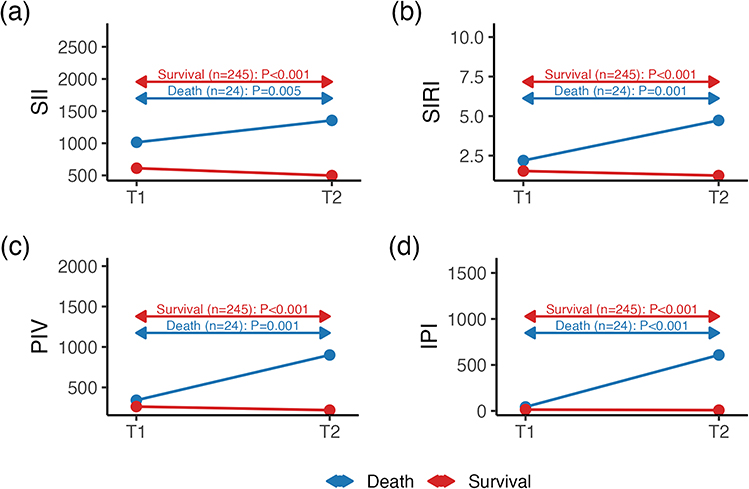 |
Figure 4 T1–T2 changes in inflammatory indices by 3-month survival (survivors vs non-survivors). (a) SII; (b) SIRI; (c) PIV; (d) IPI. P values from the Wilcoxon signed-rank test. Abbreviations: SII, systemic immune-inflammation index; SIRI, systemic inflammation response index; PIV, pan-immune-inflammation value; IPI, inflammation prognostic index; T1, within 24 h of admission; T2, day 7 after IVT. |
Assessment of Dynamic Changes in Inflammatory Indices (Figures 5–8)
To evaluate the dynamic changes of inflammatory indices, we calculated the percentage change between T1 and T2 (c1–2 = T1→T2) for each index (IPI, PIV, SII, and SIRI). Box plots were generated to visualize the distribution of percentage changes, with means indicated by white squares, medians by central lines, and interquartile ranges (IQRs) by boxes. Comparisons were performed across the overall cohort and further stratified by 3-month functional outcome (good vs poor) and survival status (survivors vs non-survivors). Between-group differences were assessed using the Wilcoxon rank-sum test.
 |
Figure 5 Percentage changes in IPI from T1 to T2: (a) Overall distribution; (b) stratified by 3-month functional outcome (good vs poor); (c) stratified by 3-month survival (survivors vs deaths). White squares = means, boxes = interquartile ranges(IQRs), central lines = medians. P values from Wilcoxon rank-sum test; c1–2 denotes T1→T2. Abbreviations: IPI, inflammation prognostic index; IQR, interquartile range; T1, within 24 h of admission; T2, day 7 after IVT. |
 |
Figure 6 Percentage changes in PIV from T1 to T2: (a) overall; (b) by 3-month functional outcome; (c) by 3-month survival. White squares = means, boxes = IQRs, central lines = medians. P values from Wilcoxon rank-sum test; c1–2 denotes T1→T2. Abbreviations: PIV, pan-immune-inflammation value; IQR, interquartile range; T1, within 24 h of admission; T2, day 7 after IVT. |
 |
Figure 7 Percentage changes in SII from T1 to T2: (a) overall; (b) by 3-month functional outcome; (c) by 3-month survival. White squares = means, boxes = IQRs, central lines = medians. P values from Wilcoxon rank-sum test; c1–2 denotes T1→T2. Poor outcome and death groups showed greater changes than controls. Abbreviations: SII, systemic immune-inflammation index; IQR, interquartile range; T1, within 24 h of admission; T2, day 7 after IVT. |
 |
Figure 8 Percentage changes in SIRI from T1 to T2: (a) overall; (b) by 3-month functional outcome; (c) by 3-month survival. White squares = means, boxes = IQRs, central lines = medians. P values from Wilcoxon rank-sum test; c1–2 denotes T1→T2. Abbreviations: SIRI, systemic inflammation response index; IQR, interquartile range; T1, within 24 h of admission; T2, day 7 after IVT. |
Univariate Logistic Regression Analysis (Table 2)
When mortality was used as the outcome, all four indices at T2 and their percentage changes (FC) were significantly associated with risk of death, whereas indices at T1 showed no significant associations except for IPI. Similar findings were observed when unfavorable outcome was used as the endpoint, with all four indices at T2 and their FC values emerging as significant risk factors. Among baseline characteristics, pulmonary disease was positively associated with mortality (OR = 2.90, P < 0.001), while serum sodium (Na) (OR = 0.90, P = 0.020) and hemoglobin (HGB) (OR = 0.98, P = 0.005) were protective. For unfavorable functional outcome, older age (OR = 1.04, P = 0.001) and female sex (OR = 1.66, P = 0.044) were associated with increased risk. Hypertension, cardiac disease, and pulmonary disease also conferred significantly higher risk. Regarding laboratory indices, higher glucose at T1 (GLU, OR = 1.09, P = 0.019), creatinine at T1 (CREA, OR = 1.01, P = 0.016), and homocysteine at T1 (Hcy, OR = 1.05, P = 0.013) were significant risk factors, whereas lower LDL cholesterol at T1 (LDL, OR = 0.75, P = 0.043), estimated glomerular filtration rate at T1 (GFR, OR = 0.98, P = 0.005), albumin at T1 (ALB, OR = 0.89, P < 0.001), and hemoglobin at T1 (HGB, OR = 0.98, P = 0.017) were protective factors.
 |
Table 2 Univariate Logistic Regression Analysis of Inflammatory Indices and Baseline Variables for Predicting 3-month Outcomes and Mortality |
Multivariable Logistic Regression Analysis (Table 3)
In multivariable logistic regression, IPI (aOR = 3.55), PIV (aOR = 3.46), SII (aOR = 7.23), SIRI (aOR = 5.72) at day 7 after IVT, as well as their dynamic percentage changes (aOR = 3.94–12.29), were identified as independent predictors of 3-month unfavorable outcomes. Further analysis showed that IPI (aOR = 2.03), SIRI (aOR = 2.32) at day 7 and their dynamic changes (IPI, PIV, SIRI; aOR = 1.86–2.80) independently predicted mortality (Table 3). After additional adjustment for age, sex, and baseline NIHSS score, the association between SII and mortality was attenuated and did not reach statistical significance (P = 0.072), suggesting that its predictive value for mortality may be partly influenced by stroke severity and related factors.
 |
Table 3 Multivariable Logistic Regression Analysis of Inflammatory Indices for Predicting 3-Month Unfavorable Outcomes and Mortality (Adjusted for Age, Sex, and Baseline NIHSS Score) |
ROC Curve Analysis (Figures 9–16)
ROC curve analysis showed that the four composite inflammatory indices at T2 and their relative changes (FC) demonstrated moderate discriminative performance, with all AUC values exceeding 0.6 (P < 0.001), indicating their ability to distinguish 3-month unfavorable outcomes and mortality. In contrast, baseline levels at T1 exhibited limited discriminative capacity. After adjustment for age, sex, and NIHSS score, the AUC values of all indices increased, with IPI and SIRI at T2 and their FC values showing the strongest performance.
 |
Figure 9 ROC curves of IPI for 3-month poor outcome. (a) Unadjusted mo (b) Adjusted model (age, sex and baseline NIHSS). Curves: logT1, logT2, logFC; Legends show AUC with 95% CI. Abbreviations: ROC, receiver operating characteristic; AUC, area under the curve; CI, confidence interval; IPI, inflammation prognostic index. |
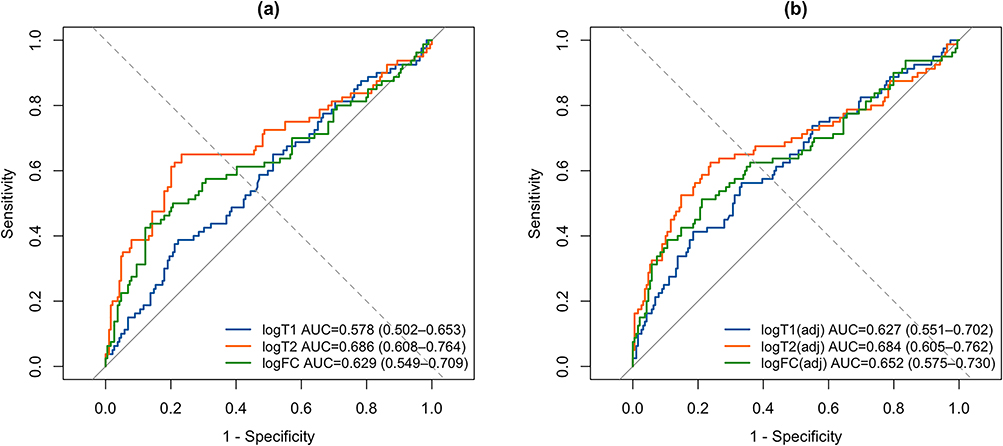 |
Figure 10 ROC curves of IPI for mortality (a) Unadjusted; (b) Adjusted. Curves: logT1, logT2, logFC; AUC with 95% CI. Abbreviations: ROC, receiver operating characteristic; AUC, area under the curve; CI, confidence interval; IPI, inflammation prognostic index. |
 |
Figure 11 ROC curves of PIV for 3-month poor outcome. (a) Unadjusted; (b) Adjusted. Curves: logT1, logT2, logFC; AUC with 95% CI. Abbreviations: PIV, pan-immune-inflammation value; ROC, receiver operating characteristic; AUC, area under the curve; CI, confidence interval; IPI, inflammation prognostic index. |
 |
Figure 12 ROC curves of PIV for mortality; (a) Unadjusted; (b) Adjusted. Curves: logT1, logT2, logFC; AUC with 95% CI. Abbreviations: PIV, pan-immune-inflammation value; ROC, receiver operating characteristic; AUC, area under the curve; CI, confidence interval; IPI, inflammation prognostic index. |
 |
Figure 13 ROC curves of SII for 3-month poor outcome; (a) Unadjusted; (b) Adjusted. Curves: logT1, logT2, logFC; AUC with 95% CI. Abbreviations: SII, systemic immune-inflammation index; ROC, receiver operating characteristic; AUC, area under the curve; CI, confidence interval; IPI, inflammation prognostic index. |
 |
Figure 14 ROC curves of SII for mortality; (a) Unadjusted; (b) Adjusted. Curves: logT1, logT2, logFC; AUC with 95% CI. Abbreviations: SII, systemic immune-inflammation index; ROC, receiver operating characteristic; AUC, area under the curve; CI, confidence interval; IPI, inflammation prognostic index. |
 |
Figure 15 ROC curves of SIRI for 3-month poor outcome; (a) Unadjusted; (b) Adjusted. Curves: logT1, logT2, logFC; AUC with 95% CI. Abbreviations: SIRI, systemic inflammation response index; ROC, receiver operating characteristic; AUC, area under the curve; CI, confidence interval; IPI, inflammation prognostic index. |
 |
Figure 16 ROC curves of SIRI for mortality; (a) Unadjusted; (b) Adjusted. Curves: logT1, logT2, logFC; AUC with 95% CI. Abbreviations: SIRI, systemic inflammation response index; ROC, receiver operating characteristic; AUC, area under the curve; CI, confidence interval; IPI, inflammation prognostic index. |
Discussion
This study evaluated the dynamic changes of composite inflammatory indices (SII, SIRI, PIV, and IPI) in patients with acute ischemic stroke (AIS) undergoing intravenous thrombolysis and assessed their prognostic value for 3-month outcomes. We demonstrated that indices measured at day 7 (T2) and their relative changes (FC) provided stronger discrimination than baseline values (T1). Notably, IPI, SIRI, and PIV remained independent predictors in multivariable models, while the predictive value of SII for mortality was only marginally significant. These findings suggest that the persistence and trajectory of inflammatory activity may better reflect disease burden and prognostic risk than single admission measurements.
Consistent with earlier reports, we observed that patients with unfavorable outcomes or death exhibited marked increases in inflammatory indices at T2, whereas these indices declined in those with favorable outcomes. This pattern highlights the adverse impact of sustained inflammation on neurological recovery and supports the importance of dynamic monitoring rather than reliance on baseline levels alone.
ROC curve analyses confirmed the clinical relevance of these markers, with all four indices at T2 and their FC values yielding AUCs >0.6 (P < 0.001), indicating moderate discriminative ability. After adjustment for age, sex, and NIHSS, predictive accuracy improved further, particularly for IPI and SIRI. Nonetheless, overall AUC values did not reach levels considered excellent, and certain associations (eg, SII logFC with mortality) were only marginally significant. These findings imply that composite inflammatory indices may serve best as adjunctive biomarkers to complement established prognostic factors, rather than as stand-alone determinants of clinical decision-making.
Traditional risk factors, including age, sex, hypertension, cardiac and pulmonary disease, as well as laboratory indices such as serum sodium, hemoglobin, albumin, and renal function, were also closely related to outcomes in our cohort. This emphasizes the multifactorial nature of stroke prognosis and the necessity of integrated predictive models. Future research should focus on combining inflammatory indices with conventional clinical and laboratory parameters to enhance predictive accuracy and clinical applicability.
Studies have demonstrated that inflammatory mechanisms are closely associated with acute ischemic stroke (AIS), and elevated levels of inflammatory mediators are linked to both early and late neurological deterioration.13 The initial ischemic event triggers oxidative stress and excitotoxicity, which in turn activate microglia and astrocytes.14 Concurrently, disruption of the blood–brain barrier (BBB) and aggravation of cerebral edema occur, with neutrophils being the earliest cells recruited to the infarct core and penumbra.15 Neutrophils contribute to BBB breakdown either by releasing matrix metalloproteinase-9 (MMP-9) to degrade tight junction proteins or by internalizing into endothelial cells and affecting the basement membrane.16 Both mechanisms increase the risk of hemorrhagic transformation (HT) following thrombolysis in AIS patients.17 Monocyte counts peak around day 3 after stroke and subsequently differentiate into inflammatory macrophages (MDMs).18 During ischemia, dying neurons release damage-associated molecular patterns (DAMPs), such as ATP, HMGB1, DNA fragments, and peroxiredoxins, which are recognized by pattern recognition receptors (PRRs) and amplify inflammatory responses.19 Platelets, among the earliest recruited cells, play a critical role in inflammation and infection; by promoting microcirculatory dysfunction, increasing vascular permeability, and undergoing activation and aggregation, they further amplify inflammatory cascades.20 Experimental studies have also shown that lymphocytes coordinate inflammatory responses.21 The differentiation patterns of CD4⁺ T cells after brain injury largely determine stroke outcomes, with Th1-derived IFN-γ reported to worsen prognosis and enlarge infarct volume.22,23
In addition, several studies have reported that high-sensitivity C-reactive protein (hs-CRP), secreted rapidly by the liver under stimulation of IL-1, IL-6, and TNF-α, can activate NF-κB and AP-1 signaling pathways, thereby upregulating the expression of endothelial adhesion molecules such as ICAM-1 and VCAM-1. This promotes leukocyte adhesion and amplifies inflammatory cascades. Upregulation of ICAM-1 and VCAM-1 has also been shown to be closely associated with BBB disruption. Clinical studies further demonstrated that hs-CRP is an independent prognostic factor for 3-month functional outcomes in AIS patients, underscoring its pivotal role in the early inflammatory response following stroke.24–26
Previous studies have reported predictive value for NLR and PLR in AIS patients receiving rt-PA,27 and SIRI, IPI, and SII have been linked to cardiovascular and oncologic outcomes.28–30 More recently, PIV has emerged as a prognostic marker in myocardial infarction. However,31 data linking PIV, IPI, SII, and SIRI to ischemic stroke—particularly in relation to their dynamic changes—remain limited. Our results extend current knowledge by demonstrating that both absolute levels at day 7 and relative increases in these indices are strongly associated with poor functional outcomes and mortality after thrombolysis.
The main strength of this study lies in its focus on dynamic rather than static inflammatory markers and the comparative evaluation of multiple indices within the same cohort. These features improve generalizability and offer novel insights into the temporal dimension of inflammatory responses. Several limitations should also be noted. First, the retrospective design introduces inevitable selection bias and residual confounding. Second, the sample size was relatively small, potentially reducing the power of subgroup analyses. Third, some potential confounders, such as intercurrent infections and medication effects, could not be fully controlled. Fourth, patients undergoing bridging therapy (IVT+MT) generally had more severe strokes, which may have influenced the associations observed between inflammatory markers and outcomes. Future prospective, multicenter studies with larger populations are needed to validate these findings and to determine whether incorporating these markers into risk scores can meaningfully improve prognostic accuracy.
Conclusion
This retrospective study demonstrated that early inflammatory responses in AIS patients undergoing intravenous thrombolysis exhibited significant dynamic changes. In particular, the levels of IPI, SIRI, SII, and PIV at day 7 and their relative changes were significantly associated with 90-day functional outcomes and mortality. These composite inflammatory indices, derived from routine hematological parameters, reflect the inflammatory burden after stroke and may provide auxiliary information for short-term prognostic assessment. Given their simplicity, low cost, and reproducibility, they warrant further attention as potential adjunctive tools. However, due to the retrospective design of this study, these findings should be interpreted with caution and require validation in large-scale, prospective, multicenter studies, including exploration of their combined application with imaging and molecular biomarkers.
Data Sharing Statement
The datasets generated and analyzed during the current study are available from the corresponding author on reasonable request. Data are de-identified and stored securely in accordance with institutional policies to protect participant privacy.
Ethics Approval and Informed Consent
This retrospective study was approved by the Ethics Committee of Leshan People’s Hospital (Approval No. LYLL [2024] KY 079). Written informed consent was obtained from all participants or their legal guardians prior to data collection and analysis (Given that some patients were somnolent or in a comatose state upon hospital admission, informed consent was obtained from their legally authorized representatives, including spouses or adult children). The study was conducted in accordance with the ethical standards of the institutional research committee and the principles of the Declaration of Helsinki. All personal information was anonymized and de-identified to ensure confidentiality.
Funding
This study was supported by the 2024 Youth Research Project of the Sichuan Provincial Medical Science and Technology Innovation Research Association (Project No.: YCH-KY-YCWL2024-006) and the Leshan Municipal Science and Technology Plan Project (Project No.: 24ZDYF0057). The authors express their sincere gratitude for the financial support and academic assistance provided by these projects, which played a crucial role in the successful implementation of the study and the achievement of interim research outcomes.
Disclosure
Weijun Wang and Huiying Huang are co-first authors for this study. The authors declare that they have no conflicts of interest in relation to this work.
References
1. Li X, Kong X, Yang C, et al. Global, regional, and national burden of ischemic stroke, 1990–2021: an analysis of data from the global burden of disease study 2021. EClinicalMedicine. 2024;75:102758. doi:10.1016/j.eclinm.2024.102758
2. Feigin VL, Stark BA, Johnson CO; Collaborators GS. Global, regional, and national burden of stroke and its risk factors, 1990–2019: a systematic analysis for the global burden of disease study 2019. Lancet Neurol. 2021;20(10):795. doi:10.1016/S1474-4422(21)00252-0
3. Tu W, Zhao Z, Yin P, et al. Estimated burden of stroke in China in 2020. JAMA Network Open. 2023;6(3):e231455. doi:10.1001/jamanetworkopen.2023.1455
4. Heran M, Lindsay P, Gubitz G, et al. Canadian stroke best practice recommendations: acute stroke management, practice guidelines update, 2022. Can J Neurol Sci. 2024;51(1):1–31. doi:10.1017/cjn.2022.344
5. Huang P, Yi X. Risk factors and a model for prognosis prediction after intravenous thrombolysis with alteplase in acute ischemic stroke based on propensity score matching. Int J Immunopathol Pharmacol. 2024;38:1210494327. doi:10.1177/03946320241274231
6. Endres M, Moro MA, Nolte CH, et al. Immune pathways in etiology, acute phase, and chronic sequelae of ischemic stroke. Circ Res. 2022;130(8):1167–1186. doi:10.1161/CIRCRESAHA.121.319994
7. Zhang YX, Shen ZY, Jia YC, et al. The association of the neutrophil-to-lymphocyte ratio, platelet-to-lymphocyte ratio, lymphocyte-to-monocyte ratio and systemic inflammation response index with short-term functional outcome in patients with acute ischemic stroke. J Inflamm Res. 2023;Volume 16:3619–3630. doi:10.2147/JIR.S418106
8. Ma F, Li L, Xu L, et al. The relationship between systemic inflammation index, systemic immune-inflammatory index, and inflammatory prognostic index and 90-day outcomes in acute ischemic stroke patients treated with intravenous thrombolysis. J Neuroinflammation. 2023;20(1):220. doi:10.1186/s12974-023-02890-y
9. Weng Y, Zeng T, Huang H, et al. Systemic immune-inflammation index predicts 3-month functional outcome in acute ischemic stroke patients treated with intravenous thrombolysis. Clin Interv Aging. 2021;Volume 16:877–886. doi:10.2147/CIA.S311047
10. Gong P, Liu Y, Gong Y, et al. The association of neutrophil to lymphocyte ratio, platelet to lymphocyte ratio, and lymphocyte to monocyte ratio with post-thrombolysis early neurological outcomes in patients with acute ischemic stroke. J Neuroinflammation. 2021;18(1):51. doi:10.1186/s12974-021-02090-6
11. Si L, Chen X, Ouyang M, et al. Cost-effectiveness of low-dose compared to standard-dose alteplase for acute ischemic stroke in China: a within-trial economic evaluation of the ENCHANTED study. Cerebrovasc Dis. 2023;52(2):145–152. doi:10.1159/000525869
12. Wu Q, Chen HS. Neutrophil‐to‐lymphocyte ratio and its changes predict the 3‐month outcome and mortality in acute ischemic stroke patients after intravenous thrombolysis. Brain Behav. 2023;13(9):e3162. doi:10.1002/brb3.3162
13. Couch C, Mallah K, Borucki DM, et al. State of the science in inflammation and stroke recovery: a systematic review. Ann Phys Rehabil Med. 2022;65(2):101546. doi:10.1016/j.rehab.2021.101546
14. Jayaraj RL, Azimullah S, Beiram R, et al. Neuroinflammation: friend and foe for ischemic stroke. J Neuroinflammation. 2019;16(1):142. doi:10.1186/s12974-019-1516-2
15. Iadecola C, Anrather J. The immunology of stroke: from mechanisms to translation. Nat Med. 2011;17(7):796–808. doi:10.1038/nm.2399
16. Jickling GC, Liu D, Stamova B, et al. Hemorrhagic transformation after ischemic stroke in animals and humans. J Cereb Blood Flow Metab. 2014;34(2):185–199. doi:10.1038/jcbfm.2013.203
17. Gautier S, Ouk T, Petrault O, et al. Neutrophils contribute to intracerebral haemorrhages after treatment with recombinant tissue plasminogen activator following cerebral ischaemia. Br J Pharmacol. 2009;156(4):673–679. doi:10.1111/j.1476-5381.2009.00068.x
18. Fang W, Zhai X, Han D, et al. CCR2-dependent monocytes/macrophages exacerbate acute brain injury but promote functional recovery after ischemic stroke in mice. Theranostics. 2018;8(13):3530. doi:10.7150/thno.24475
19. Shichita T, Ago T, Kamouchi M, et al. Novel therapeutic strategies targeting innate immune responses and early inflammation after stroke. J Neurochem. 2012;123(s2):29–38. doi:10.1111/j.1471-4159.2012.07941.x
20. Islam MM, Satici MO, Eroglu SE. Unraveling the clinical significance and prognostic value of the neutrophil-to-lymphocyte ratio, platelet-to-lymphocyte ratio, systemic immune-inflammation index, systemic inflammation response index, and delta neutrophil index: an extensive literature review. Turk J Emerg Med. 2024;24(1):8–19. doi:10.4103/tjem.tjem_198_23
21. Jander S, Kraemer M, Schroeter M, et al. Lymphocytic infiltration and expression of intercellular adhesion molecule-1 in photochemically induced ischemia of the rat cortex. J Cereb Blood Flow Metab. 1995;15(1):42–51. doi:10.1038/jcbfm.1995.5
22. Yilmaz G, Arumugam TV, Stokes KY, et al. Role of T lymphocytes and interferon-γ in ischemic stroke. Circulation. 2006;113(17):2105–2112. doi:10.1161/CIRCULATIONAHA.105.593046
23. Shichita T, Sugiyama Y, Ooboshi H, et al. Pivotal role of cerebral interleukin-17–producing γδT cells in the delayed phase of ischemic brain injury. Nat Med. 2009;15(8):946–950. doi:10.1038/nm.1999
24. Rakhimbaeva GS, Kizi Abdurakhmonova KB. ICAM-1 and CRP as biomarkers of 3-month outcome in acute ischaemic stroke. BMJ Neurol Open. 2023;5(2):e516. doi:10.1136/bmjno-2023-000516
25. Liang Y, Chen J, Chen Y, et al. Advances in the detection of biomarkers for ischemic stroke. Front Neurol. 2025;16:1488726. doi:10.3389/fneur.2025.1488726
26. Kaur P, Ritu, Sharma K, et al. Unveiling VCAM‐1’s multifaceted role in secondary diabetic complications. J Food Qual. 2025;2025(1):9206712. doi:10.1155/jfq/9206712
27. Han Z, Hong C, Lang Y. The expression of peripheral blood inflammatory factors in patients with acute ischemic stroke and its correlation with patients’ prognosis. Cell Mol Biol (Noisy-le-Grand). 2023;69(15):84–88. doi:10.14715/cmb/2023.69.15.14
28. Zhou Z, Sehn LH, Rademaker AW, et al. An enhanced international prognostic index (NCCN-IPI) for patients with diffuse large B-cell lymphoma treated in the rituximab era. Blood J Am Soc Hematol. 2014;123(6):837–842.
29. Hirahara N, Tajima Y, Matsubara T, et al. Systemic immune-inflammation index predicts overall survival in patients with gastric cancer: a propensity score–matched analysis. J Gastrointest Surg. 2021;25(5):1124–1133. doi:10.1007/s11605-020-04710-7
30. Dziedzic EA, Gąsior JS, Tuzimek A, et al. Investigation of the associations of novel inflammatory biomarkers—systemic inflammatory index (SII) and systemic inflammatory response index (SIRI)—with the severity of coronary artery disease and acute coronary syndrome occurrence. Int J Mol Sci. 2022;23(17):9553. doi:10.3390/ijms23179553
31. Murat B, Murat S, Ozgeyik M, et al. Comparison of pan-immune-inflammation value with other inflammation markers of long-term survival after ST -segment elevation myocardial infarction. Eur J Clin Invest. 2023;53(1):e13872. doi:10.1111/eci.13872
 © 2025 The Author(s). This work is published and licensed by Dove Medical Press Limited. The
full terms of this license are available at https://www.dovepress.com/terms
and incorporate the Creative Commons Attribution
- Non Commercial (unported, 4.0) License.
By accessing the work you hereby accept the Terms. Non-commercial uses of the work are permitted
without any further permission from Dove Medical Press Limited, provided the work is properly
attributed. For permission for commercial use of this work, please see paragraphs 4.2 and 5 of our Terms.
© 2025 The Author(s). This work is published and licensed by Dove Medical Press Limited. The
full terms of this license are available at https://www.dovepress.com/terms
and incorporate the Creative Commons Attribution
- Non Commercial (unported, 4.0) License.
By accessing the work you hereby accept the Terms. Non-commercial uses of the work are permitted
without any further permission from Dove Medical Press Limited, provided the work is properly
attributed. For permission for commercial use of this work, please see paragraphs 4.2 and 5 of our Terms.