")
Back to Journals » Clinical Interventions in Aging » Volume 18
Association of Regional Muscle Thickness and Echo Intensity with Muscle Volume, Intramuscular Adipose Tissue, and Strength of the Quadriceps Femoris
Authors Fukumoto Y , Taniguchi M, Hirono T, Yagi M, Yamagata M, Nakai R, Yamada Y, Kimura M, Ichihashi N
Received 5 June 2023
Accepted for publication 5 September 2023
Published 13 September 2023 Volume 2023:18 Pages 1513—1521
DOI https://doi.org/10.2147/CIA.S424504
Checked for plagiarism Yes
Review by Single anonymous peer review
Peer reviewer comments 2
Editor who approved publication: Prof. Dr. Nandu Goswami
Yoshihiro Fukumoto,1,2 Masashi Taniguchi,2 Tetsuya Hirono,2 Masahide Yagi,2 Momoko Yamagata,1,2 Ryusuke Nakai,3 Yosuke Yamada,4 Misaka Kimura,5 Noriaki Ichihashi2
1Faculty of Rehabilitation, Kansai Medical University, Hirakata, Japan; 2Human Health Sciences, Graduate School of Medicine, Kyoto University, Kyoto, Japan; 3Kyoto University Institute for the Future of Human Society, Kyoto, Japan; 4National Institute of Health and Nutrition, National Institutes of Biomedical Innovation, Health, and Nutrition, Tokyo, Japan; 5Institute for Active Health, Kyoto University of Advanced Science, Kameoka, Japan
Correspondence: Yoshihiro Fukumoto, Faculty of Rehabilitation, Kansai Medical University, 18– 89 Uyamahigashicho, Hirakata City, Osaka, 573-1136, Japan, Tel +81-72-856-2307, Fax +81-72-856-2150, Email [email protected]
Purpose: This study aimed to investigate the association of muscle thickness (MT) and echo intensity (EI) obtained at different regions along the muscle length with muscle volume (MV), intramuscular adipose tissue (IntraMAT), and muscle strength of the quadriceps femoris (QF).
Patients and Methods: A total of 135 community-dwelling adults (64 men and 71 women) participated in the study. Ultrasound scanning of the rectus femoris (RF) and vastus intermedius (VI) was performed at three locations (from mid- to distal thigh). The MT of the RF and VI and EI of the RF were measured. MRI-derived MV, IntraMAT, and muscle strength of the QF were measured.
Results: The correlation between RF-MT and RF-MV weakened as scanning approached the distal thigh, and the difference between the coefficients for the scanning locations was significant for women. However, the correlation of VI-MT with VI-MV and that of the combined MT of RF and VI with the MV of the whole QF and muscle strength were comparable among the scanning locations for both sexes. The correlation of RF-EI with the IntraMAT of the RF and the whole QF and muscle strength was also comparable among the scanning locations for both sexes.
Conclusion: The results of this study suggest that ultrasound measurements at the distal thigh can predict MV, IntraMAT, and muscle strength of the QF to the same degree as those at the mid-thigh.
Keywords: ultrasound scanning, rectus femoris, thigh, muscle strength, MRI
Introduction
Sarcopenia, characterized by an age-related decline in muscle mass, strength, and physical performance, is a serious health problem in the aging population. Loss of muscle mass with aging is muscle-specific, with greater loss in the quadriceps femoris (QF) than in other muscles.1,2 Additionally, the cross-sectional area (CSA) and muscle thickness (MT) of the QF show better correlation with physical functions (such as walking speed) than with the total muscle mass of limbs.3,4 Thus, assessing QF mass is essential in older adults for the early detection of muscle-specific sarcopenia and decline in physical performance.
Ultrasound (US) is a widely available, portable, and non-invasive technique that can be used to promptly assess MT in clinical settings or communities. US can also assess echo intensity (EI) as a surrogate measure of muscle quality, including non-contractile parameters such as intramuscular adipose tissues (IntraMAT). The rectus femoris (RF) and underlying vastus intermedius (VI) have been studied using US, and the MT and EI of these muscles are reportedly associated with various clinical outcomes such as muscle strength,5–7 power,7 physical7–9 and cardiovascular performance,6 physical activity,8,10 frailty,9,11 and nutritional status.12
These muscles are generally scanned at the mid-thigh – at a distance 50% between the anterior superior iliac spine and proximal border of the patella – or at the anterior aspect at a distance 50% between the greater trochanter and lateral condyle, as this location is the thickest zone of the RF or QF.13 Using the thickest region seems logical for estimating muscle size and contractile force.13 However, the mid-thigh is not easy to expose; thus, participants should remove their trousers during scanning. This is a shortcoming when US is used as a screening tool in busy clinical settings or for large-scale medical examinations in communities. Scanning at the distal thigh can overcome this shortcoming as this region can be easily exposed with the participant wearing short pants or wide trousers. The distal QF has occasionally been used to measure MT and EI.13 However, it is unclear whether MT or EI at the distal QF can be used to predict muscle volume (MV) and IntraMAT. This study aimed to investigate the association of MT and EI obtained at different regions along the muscle length with the MV, IntraMAT, and muscle strength of the QF.
Materials and Methods
Participants
This study recruited older (>60 years) and younger (20–39 years) adults who lived independently in the community and walked without assistive devices. The older adults were recruited from among those who participated in a physical fitness test conducted in Kyoto, and the young adults were recruited from among the students, graduates, and staff members of Kyoto University.14 Exclusion criteria were as follows: cognitive impairments, severe neurological or musculoskeletal disorders, and general contraindications for MRI. Between April and September 2019, 92 older adults (42 men and 50 women) with a mean age, height, and body mass of 75.3 ± 6.7 years, 158.5 ± 9.1 cm, and 54.3 ± 9.1 kg, respectively, and 43 young adults (22 men and 21 women) with a mean age, height, and body mass of 26.1 ± 4.7 years, 165.5 ± 6.6 cm, and 57.8 ± 7.7 kg, respectively, participated in this study. Written informed consent was obtained from all participants before examination. The study protocol was approved by the ethics committee of Kyoto University (approval no. R1746).
Data Collection
US images of the QF of the right thigh were obtained using real-time B-mode ultrasonography (LOGIQ e, GE Healthcare UK, Chalfont, Buckinghamshire, UK) with an 8–12 MHz linear-array probe. Participants were placed in a supine and completely relaxed position. Transverse images were obtained using the following equipment settings: frequency of 8 MHz, gain of 58 dB, and time-gain compensation in the neutral position. Three scanning locations were determined along the muscle length: 1) proximal: 50% between the anterior superior iliac spine and the proximal border of the patella; 2) middle: the anterior aspect of 50% between the greater trochanter and lateral condyle; and 3) distal: 75% between the anterior superior iliac spine and proximal border of the patella. The scanning locations are shown in Figure 1. At each location, the probe was placed on the part of the RF with the largest diameter, and the focus depth (one focus point) was adjusted to the center of the RF.14 On the US image, the subcutaneous fat thickness (SFT) and MT of the RF and VI were measured, and the MT of the QF was calculated by summing the values of the RF and VI. The EI of the RF was evaluated as 256 grey-scale levels with arbitrary units using ImageJ version 1.51 (National Institutes of Health, Bethesda, MD, USA). Details of SFT, MT, and EI measurements have been previously described.5
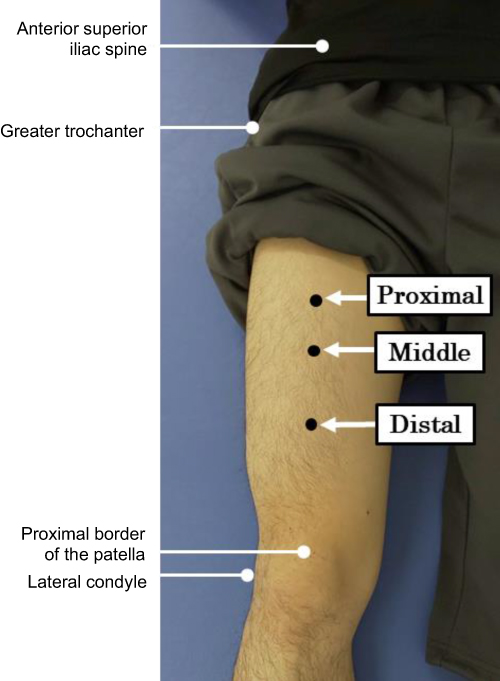 |
Figure 1 The proximal, middle, and distal locations of US scanning. Abbreviation: US, ultrasound. |
MR images of the right thigh were acquired using a 3.0-T magnetic resonance imaging (MRI) scanner (MAGNETOM Verio; Siemens AG, Germany). Participants were placed in a supine and completely relaxed position, and T1-weighted and two-point Dixon images of the entire thigh were acquired with body matrix and spine coils. T1-weighted images (T1WI) were acquired using the following sequences: TR, 2820 ms; TE, 16 ms; optimized field of view, 320 × 240 mm; flip angle, 129°; voxel size, 0.5 × 0.5 × 4.0 mm; and slice thickness, 4 mm. Two-point Dixon images were acquired using the following parameters: TR, 4.33 ms; TE1, 1.31 ms; TE2, 2.54 ms; optimized field of view, 365 × 286.4 mm; flip angle, 9°; and slice thickness, 3 mm. Water and fat images were produced from the two-point Dixon sequence based on the water/fat chemical shift difference and, consequently, on their phase difference in signal intensity.
All MR images were analyzed using OsiriX MD (version 134, 11.0; OsiriX, Geneva, Switzerland). MV was estimated on T1WI. Regions of interest in the RF, VI, vastus lateralis (VL), and vastus medialis (VM) were carefully traced on each image slice, and the CSA (cm2) was calculated. The volume (cm3) of each slice was calculated by multiplying the CSA by the slice thickness (4 mm), and the entire MV was obtained by summing the volume of each slice throughout the entire muscle length. The volumes of the four muscles were summed to obtain the total QF volume. IntraMAT was estimated using two-point Dixon imaging. Ten consecutive slices of the mid-thigh (with the fifth slice matching the same location as the proximal location on the US scan) were analyzed. Regions of interest in the RF, VI, VL, and VM were carefully traced on each image slice, and IntraMAT (%) was calculated from the signal intensities derived from the water and fat images. The mean IntraMAT of 10 slices was calculated for each muscle. The IntraMAT of the four muscles was averaged to obtain the QF IntraMAT.
Maximal isometric knee extensor strength on the right leg was measured at a 60° knee flexion using an isometric dynamometer (Isoforce GT-330; OG GIKEN Co., Okayama, Japan). Isometric strength was measured twice and presented as torque (Nm), and the maximal value was used for further analysis. The details of knee extensor strength measurement have been described previously.5
Information on comorbidities of hypertension, diabetes, and cardiovascular disease, and the number of medications being taken was acquired using a questionnaire. For older adults, handgrip strength (kg), walking speed (m/s), and skeletal muscle mass index (SMI, kg/m2) were measured. In the walking speed, the time taken to walk 10 m at their comfortable speed was measured and was converted to speed. For calculating SMI, appendicular skeletal muscle mass was estimated using a multi-frequency bioelectrical impedance analysis instrument (Body Composition Analyzer MC-780A-N; TANITA, Tokyo, Japan) and was divided by height squared. Based on the value of handgrip strength, walking speed, and SMI, the presence of sarcopenia was identified according to the criteria of the Asian Working Group for Sarcopenia (AWGS).15
Statistical Analysis
All statistical analyses were performed using SPSS for Windows version 22.0 (SPSS Inc., Tokyo, Japan). Statistical significance was set at P < 0.05. We performed statistical analysis separately for each sex, for a combined sample of younger and older adults. This was because an appropriate sample size and a wide range of values in variables was needed to obtain better statistical correlations. We assessed whether the variables were normally distributed based on histogram features, the Kolmogorov–Smirnov test, and Q-Q plots. Since knee extensor strength was positively skewed, log-transformed data were used for statistical analyses. Comparisons of MT and EI among the three measurement locations were made using repeated-measures one-way analyses of variance, followed by Bonferroni’s post hoc test. The association of MT and EI at the three measurement locations with MV, IntraMAT, and knee extensor strength was examined using Pearson’s correlation coefficient. The difference in the correlation coefficients among the three measurement locations was examined using the method reported by Meng et al16 (with Bonferroni correction, p < 0.017).
Results
Knee extensor strength was not measured in 16 participants (five men and 11 women). Thus, only data from the remaining 119 participants (59 men and 60 women) were analyzed for knee extensor strength. There were no missing data for the US and MRI measurements. For men, mean RF-MV, VI-MV, and QF-MV were 211.5 ± 53.8, 436.3 ± 99.4, and 1512.3 ± 322.7 cm3, respectively. Mean RF-IntraMAT and QF-IntraMAT were 5.21 ± 1.50% and 6.76 ± 1.44%, respectively. Mean knee extensor strength was 167.0 ± 55.3 Nm. For women, mean RF-MV, VI-MV, and QF-MV were 139.6 ± 34.0, 268.3 ± 68.9, and 961.6 ± 227.3 cm3, respectively. Mean RF-IntraMAT and QF-IntraMAT were 6.32 ± 2.07% and 7.95 ± 2.20%, respectively. Mean knee extensor strength was 104.5 ± 29.8 Nm. Characteristics of the participants for each age and sex group are shown in Table 1.
 |
Table 1 Characteristics of the Study Participants |
Differences in SFT, MT, and EI among the three measurement locations are shown in Table 2. There was a significant main effect of measurement location on the SFT for women and the MT and EI for men and women (p < 0.001). The SFT for women at the middle and distal locations was significantly less than that at the proximal location (p < 0.001) and that at the distal location was significantly less than that at the middle location (p < 0.05). For both sexes, RF-MT, VI-MT, and QF-MT at the middle and distal locations were significantly less than those at the proximal location (p < 0.001), and MT at the distal location was significantly less than that at the middle location (p < 0.001). RF-EI at the middle and distal locations was significantly higher than that at the proximal location (p < 0.001). RF-EI at the distal location was significantly higher than that at the middle location (p < 0.001).
 |
Table 2 SFT, MT, and EI at Each Measurement Location |
The correlation coefficients between MT and EI at each measurement location with MV, IntraMAT, and knee extensor strength are shown in Table 3. MT at all measurement locations was significantly positively correlated with MV and knee extensor strength for both sexes (p < 0.001). The correlation coefficient between RF-MT and RF-MV at the proximal and middle locations was significantly higher than that at the distal location for women (p < 0.001); however, there was no significant difference between those correlation coefficients in the locations for men. For both sexes, there was no significant difference in correlation coefficients between VI-MT and VI-MV and between QF-MT and QF-MV and knee extensor strength among the locations. RF-EI at all measurement locations was significantly positively correlated with RF-IntraMAT and QF-IntraMAT (p < 0.001) and significantly negatively correlated with knee extensor strength for both sexes (p < 0.05). There were no significant differences in the correlation coefficients among the locations for both sexes.
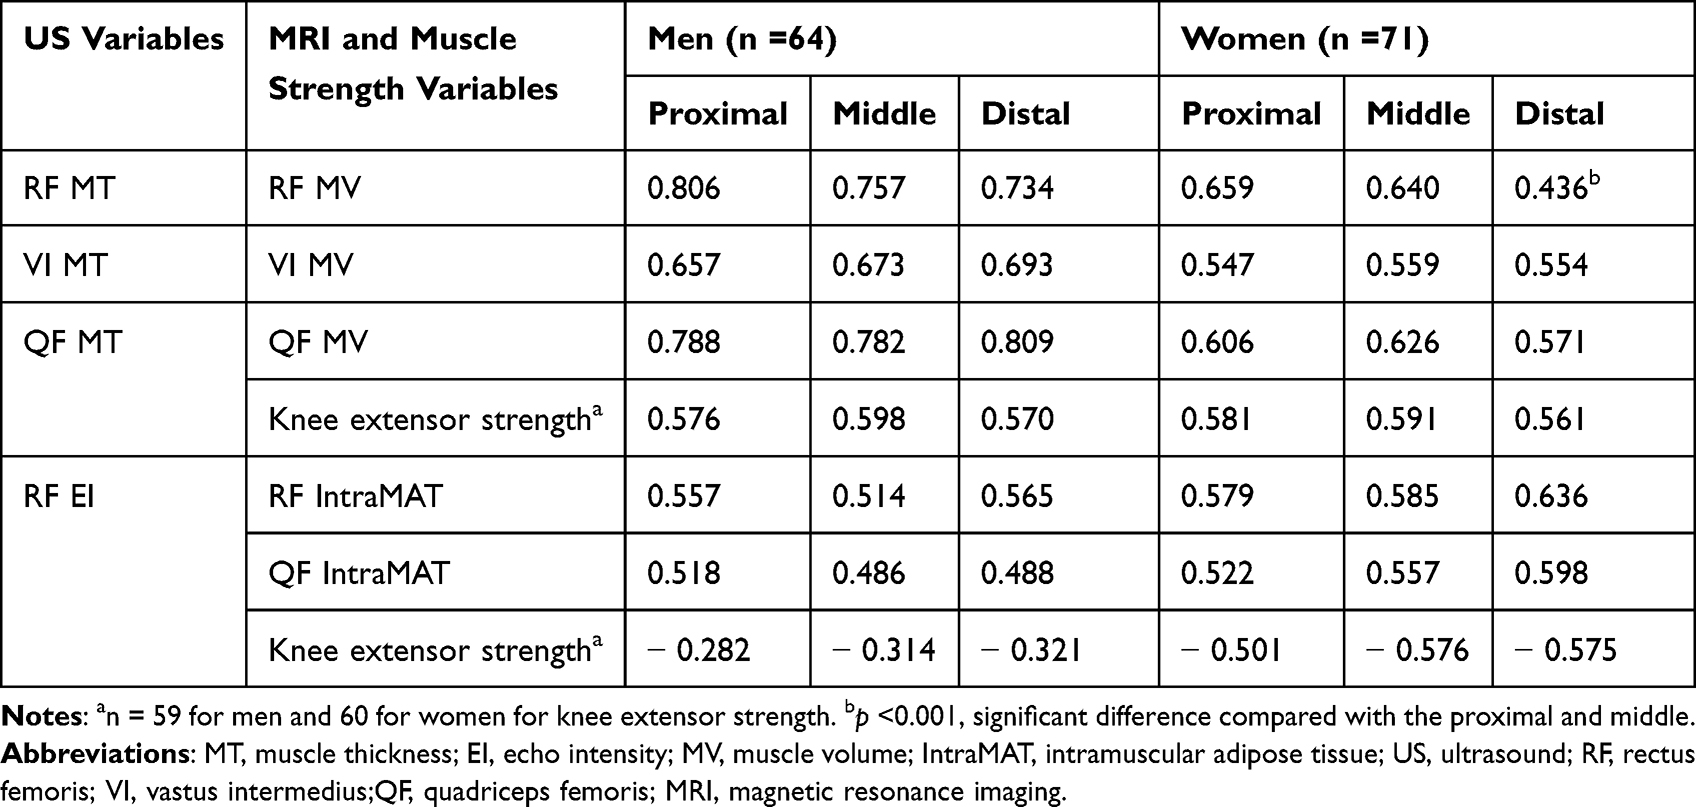 |
Table 3 Correlation Between MT and EI per Measurement Location with MV, IntraMAT, and Knee Extensor Strength |
Discussion
This study revealed that the correlation between QF-MT (combining RF and VI) and QF-MV was comparable among the three measurement locations. Age-related atrophy of the QF is observed across the entire muscle length, except for the most proximal and distal muscle-tendon insertions.1,17 Therefore, MT in every region along the muscle length may predict the MV of the entire QF. However, when the correlation between MT and MV was examined separately for the RF, the coefficient gradually weakened as scanning approached the distal thigh, and the difference in the coefficient was significant for women. Thus, RF-MT should be measured at the thickest region to predict RF-MV accurately. For VI, the correlation between MT and MV was comparable among the locations. However, the correlation of VI was weaker than that of QF or RF, except for RF at the distal location for women. VI forms a unique morphology in the transverse plane surrounding the femoral bone. It is speculated that VI-MT – the distance between the superficial fascia of the VI and the upper margin of the femoral bone at the anterior thigh – is less sensitive as an index of VI-MV. In contrast, RF-MT can be measured as the diameter of the ellipse. It is also speculated that combining the MT of some of the QF improves its accuracy as an index of QF-MV, possibly due to averaging the variability of the individual muscle shapes along the length of the QF.
The RF-EI increased toward the distal thigh. This finding supports that of previous reports.18,19 SFT influences EI since US waves attenuate during propagation. However, the influence of SFT on the difference in EI may not have been large in this study since the difference in SFT among measurement locations was small. An increase in EI may be associated with the collagen content within a muscle, which tends to increase toward the muscle-tendon junctions.20 Regardless of the difference in EI, the correlations between EI-RF with RF-IntraMAT and QF-IntraMAT were comparable among the measurement locations. Thus, US scanning of the distal thigh is useful for estimating QF-IntraMAT.
Identifying the US measurement location that is most closely related to muscle function is clinically important. In this study, the correlation between QF-MT, RF-EI, and knee extensor strength showed no significant differences among the measurement locations. Notably, these results suggest that QF-MT and RF-EI measured in the distal thigh are useful for predicting the quantity, quality, and strength of the QF.
The QF is reported to be more susceptible to atrophy with aging compared to other muscles. In this study, only one participant each among the older men and women had sarcopenia based on the AWGS criteria. However, when low QF-MV was defined as two standard deviations below the values of the younger participants, 27 (64.3%) and 18 (36.0%) of the older men and women, respectively, were classified as having low QF-MV in this study. Thus, a certain number among community-dwelling older adults may have muscle-specific loss of the QF even if they are not diagnosed with sarcopenia. The muscle-specific loss of the QF is also observed in some diseases, such as stroke. Stroke survivors in the acute phase experience loss of QF-MT in both the paretic and non-paretic limbs at two weeks after admission,21 while they do not show loss of SMI at the same period.22 For early detection of muscle-specific loss of the QF in communities or clinical settings, US measurements of the distal thigh are preferable as the distal thigh can be easily exposed and contributes to quick scanning compared to the mid-thigh.
The present study demonstrates the usefulness of scanning the distal QF. However, when a clinician or researcher wants to assess individual muscles of the QF, it is recommended that they scan the thickest region of each muscle. For example, VM should be assessed in individuals with knee osteoarthritis because it is reportedly the most affected of the QF muscles.23 Additionally, muscle hypertrophy in response to resistance training differs along the muscle length.24 Therefore, when US measurements of the distal thigh are applied as an outcome of resistance training, the results should be interpreted cautiously.
A limitation of this study is that IntraMAT was measured from only 10 slices of MR images at the proximal location. This was because previous studies reported that the distribution of IntraMAT is constant throughout the length of QF17 and that the IntraMAT in the largest region of the thigh is representative of that of the entire thigh.2 However, we cannot exclude the possibility that our results were influenced by the limited IntraMAT measurements.
Conclusions
In conclusion, distal thigh US-derived MT and EI of the QF are useful for predicting MV, IntraMAT, and strength of the QF. The QF is the muscle most susceptible to atrophy with aging1,2 and is more closely associated with physical functions than total muscle measurements.3,4 Since the distal thigh can be easily exposed for scanning compared with the mid-thigh, US measurements at the distal thigh could be a quick screening tool for sarcopenia of the QF in busy clinical settings or for large-scale medical examinations in communities.
Abbreviations
AWGS, Asian Working Group for Sarcopenia, CSA, cross-sectional area, EI, echo intensity, IntraMAT, intramuscular adipose tissues, MRI, magnetic resonance imaging, MT, muscle thickness, MV, muscle volume, QF, quadriceps femoris, RF, rectus femoris, SFT, subcutaneous fat thickness, SMI, skeletal muscle mass index, T1WI, T1-weighted images, VI, vastus intermedius, VL, vastus lateralis, VM, vastus medialis, US, ultrasound.
Data Sharing Statement
The datasets generated and/or analyzed during the current study are not publicly available due to ethical restrictions but are available from the corresponding author on reasonable request.
Ethics Approval and Informed Consent
Written informed consent was obtained from all participants before examination. All procedures followed were in accordance with the ethical standards of the responsible committee on human experimentation (institutional and national) and the Helsinki Declaration of 1964 and its later amendments. The study protocol was approved by the ethics committee of Kyoto University (approval no. R1746).
Acknowledgments
The authors would like to thank all volunteers for their participation. This study was conducted using the MRI scanner and related facilities of Institute for the Future of Human Society, Kyoto University. This study was supported by the Japan Society for the Promotion of Science KAKENHI with a research grant provided to Yosuke Yamada (18H03164) and Yoshihiro Fukumoto (20K11271).
Funding
This study was supported by the Japan Society for the Promotion of Science KAKENHI (Grant number: 18H0316 and 20K11271).
Disclosure
The authors declare that they have no competing interests in this work.
References
1. Maden-Wilkinson TM, Degens H, Jones DA, McPhee JS. Comparison of MRI and DXA to measure muscle size and age-related atrophy in thigh muscles. J Musculoskelet Neuronal Interact. 2013;13(3):320–328.
2. Hogrel JY, Barnouin Y, Azzabou N, et al. NMR imaging estimates of muscle volume and intramuscular fat infiltration in the thigh: variations with muscle, gender, and age. Age. 2015;37(3):9798. doi:10.1007/s11357-015-9798-5
3. Ata AM, Kara M, Kaymak B, et al. Regional and total muscle mass, muscle strength and physical performance: the potential use of ultrasound imaging for sarcopenia. Arch Gerontol Geriatr. 2019;83:55–60. doi:10.1016/j.archger.2019.03.014
4. Tsukasaki K, Matsui Y, Arai H, et al. Association of muscle strength and gait speed with cross-sectional muscle area determined by mid-thigh computed tomography - A comparison with skeletal muscle mass measured by dual-energy X-ray absorptiometry. J Frailty Aging. 2020;9(2):82–89. doi:10.14283/jfa.2020.16
5. Fukumoto Y, Ikezoe T, Yamada Y, et al. Skeletal muscle quality assessed from echo intensity is associated with muscle strength of middle-aged and elderly persons. Eur J Appl Physiol. 2012;112(4):1519–1525. doi:10.1007/s00421-011-2099-5
6. Cadore EL, Izquierdo M, Conceicao M, et al. Echo intensity is associated with skeletal muscle power and cardiovascular performance in elderly men. Exp Gerontol. 2012;47(6):473–478. doi:10.1016/j.exger.2012.04.002
7. Wilhelm EN, Rech A, Minozzo F, Radaelli R, Botton CE, Pinto RS. Relationship between quadriceps femoris echo intensity, muscle power, and functional capacity of older men. Age. 2014;36(3):9625. doi:10.1007/s11357-014-9625-4
8. Osawa Y, Arai Y, Oguma Y, et al. Relationships of muscle echo intensity with walking ability and physical activity in the very old population. J Aging Phys Act. 2017;25(2):189–195. doi:10.1123/japa.2015-0203
9. Wilson DV, Moorey H, Stringer H, et al. Bilateral anterior thigh thickness: a new diagnostic tool for the identification of low muscle mass? J Am Med Dir Assoc. 2019;20(10):1247–1253 e2. doi:10.1016/j.jamda.2019.04.005
10. Fukumoto Y, Yamada Y, Ikezoe T, et al. Association of physical activity with age-related changes in muscle echo intensity in older adults: a 4-year longitudinal study. J Appl Physiol. 2018;125(5):1468–1474. doi:10.1152/japplphysiol.00317.2018
11. Akazawa N, Okawa N, Tamura K, Moriyama H. Relationships between intramuscular fat, muscle strength and gait independence in older women: a cross-sectional study. Geriatr Gerontol Int. 2017;17(10):1683–1688. doi:10.1111/ggi.12869
12. Akazawa N, Okawa N, Hino T, Tsuji R, Tamura K, Moriyama H. Higher malnutrition risk is related to increased intramuscular adipose tissue of the quadriceps in older inpatients: a cross-sectional study. Clin Nutr. 2020;39(8):2586–2592. doi:10.1016/j.clnu.2019.11.028
13. Perkisas S, Baudry S, Bauer J, et al. Application of ultrasound for muscle assessment in sarcopenia: towards standardized measurements. Eur Geriatr Med. 2018;9(6):739–757. doi:10.1007/s41999-018-0104-9
14. Fukumoto Y, Taniguchi M, Hirono T, et al. Influence of ultrasound focus depth on the association between echo intensity and intramuscular adipose tissue. Muscle Nerve. 2022;66(5):568–575. doi:10.1002/mus.27677
15. Chen LK, Woo J, Assantachai P, et al. Asian working group for sarcopenia: 2019 consensus update on sarcopenia diagnosis and treatment. J Am Med Dir Assoc. 2020;21(3):300–307 e2. doi:10.1016/j.jamda.2019.12.012
16. Meng XL, Rosenthal R, Rubin DB. Comparing correlated correlation-coefficients. Psychol Bull. 1992;111(1):172–175. doi:10.1037/0033-2909.111.1.172
17. Yoshiko A, Hioki M, Kanehira N, et al. Three-dimensional comparison of intramuscular fat content between young and old adults. BMC Med Imaging. 2017;17(1):12. doi:10.1186/s12880-017-0185-9
18. Stock MS, Oranchuk DJ, Burton AM, Phan DC. Age-, sex-, and region-specific differences in skeletal muscle size and quality. Appl Physiol Nutr Metab. 2020;45(11):1253–1260. doi:10.1139/apnm-2020-0114
19. Oranchuk DJ, Stock MS, Nelson AR, Storey AG, Cronin JB. Variability of regional quadriceps echo intensity in active young men with and without subcutaneous fat correction. Appl Physiol Nutr Metab. 2020;45(7):745–752. doi:10.1139/apnm-2019-0601
20. Subramanian A, Schilling TF. Tendon development and musculoskeletal assembly: emerging roles for the extracellular matrix. Development. 2015;142(24):4191–4204. doi:10.1242/dev.114777
21. Nozoe M, Kanai M, Kubo H, Kitamura Y, Shimada S, Mase K. Changes in quadriceps muscle thickness in acute non-ambulatory stroke survivors. Top Stroke Rehabil. 2016;23(1):8–14. doi:10.1179/1945511915Y.0000000002
22. Tanaka H, Kitamura G, Nankaku M, et al. Association of physical activity and nutritional intake with muscle quantity and quality changes in acute stroke patients. J Stroke Cerebrovasc Dis. 2022;31(6):106442. doi:10.1016/j.jstrokecerebrovasdis.2022.106442
23. Taniguchi M, Fukumoto Y, Kobayashi M, et al. Quantity and quality of the lower extremity muscles in women with knee osteoarthritis. Ultrasound Med Biol. 2015;41(10):2567–2574. doi:10.1016/j.ultrasmedbio.2015.05.014
24. Franchi MV, Atherton PJ, Reeves ND, et al. Architectural, functional and molecular responses to concentric and eccentric loading in human skeletal muscle. Acta Physiol. 2014;210(3):642–654. doi:10.1111/apha.12225
 © 2023 The Author(s). This work is published and licensed by Dove Medical Press Limited. The full terms of this license are available at https://www.dovepress.com/terms.php and incorporate the Creative Commons Attribution - Non Commercial (unported, v3.0) License.
By accessing the work you hereby accept the Terms. Non-commercial uses of the work are permitted without any further permission from Dove Medical Press Limited, provided the work is properly attributed. For permission for commercial use of this work, please see paragraphs 4.2 and 5 of our Terms.
© 2023 The Author(s). This work is published and licensed by Dove Medical Press Limited. The full terms of this license are available at https://www.dovepress.com/terms.php and incorporate the Creative Commons Attribution - Non Commercial (unported, v3.0) License.
By accessing the work you hereby accept the Terms. Non-commercial uses of the work are permitted without any further permission from Dove Medical Press Limited, provided the work is properly attributed. For permission for commercial use of this work, please see paragraphs 4.2 and 5 of our Terms.