")
Back to Journals » International Journal of Nephrology and Renovascular Disease » Volume 17
Association of Mitochondrial Pyruvate Carrier with the Clinical and Histological Features in Lupus Nephritis
Authors Zhu H, Chen C, Geng L, Li Q, Zhang C, Wu L, Zhang B , Duan S, Xing C, Yuan Y
Received 7 October 2023
Accepted for publication 11 January 2024
Published 19 January 2024 Volume 2024:17 Pages 29—38
DOI https://doi.org/10.2147/IJNRD.S443519
Checked for plagiarism Yes
Review by Single anonymous peer review
Peer reviewer comments 2
Editor who approved publication: Professor Pravin Singhal
Huanhuan Zhu, Chen Chen, Luhan Geng, Qing Li, Chengning Zhang, Lin Wu, Bo Zhang, Suyan Duan,* Changying Xing,* Yanggang Yuan*
Department of Nephrology, the First Affiliated Hospital of Nanjing Medical University, Nanjing Medical University, Nanjing, People’s Republic of China
*These authors contributed equally to this work
Correspondence: Yanggang Yuan, Department of Nephrology, the First Affiliated Hospital of Nanjing Medical University, Nanjing Medical University, 300 Guangzhou Road, Nanjing, Jiangsu Province, 210029, People’s Republic of China, Tel/Fax +86-25-6813-6462, Email [email protected]
Background: Mounting evidence suggests that mitochondrial dysfunction contributes to lupus nephritis (LN) pathogenesis. Mitochondrial pyruvate carrier 1 (MPC1) and mitochondrial pyruvate carrier 2 (MPC2) mediating pyruvate transport from the cytoplasm to the mitochondrial matrix, determines the cell survival and cellular energy supply. Here, we aimed to investigate the association of mitochondrial pyruvate carrier expression with the clinical and histological features in LN.
Methods: Patients with biopsy-proven proliferative LN (class III and class IV, n=18) and membranous LN (class V, n=18) were included. Expression of MPC1 and MPC2 were examined by immunohistochemistry. MPC protein levels in the two groups were evaluated by the Student’s t-test. Correlation analysis between MPC levels and clinicopathological features was performed by Spearman’s rank correlation.
Results: Both MPC1 and MPC2 were exclusively expressed in renal tubules of enrolled LN. Significantly lower MPC1 and MPC2 were observed in patients with proliferative LN compared to membranous LN. In addition, the MPC1 and MPC2 were negatively correlated with SLEDAI-2K score, renal function, and renal pathology activity index.
Conclusion: Both MPC1 and MPC2 were localized in renal tubules, and decreased MPC content was more pronounced in proliferative LN than membranous LN. MPC levels were significantly correlated with renal functions and renal pathology activity.
Keywords: lupus nephritis, mitochondrial pyruvate carrier, proliferative, membranous, tubulointerstitial lesions
Introduction
Lupus nephritis (LN) is one of the most common severe manifestations of systemic lupus erythematosus (SLE) and a key driver of mortality and morbidity in SLE.1–3 Numerous studies demonstrated that the proportion of patients with SLE developed lupus nephritis in their disease course, the prevalence was approximately 40%.4 Despite increased knowledge of disease pathogenesis and improved treatment options, a significant portion of patients with severe LN (10–30%) still progress to end-stage renal disease (ESRD) within 15 years even with aggressive immunosuppressive therapy.5,6 It is imperative to identify sensitive and precise indicators for reflecting disease activity and stratifying LN patients at risk of progressing to rapid renal impairment.
The role of mitochondria in lupus has attracted extensive attention, and functional alternation of mitochondria would take part in systemic lupus erythematous.3,7,8 Mitochondria is the main endogenous source of reactive oxygen species (ROS), therefore, plays a crucial role in generating oxidative stress. ROS modulates cytokine production, T cell activation and inflicts DNA damage, which facilitates the emergence of SLE.9 Moreover, mitochondria DNA damage may cause ATP reduction, ROS generation, and tissue damage in systemic lupus erythematous.10 Mitochondrial dysfunction-provoked excessive oxidative stress is a crucial downstream contributory factor for lupus pathogenesis and the dysregulation of upstream genetic/epigenetic functions.7 Pyruvate, a hub metabolite for glucose, lipid, and amino acid, is critical for maintaining the stability of mitochondrial function.11,12 Pyruvate drives ATP production by intersecting the citric acid cycle, while ROS levels can dramatically increase when the respiratory chain is dysfunctional, and pyruvate promotes oxidative stress resistance through hormetic ROS signaling.13 Mitochondrial pyruvate carrier (MPC), is located in the inner mitochondrial membrane, mediating the transport of pyruvate from the cytoplasm to mitochondria.14,15 MPC comprises two subunits, MPC1 and MPC2, and the expression of each is essential for mitochondrial pyruvate transport.7,16 Our previous study explored the expression of MPC in diabetic nephropathy (DN), primary glomerulonephropathy (PGN), PGN with diabetes mellitus (PGN-DM), and their correlation with clinical features.17 However, the role of MPC in the kidneys of lupus nephritis patients was still unclear. Therefore, the present study was aimed to investigate the significance of MPC for clinical and pathological features in proliferative LN and membranous LN.
Methods
Subjects
A total of 36 patients with renal biopsy-proven lupus nephritis were recruited from January 2016 to October 2019 were retrospectively reviewed. All patients fulfilled the 2012 SLE international collaborating clinics classification criteria.18 Renal biopsies were performed following the indications recommended by the ACR,19 and LN pathological classification was based on 2003 International Society of Nephrology/Renal Pathology Society (ISN/RPS) pathological classification criteria, modified in 2018.20,21 The exclusion criteria were as follows: (1) patients aged at 18 and younger; (2) patients with mixed proliferative LN (class III+V or IV+V); (3) coexistence of other renal diseases (such as minimal change disease and thrombotic microangiopathy) or diabetes. Based on their renal biopsy reports, the patients were categorized into the proliferative LN (class III, class IV) and membranous LN (class V) groups.
Measurements
Clinical parameters and laboratory data were obtained from the medical records, including gender, age, SLE duration, blood pressure, serum creatinine, blood urea nitrogen (BUN), serum cystatin C, uric acid, albumin, serum complement 3 (C3), serum complement 4 (C4), antinuclear antibodies (ANA), anti-double-stranded DNA (anti-dsDNA), 24-h urine protein, and urinary acidification function. Plasma samples and 24-h urine samples were obtained from patients within three days before the renal biopsy. GFR was estimated using the chronic kidney disease epidemiology collaboration (CKD-EPI) equation.22 The SLE disease activity index 2000 (SLEDAI-2K) and renal SLE disease activity index (rSLEDAI) were used to assess SLE activity and kidney disease activity, respectively.23,24 The rSLEDAI consists of four parameters: hematuria, proteinuria, pyuria, and urinary casts, each accounting for four scores. The evaluation of SLEDAI-2K scores and rSLEDAI scores were obtained one day before renal biopsy.
Immunohistochemistry
Paraffin sections were deparaffinized and rehydrated. Then, the sections were subject to antigen retrieval with citrate buffer and washed with phosphate-buffered saline. After blocking by 5% bovine serum albumin for 1 h at room temperature, the sections were incubated with MPC1 antibody (1:900, Sigma, HPA045119) and MPC2 antibody (1: 20, Sigma, HPA056091) overnight at 4 °C. The sections were washed with PBS and then incubated with the second antibody for 1 h at 37 °C. The sections were then stained with 3, 3′-diaminobenzidine tetrahydrochloride for 10 min and counterstained with hematoxylin, dehydrated and mounted. Immunohistochemistry was performed on tissue sections from every subject for each antibody, which was performed with positive and negative control. And immunohistochemical parameters were assessed through integrated optical density (IOD), which means integral calculus of the stained area times the intensity of stain in each pixel in the area, indicating the total amount of staining material in that area. For each specimen, 8–10 images of stained sections were randomly selected and captured, and the Image-Pro Plus 6.0 mage analysis software (media controls, Silver Spring, MD, USA) was used to measure the IOD value. Under the same parameter conditions, the IOD value of all the slices was analyzed and presented.
Renal Pathology
Renal biopsy specimens were evaluated by two experienced pathologists following the modified ISN/RPS pathological classification criteria.21 Activity indices consisted of endocapillary hypercellularity, neutrophils/karyorrhexis, fibrinoid necrosis, hyaline deposits, cellular/fibrocellular crescent and interstitial inflammation. Chronicity indices consisted of total glomerulosclerosis score, fibrous crescents, tubular atrophy, and interstitial fibrosis. And glomerular sclerosis, cellular crescents, and fibrous crescents were calculated as percentages of the total number of glomeruli. The fibrinoid necrosis and cellular crescents were weighted by a factor of 2.
Statistical Analysis
SPSS 22.0 software (SPSS, Chicago, IL, USA) was used for data analysis. Variables were expressed as the mean ± standard deviation, median (interquartile range), or percentage. The non-significant values in Shapiro–Wilk and Levene’s tests indicate normal distribution and homogeneity in variance, respectively. Comparisons for normal distribution groups were performed using Student’s t-test. Differences among non-normal distribution groups were analyzed using the Mann–Whitney U-test. Correlations between MPC protein expression levels and clinical characteristics were assessed by using Spearman’s rank test. Significance was defined as p< 0.05.
Results
Baseline Characteristics of the Enrolled Patients with LN
A total of 36 patients with biopsy-proven LN were included in the study. The clinical characteristics, laboratory parameters, and pathological features of patients were shown in Table 1. The patients were predominantly women (86.1%), with a mean age of 39.56±13.39 years. The mean duration of SLE was 2.00 (1.00,4.50) months. 36.10% of patients presented with nephrotic syndrome and 41.70% of patients had hematuria. The mean levels of eGFR, urine protein, serum creatinine and C3 were 90.79±35.72 mL/min/1.73 m2, 2.08 (1.90, 3.71) g/24 h, 69.60 (54.00, 133.55) umol/L and 0.70±0.35 g/L, respectively. Among the patients, 18 patients (50%) had proliferative LN (class III, 6 patients; class IV, 12 patients), and 18 patients (50%) had membranous LN.
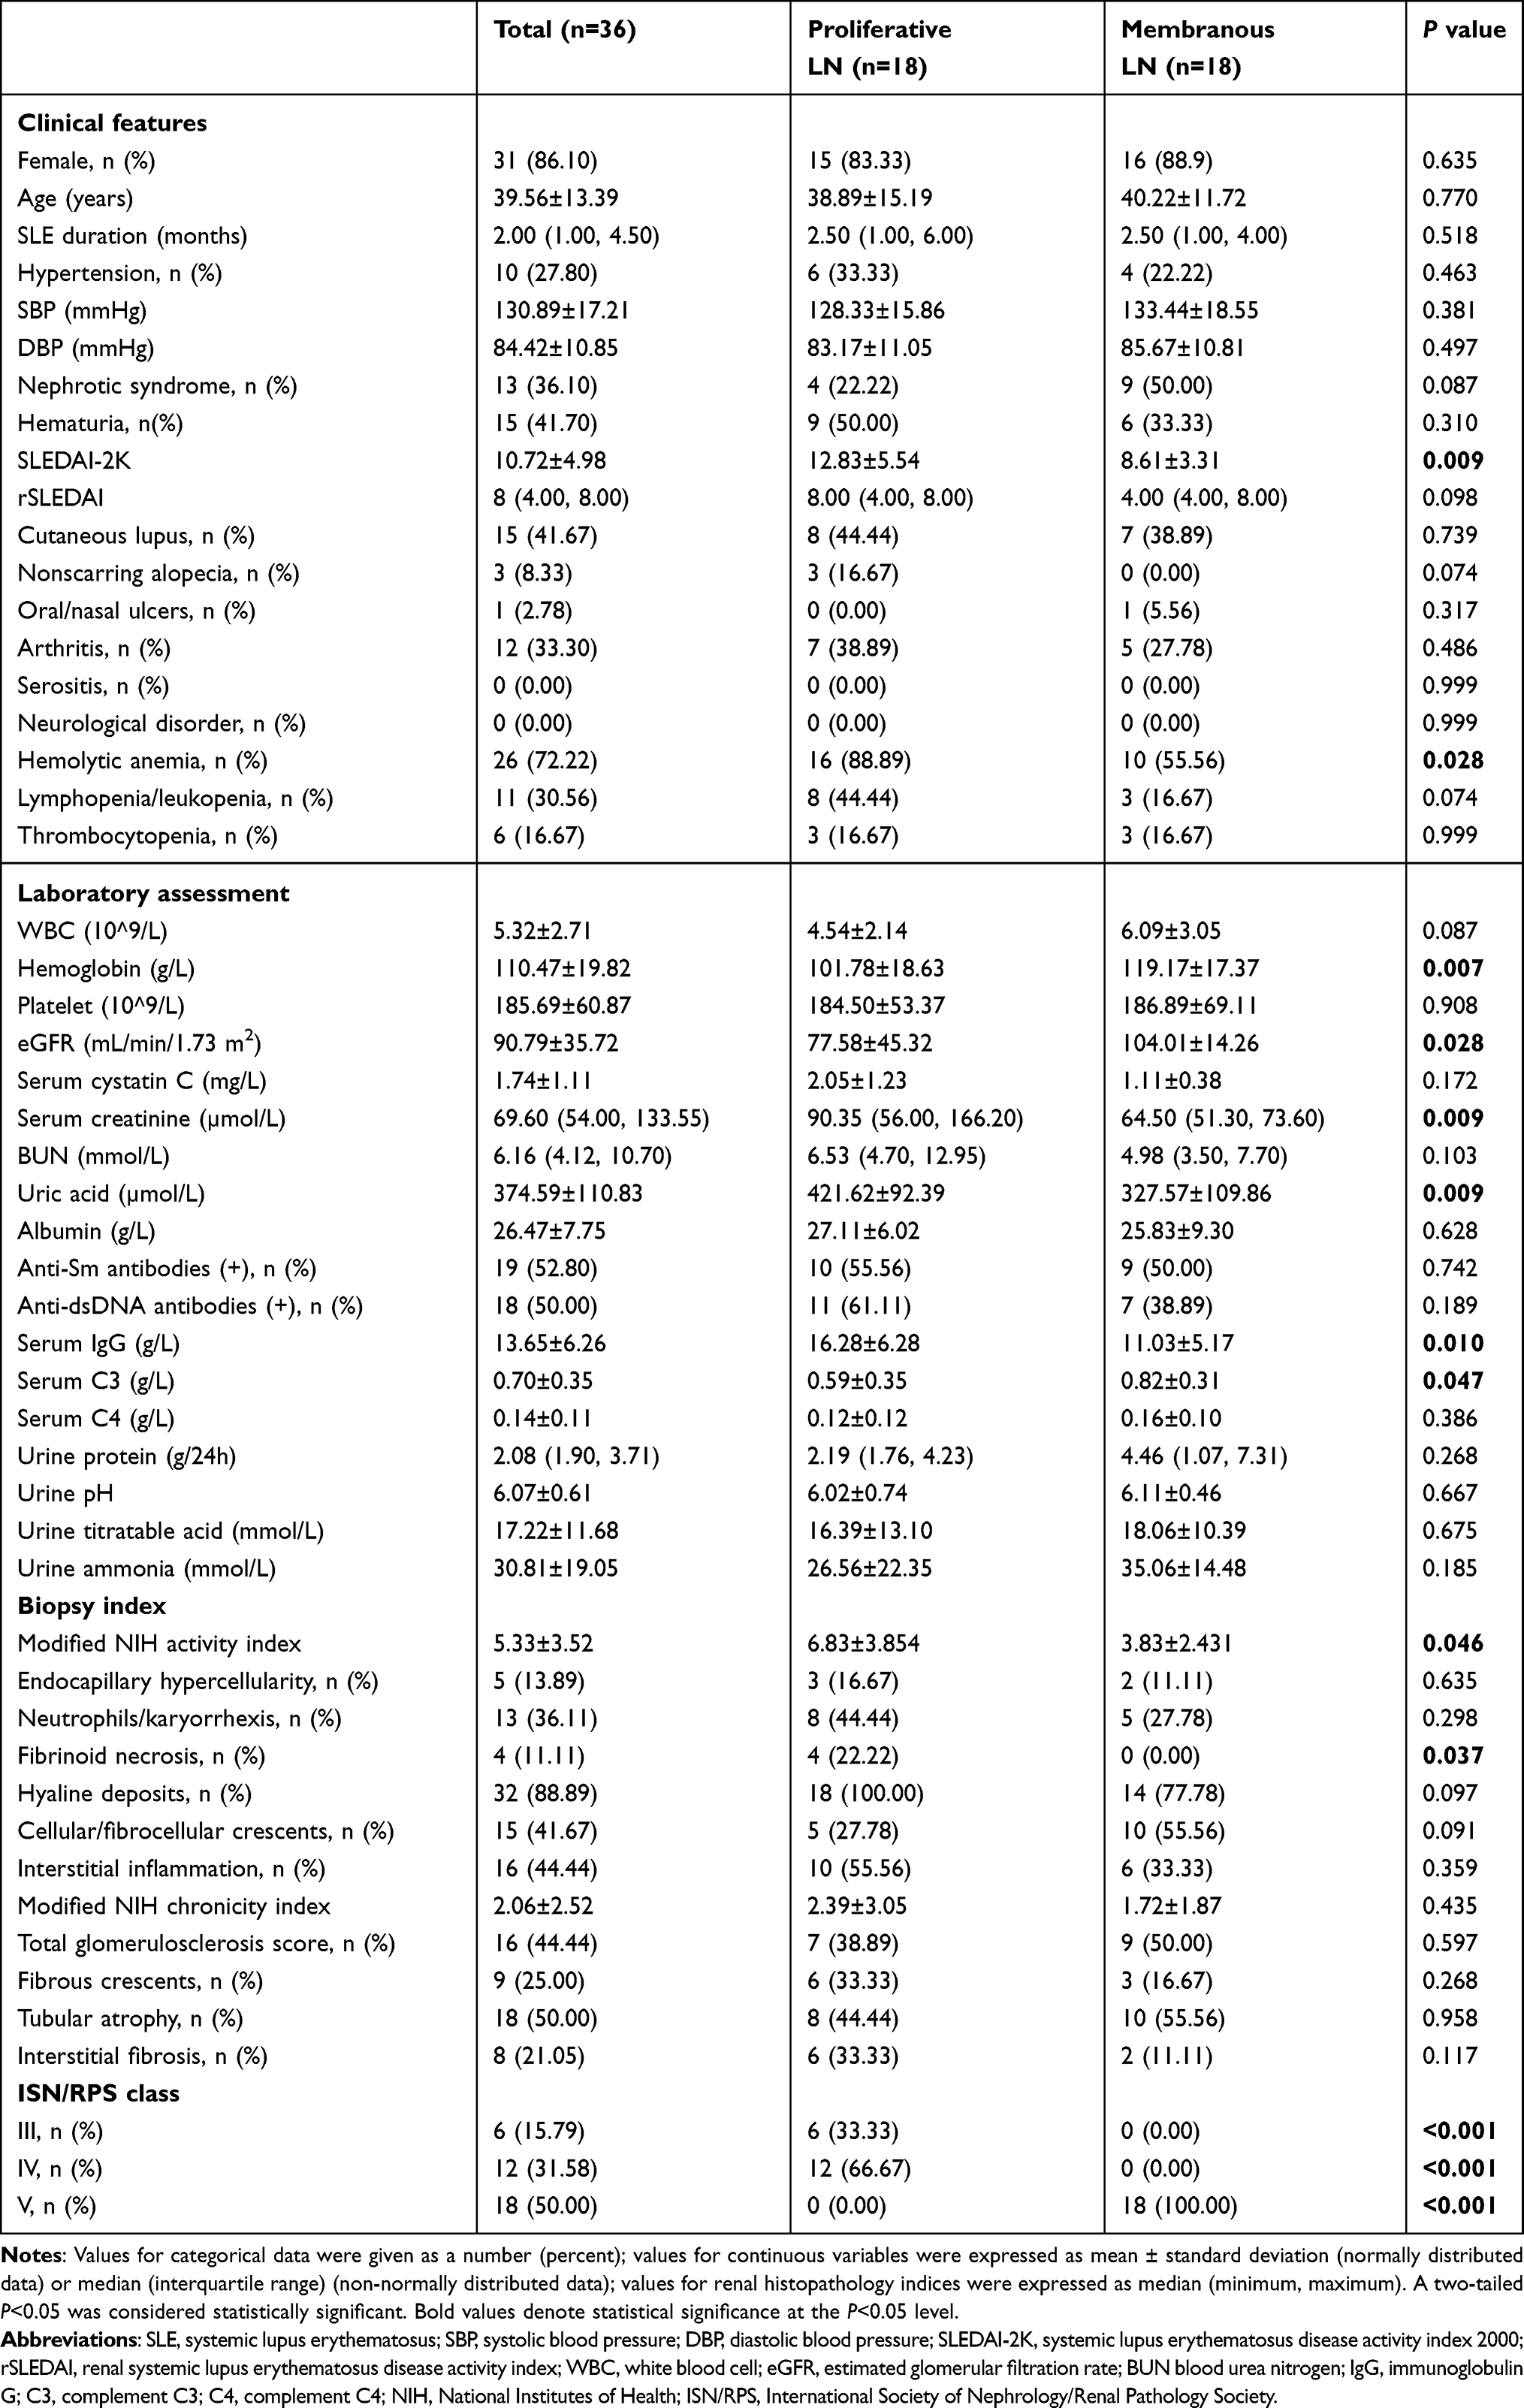 |
Table 1 Comparison of the Clinical and Histologic Features Between the Patients with Proliferative LN and Membranous LN |
The comparison of characteristics between proliferative LN and membranous LN were shown in Table 1. Age, gender distribution, SLE duration, and the proportion of patients with hypertension, nephrotic syndrome or hematuria did not differ between the two groups. The SLEDAI-2K was significantly higher in the proliferative LN group (12.83±5.54 vs 8.61±3.31, p=0.009). Patients with proliferative LN had a significantly higher prevalence of hemolytic anemia than those with membranous LN, and there were no other disease activity indicators showing the difference between the two groups. Moreover, patients with proliferative LN had significantly higher serum creatinine, uric acid, and IgG levels, but lower hemoglobin, eGFR and C3 levels than those with membranous LN. In addition, in the comparison of renal histopathological features, higher levels of modified NIH activity index and the proportion of patients with fibrinoid necrosis were observed in proliferative LN.
MPC Expression in the Renal Tissue of LN
To study the role of MPC in patients with LN, we compared the levels of MPC1 and MPC2 between proliferative LN (n=18) and membranous LN (n=18) by immunohistochemical staining (Figures 1 and 2). Both MPC1 and MPC2 were exclusively detected in renal tubules in enrolled LN patients. Renal biopsies from patients with membranous LN showed more intense staining of MPC1 and MPC2 in the tubules compared to those with proliferative LN (p=0.002, p<0.001, respectively) (Figures 1C and 2C).
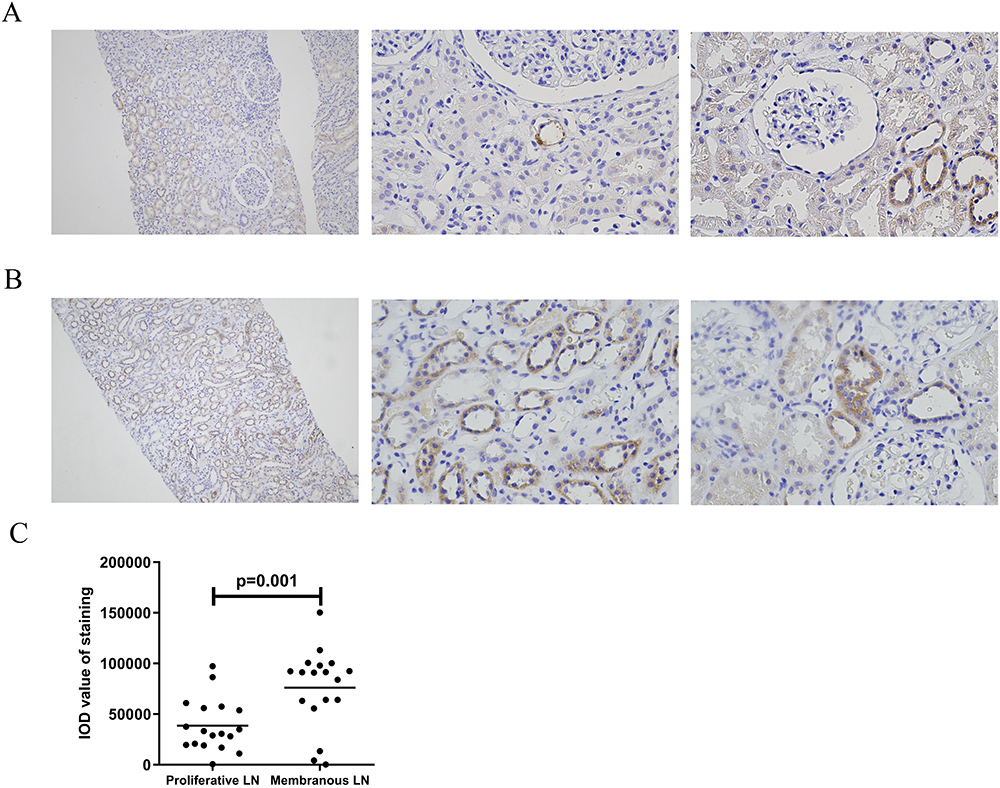 |
Figure 1 MPC1 expression in kidney tissues of LN. Representative immunohistochemical staining of MPC1 in proliferative LN ((A), n=18), and membranous LN ((B), n=18) groups, respectively. Left column (Magnification×100). Right two columns (Magnification×400). (C) shows a comparison of quantitative analysis of MPC1 expression between proliferative LN and membranous LN using Image-Pro Plus 6.0 software. Abbreviations: LN, lupus nephritis; IOD, integrated optical density. |
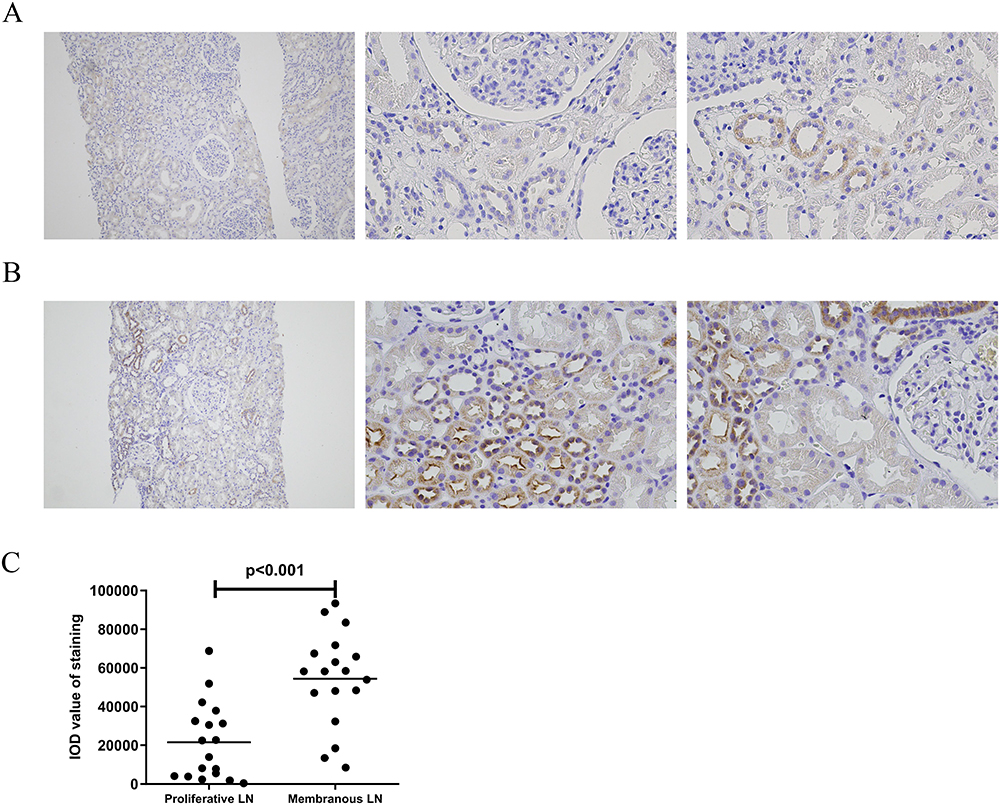 |
Figure 2 MPC2 expression in kidney tissues of LN. Representative immunohistochemical staining of MPC2 in proliferative LN ((A), n=18), and membranous LN ((B), n=18) groups, respectively. Left column (Magnification×100). Right two columns (Magnification×400). (C) shows a comparison of quantitative analysis of MPC2 expression between proliferative LN and membranous LN using Image-Pro Plus 6.0 software. Abbreviations: LN, lupus nephritis; IOD, integrated optical density. |
Association Between MPC and Features of LN
The associations between tubular MPC expression and the clinical and histologic features of LN were further analyzed in Table 2. In respect of clinical characters, the MPC1 was negatively correlated with SLEDAI-2K scores and rSLEDAI scores. And the MPC2 was only negatively correlated with SLEDAI-2K scores. Regarding the laboratory data, the MPC1 was positively associated with eGFR and urine ammonia, whereas it was inversely correlated with serum creatinine, BUN, uric acid, and anti-dsDNA antibodies. There were significant negative correlations between the MPC2 and serum creatinine, BUN, uric acid and anti-dsDNA antibodies. MPC2 was positively associated with eGFR and urine ammonia.
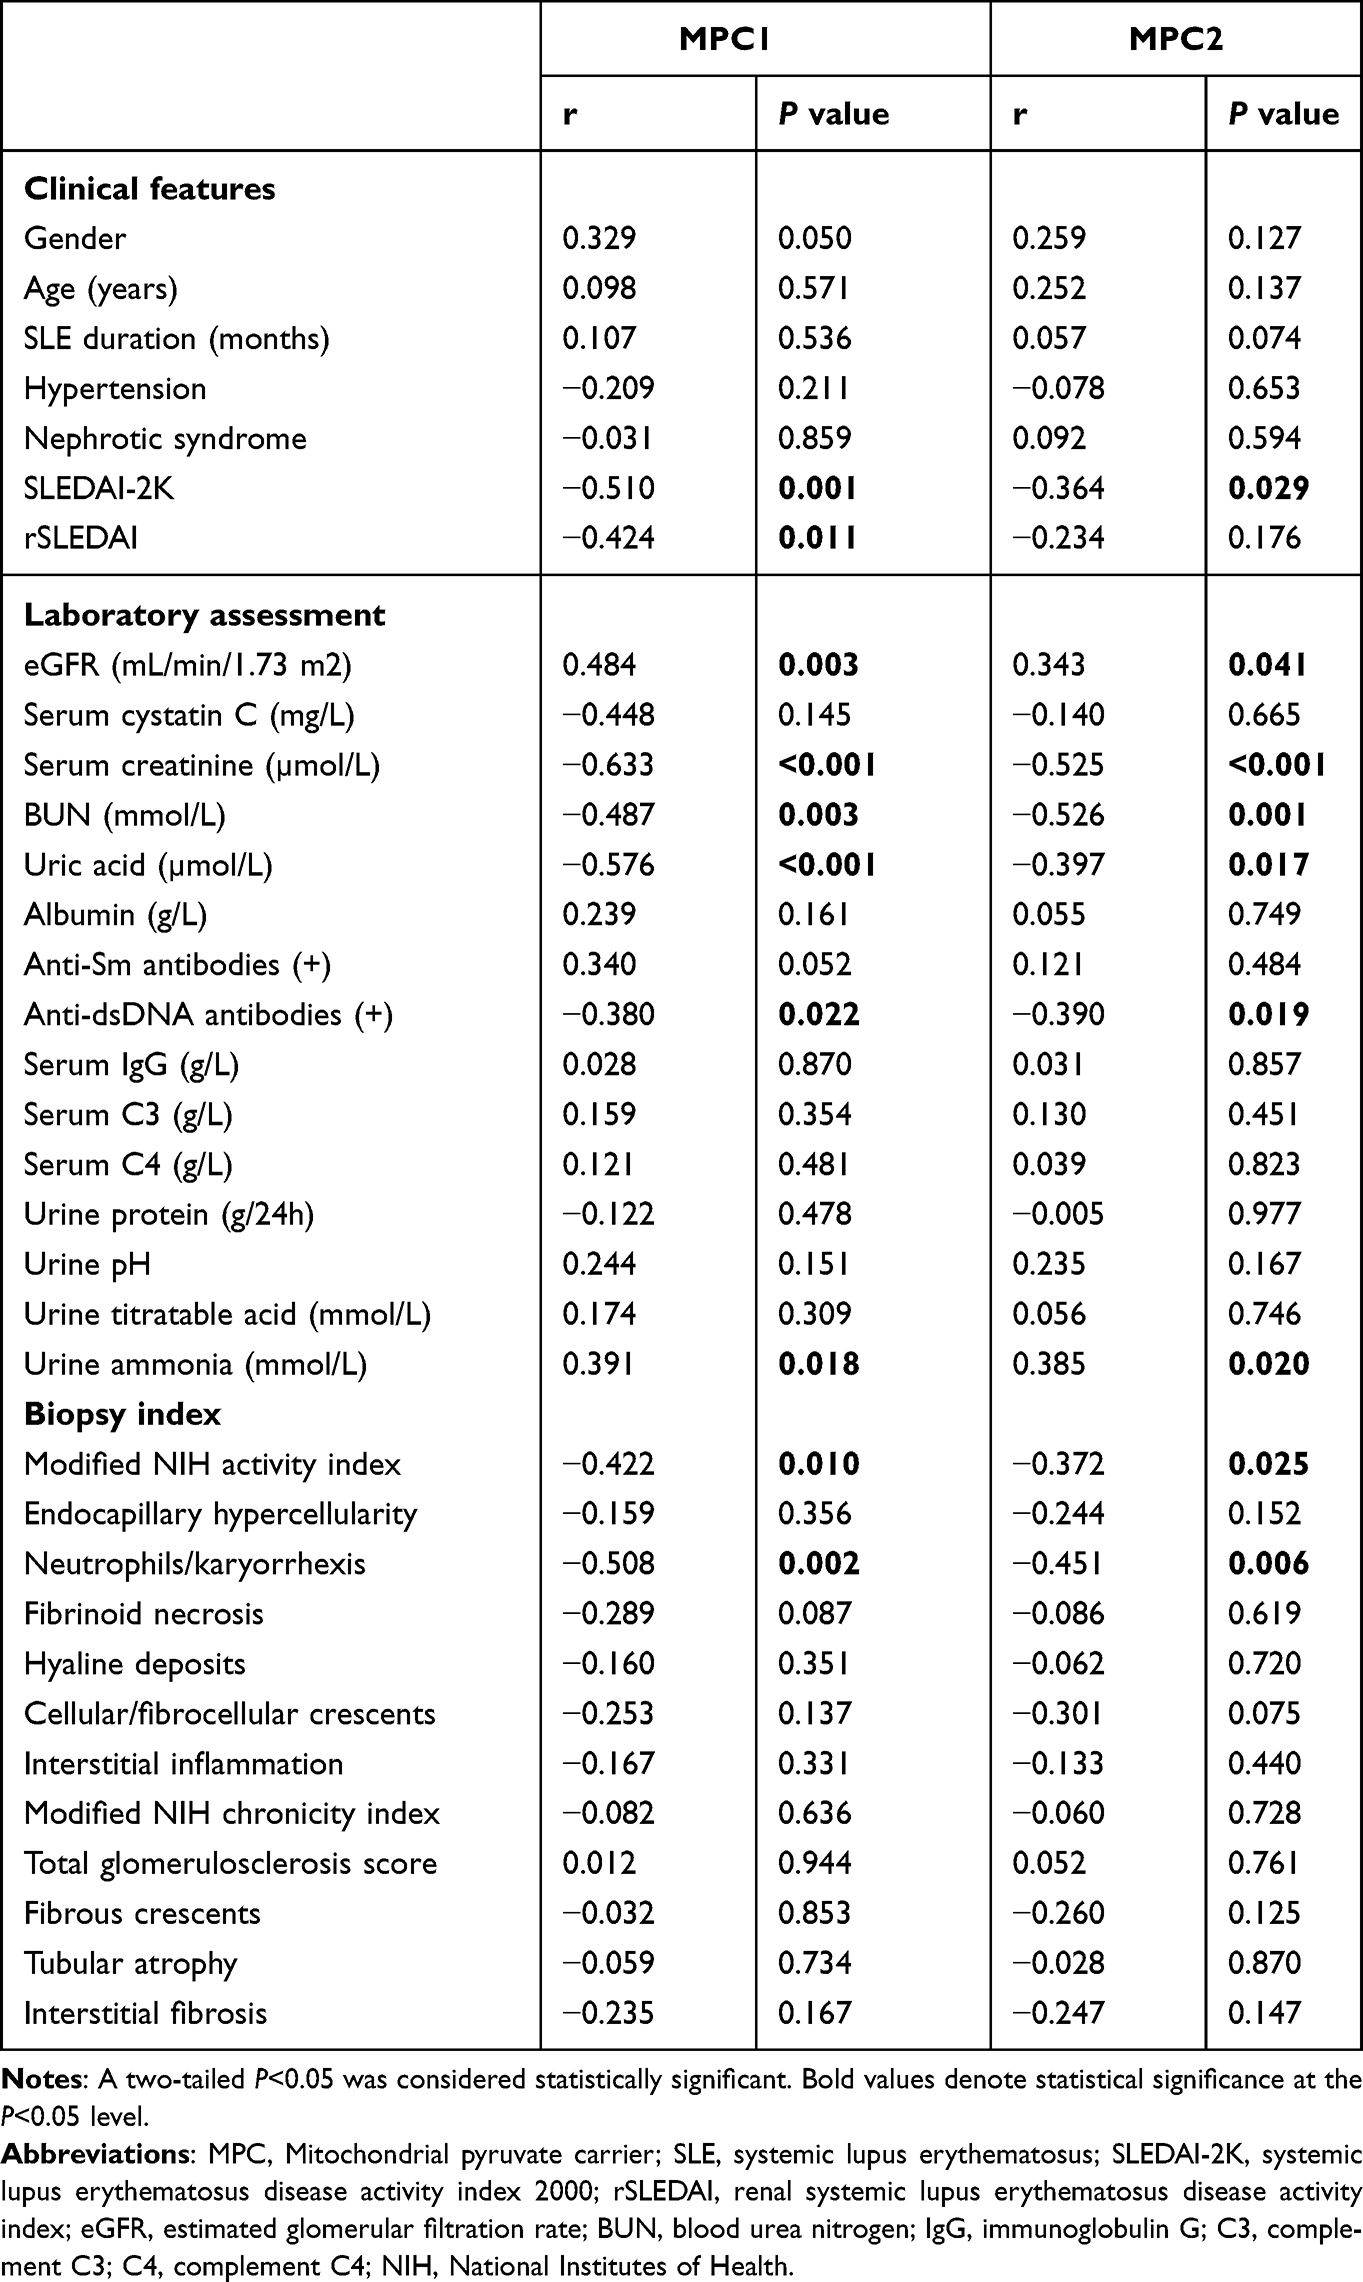 |
Table 2 Associations Between MPC and Features of Lupus Nephritis (n=36) |
As for renal pathological features of LN, both MPC1 and MPC2 had significant negative correlations with modified NIH activity index and neutrophils/karyorrhexis. However, there was no association between MPC1/MPC2 and other biopsy indexes (Table 2).
Discussion
This retrospective study showed that MPC1 and MPC2 were uniquely expressed in renal tubules in LN patients. Both MPC1 and MPC2 expression were significantly decreased in proliferative LN compared to membranous LN. Moreover, tubular MPC1 levels were positively correlated with eGFR, while it was inversely associated with serum creatinine, BUN and uric acid, SLEDAI-2K, rSLEDAI, modified NIH activity index, and neutrophils/karyorrhexis in enrolled LN patients, suggesting that MPC1 expression was significantly associated with renal function and disease activity. The analogous correlation was also observed in the MPC2 group.
Accumulating data has demonstrated that mitochondrial dysfunction plays an essential role in the pathogenesis of LN.8 It has been reported that injured renal tubular cells in LN have a defect in fatty acid oxidation, which causes mitochondrial dysfunction, reprograms them to a pro-fibrotic phenotype, and contributes to their death.25,26 Abundant mitochondria provide energy in tubular epithelial for the reabsorption of various solutes.27 Pyruvate is critical for mitochondrial ATP generation and energy metabolism, while MPC activity is necessary for several processes that require the presence of pyruvate inside mitochondria. Hence, we focus our attention on the significance of MPC, a gatekeeper in mitochondrial metabolism for transporting pyruvate, which is a central substrate in the metabolism of fatty acid, carbohydrate, and amino acid. We observed that both MPC1 and MPC2 expression were exclusively detected in renal tubules in proliferative LN and membranous LN. MPC was positively associated with renal tubular damage marker urine ammonia, which reinforces the potential association of mitochondrial metabolism with renal tubular function in LN. Furthermore, MPC expression was significantly decreased in proliferative LN compared to membranous LN, and the mitochondrial dysfunction caused by decreased expression of MPC in kidney may be involved in the progression of LN disease. However, the results in LN are not unique, and similar results have been seen in other glomerular nephritis. In our previous study, the results of immunohistochemical staining indicated the expression of MPC1 and MPC2 in the DN were similar to those seen in LN. The expression of MPC in minimal change disease, membranous nephropathy, IgA nephropathy and focal segmental glomerulosclerosis served as positive controls.
Mitochondrial dysfunction is not only one of the pathological mediators in renal diseases but also an important participant in the progression. Previous studies have shown that increased production of ROS, up-regulated expression of cytochrome C oxidase I and IV, and inactivated mitochondrial respiratory chain complex IV in patients with CKD IV–V stage, indicating that mitochondrial dysfunction was closely related to the progression of CKD.28,29 Han et al showed that Niclosamide ethanolamine salt, a mitochondrial uncoupler, attenuated lupus nephritis in MRL/lpr mice through decreasing urinary excretion of tubular injury biomarkers, inhibiting tubular proliferation and suppressing renal interstitial inflammation and fibrosis.30 In the present research, MPC was correlated with markers of renal function, including eGFR, serum creatinine, cystatin C, BUN. Hyperuricemia is an independent risk factor for the progression of renal function in CKD patients, and its mechanisms include the induction of epithelial-mesenchymal transition, the activation of the renin-angiotensin system, and endothelial dysfunction.31 Both MPC1 and MPC2 were negatively correlated with serum uric acid levels in LN. Mitochondrial dysfunction caused by reduced expression of renal tissue MPC may be involved in LN progression. Another important finding was that the MPC correlated significantly with the disease activity of LN. Both the MPC was correlated with renal SLEDAI score and anti-dsDNA antibodies. More importantly, the MPC is significantly associated with renal pathology activity index rather than the chronicity index, which is concordant with the observed correlation with clinical renal disease activity. A growing body of research has documented that the activity index in renal histopathology is a predictor of long-term renal outcomes.32,33 The correlation between the MPC and the activity index suggests a prediction potential of the MPC for a long-term renal outcome, which needs further large-scale studies.
There are several limitations in the present study that should be considered. Firstly, it shares all the limitations of observational, single-center studies. The relatively small sample size limited us from performing subgroup analyses or more advanced statistics. Subsequent studies should consider expanding the sample size in order to improve the statistical power and verify the results. Secondly, the MPC expression was semi-quantified by immunohistochemistry and this study mainly focused on the results of LN, which makes the current study more limited. Further studies on MPC expression in multiple types of kidney diseases should be conducted to obtain more meaningful results. Thirdly, long-term follow-up data is missing for further investigation of the impact of the MPC on the renal prognosis in LN. Last but not least, the interrelationship and precise role of the MPC-pyruvate-mitochondria axis in the tubular damage in LN are worthy of mechanistic studies in the future.
In conclusion, our observations indicate that both MPC1 and MPC2 were exclusively expressed in renal tubules of LN, and decreased levels were significantly associated with unfavorable clinicopathological features.
Data Sharing Statement
The datasets analyzed during the current study are available from the corresponding author on reasonable request.
Ethics Approval and Consent to Participate
All experiments and methods were performed in accordance with relevant guidelines and regulations. This study protocol was reviewed and approved by the Ethics Committee of the First Affiliated Hospital of Nanjing Medical University and was conducted in accordance with the Declaration of Helsinki. Informed consent was obtained from all individual participants included in the study.
Acknowledgments
The authors thank the patients for participation in our study and the staff of the Department of Nephrology at the First Affiliated Hospital of Nanjing Medical University for assistance.
Huanhuan Zhu and Chen Chen are co-first authors of this study. Suyan Duan, Changying Xing and Yanggang Yuan are senior authors with an equal contribution in this study.
Funding
This work was supported by grants from the National Natural Science Foundation of China (82170699, 81870469, 82100767), the Natural Science Foundation of Jiangsu Province (No. BK20191075), the “333 Project” of Jiangsu Province, the Six Talent Peaks Project in Jiangsu Province (WSN-010), “Yiluqihang Shenmingyuanyang” medical development And Scientific Research Fund project on Kidney Diseases (SMYY20220301001), and the Priority Academic Program Development (PAPD) of Jiangsu Higher Education Institution. These funding sources were not involved in the design of the study and data collection, analysis, or interpretation. They also played no role in the writing of the manuscript.
Disclosure
The authors declare that they have no competing interests.
References
1. Anders H-J, Saxena R, Zhao M-H, Parodis I, Salmon JE, Mohan C. Lupus nephritis. Nat Rev Dis Primers. 2020;6(1):7. doi:10.1038/s41572-019-0141-9
2. Kwon OC, Park JH, Park H-C, et al. Non-histologic factors discriminating proliferative lupus nephritis from membranous lupus nephritis. Arthritis Res Ther. 2020;22(1):138. doi:10.1186/s13075-020-02223-x
3. Zuo Z, Jing K, Wu H, et al. Mechanisms and Functions of Mitophagy and Potential Roles in Renal Disease. Front Physiol. 2020;11:935. doi:10.3389/fphys.2020.00935
4. Ward MM. Prevalence of physician-diagnosed systemic lupus erythematosus in the United States: results from the third national health and nutrition examination survey. J Womens Health. 2004;13(6):713–718. doi:10.1089/jwh.2004.13.713
5. Maroz N, Segal MS. Lupus nephritis and end-stage kidney disease. Am J Med Sci. 2013;346(4):319–323. doi:10.1097/MAJ.0b013e31827f4ee3
6. Ding H, Lin C, Cai J, et al. Urinary activated leukocyte cell adhesion molecule as a novel biomarker of lupus nephritis histology. Arthritis Res Ther. 2020;22(1):122. doi:10.1186/s13075-020-02209-9
7. Tavoulari S, Thangaratnarajah C, Mavridou V, Harbour ME, Martinou J-C, Kunji ER. The yeast mitochondrial pyruvate carrier is a hetero-dimer in its functional state. EMBO J. 2019;38(10). doi:10.15252/embj.2018100785
8. Yang S-K, Zhang H-R, Shi S-P, et al. The Role of Mitochondria in Systemic Lupus Erythematosus: a Glimpse of Various Pathogenetic Mechanisms. Curr Med Chem. 2020;27(20):3346–3361. doi:10.2174/0929867326666181126165139
9. Gergely P, Grossman C, Niland B, et al. Mitochondrial hyperpolarization and ATP depletion in patients with systemic lupus erythematosus. Arthritis Rheum. 2002;46(1):175–190. doi:10.1002/1529-0131(200201)46:1<175::AID-ART10015>3.0.CO;2-H
10. López-López L, Nieves-Plaza M, Castro M, et al. Mitochondrial DNA damage is associated with damage accrual and disease duration in patients with systemic lupus erythematosus. Lupus. 2014;23(11):1133–1141. doi:10.1177/0961203314537697
11. Gray LR, Tompkins SC, Taylor EB. Regulation of pyruvate metabolism and human disease. Cell Mol Life Sci. 2014;71(14):2577–2604. doi:10.1007/s00018-013-1539-2
12. Li X, Ji Y, Han G, et al. MPC1 and MPC2 expressions are associated with favorable clinical outcomes in prostate cancer. BMC Cancer. 2016;16(1):894. doi:10.1186/s12885-016-2941-6
13. Tauffenberger A, Fiumelli H, Almustafa S, Magistretti PJ. Lactate and pyruvate promote oxidative stress resistance through hormetic ROS signaling. Cell Death Dis. 2019;10(9):653. doi:10.1038/s41419-019-1877-6
14. Feng J, Ma Y, Chen Z, Hu J, Yang Q, Ding G. Mitochondrial pyruvate carrier 2 mediates mitochondrial dysfunction and apoptosis in high glucose-treated podocytes. Life Sci. 2019;237:116941. doi:10.1016/j.lfs.2019.116941
15. Zhu H, Wan H, Wu L, et al. Mitochondrial pyruvate carrier: a potential target for diabetic nephropathy. BMC Nephrol. 2020;21(1):274. doi:10.1186/s12882-020-01931-5
16. Herzig S, Raemy E, Montessuit S, et al. Identification and functional expression of the mitochondrial pyruvate carrier. Science. 2012;337(6090):93–96. doi:10.1126/science.1218530
17. Zhu H, Wan H, Wu L, et al. Mitochondrial pyruvate carrier: a potential target for diabetic nephropathy. BMC Nephrol. 2020;21(1):274.
18. Petri M, Orbai A-M, Alarcón GS, et al. Derivation and validation of the Systemic Lupus International Collaborating Clinics classification criteria for systemic lupus erythematosus. Arthritis Rheum. 2012;64(8):2677–2686. doi:10.1002/art.34473
19. Hahn BH, McMahon MA, Wilkinson A, et al. American College of Rheumatology guidelines for screening, treatment, and management of lupus nephritis. Arthritis Care Res. 2012;64(6):797–808. doi:10.1002/acr.21664
20. Weening JJ, D’Agati VD, Schwartz MM, et al. The classification of glomerulonephritis in systemic lupus erythematosus revisited. Kidney Int. 2004;65(2):521–530. doi:10.1111/j.1523-1755.2004.00443.x
21. Bajema IM, Wilhelmus S, Alpers CE, et al. Revision of the International Society of Nephrology/Renal Pathology Society classification for lupus nephritis: clarification of definitions, and modified National Institutes of Health activity and chronicity indices. Kidney Int. 2018;93(4):789–796. doi:10.1016/j.kint.2017.11.023
22. Levey AS, Stevens LA, Schmid CH, et al. A new equation to estimate glomerular filtration rate. Ann Intern Med. 2009;150(9):604–612. doi:10.7326/0003-4819-150-9-200905050-00006
23. Soliman S, Mohamed FA, Ismail FM, Stanley S, Saxena R, Mohan C. Urine angiostatin and VCAM-1 surpass conventional metrics in predicting elevated renal pathology activity indices in lupus nephritis. Int J Rheum Dis. 2017;20(11):1714–1727. doi:10.1111/1756-185X.13197
24. Nozaki Y, Kinoshita K, Yano T, et al. Estimation of kidney injury molecule-1 (Kim-1) in patients with lupus nephritis. Lupus. 2014;23(8):769–777. doi:10.1177/0961203314526292
25. Bethunaickan R, Berthier CC, Zhang W, et al. Identification of stage-specific genes associated with lupus nephritis and response to remission induction in (NZB × NZW)F1 and NZM2410 mice. Arthritis Rheumatol. 2014;66(8):2246–2258. doi:10.1002/art.38679
26. Davidson A. What is damaging the kidney in lupus nephritis? Nat Rev Rheumatol. 2016;12(3):143–153. doi:10.1038/nrrheum.2015.159
27. Yang S, Han Y, Liu J, et al. Mitochondria: a Novel Therapeutic Target in Diabetic Nephropathy. Curr Med Chem. 2017;24(29):3185–3202. doi:10.2174/0929867324666170509121003
28. Bhargava P, Schnellmann RG. Mitochondrial energetics in the kidney. Nat Rev Nephrol. 2017;13(10):629–646. doi:10.1038/nrneph.2017.107
29. Aparicio-Trejo OE, Tapia E, Sánchez-Lozada LG, Pedraza-Chaverri J. Mitochondrial bioenergetics, redox state, dynamics and turnover alterations in renal mass reduction models of chronic kidney diseases and their possible implications in the progression of this illness. Pharmacol Res. 2018;135.
30. Han P, Weng W, Chen Y, et al. Niclosamide ethanolamine attenuates systemic lupus erythematosus and lupus nephritis in MRL/lpr mice. Am J Transl Res. 2020;12(9):5015–5031.
31. Sampson AL, Singer RF, Walters GD. Uric acid lowering therapies for preventing or delaying the progression of chronic kidney disease. Cochrane Database Syst Rev. 2017;10:CD009460.
32. Moroni G, Vercelloni PG, Quaglini S, et al. Changing patterns in clinical-histological presentation and renal outcome over the last five decades in a cohort of 499 patients with lupus nephritis. Ann Rheum Dis. 2018;77(9):1318–1325. doi:10.1136/annrheumdis-2017-212732
33. Ichinose K, Kitamura M, Sato S, et al. Factors predictive of long-term mortality in lupus nephritis: a multicenter retrospective study of a Japanese cohort. Lupus. 2019;28(3):295–303. doi:10.1177/0961203319826690
 © 2024 The Author(s). This work is published and licensed by Dove Medical Press Limited. The full terms of this license are available at https://www.dovepress.com/terms.php and incorporate the Creative Commons Attribution - Non Commercial (unported, v3.0) License.
By accessing the work you hereby accept the Terms. Non-commercial uses of the work are permitted without any further permission from Dove Medical Press Limited, provided the work is properly attributed. For permission for commercial use of this work, please see paragraphs 4.2 and 5 of our Terms.
© 2024 The Author(s). This work is published and licensed by Dove Medical Press Limited. The full terms of this license are available at https://www.dovepress.com/terms.php and incorporate the Creative Commons Attribution - Non Commercial (unported, v3.0) License.
By accessing the work you hereby accept the Terms. Non-commercial uses of the work are permitted without any further permission from Dove Medical Press Limited, provided the work is properly attributed. For permission for commercial use of this work, please see paragraphs 4.2 and 5 of our Terms.