Back to Journals » Clinical Interventions in Aging » Volume 18
Association Between Timed Up-and-Go Test and Future Changes in the Frailty Status in a Longitudinal Study of Japanese Community-Dwelling Older Adults
Authors Wada Y, Shojima K, Tamaki K, Mori T, Kusunoki H, Onishi M, Tsuji S, Matsuzawa R, Nagai K ![]() , Sano K, Hashimoto K, Goto M, Nagasawa Y, Shinmura K
, Sano K, Hashimoto K, Goto M, Nagasawa Y, Shinmura K ![]()
Received 9 April 2023
Accepted for publication 11 July 2023
Published 28 July 2023 Volume 2023:18 Pages 1191—1200
DOI https://doi.org/10.2147/CIA.S413513
Checked for plagiarism Yes
Review by Single anonymous peer review
Peer reviewer comments 3
Editor who approved publication: Prof. Dr. Nandu Goswami
Yosuke Wada,1,2 Kensaku Shojima,1 Kayoko Tamaki,1 Takara Mori,1,3 Hiroshi Kusunoki,1,4 Masaaki Onishi,5 Shotaro Tsuji,5,6 Ryota Matsuzawa,7 Koutatsu Nagai,7 Kyoko Sano,8 Kana Hashimoto,9 Masashi Goto,10 Yasuyuki Nagasawa,1 Ken Shinmura1,10
1Department of General Internal Medicine, School of Medicine, Hyogo Medical University, Nishinomiya, Japan; 2Roppou Clinic, Toyooka, Hyogo, Japan; 3Amagasaki Medical COOP Honden Clinic, Amagasaki, Hyogo, Japan; 4Department of Internal Medicine, Osaka Dental University, Hirakata, Japan; 5Department of Orthopedic Surgery, School of Medicine, Hyogo Medical University, Nishinomiya, Japan; 6Department of Orthopedic Surgery, Tatsuno City Hospital, Tatsuno, Japan; 7Department of Physical Therapy, School of Rehabilitation, Hyogo Medical University, Kobe, Japan; 8Takarazuka Rehabilitation Hospital, Takarazuka, Japan; 9School of Pharmacy, Hyogo Medical University, Kobe, Japan; 10Department of General Medicine and Community Health Science, Hyogo Medical University, Sasayama Medical Center, Tambasasayama, Japan
Correspondence: Ken Shinmura, Department of General Internal Medicine, Hyogo Medical University, 1-1 Mukogawa-cho, Nishinomiya, Hyogo, 663-8501, Japan, Tel +81-798-45-6865, Fax +81-798-45-6977, Email [email protected]
Purpose: This study aimed to evaluate the relationship between timed up-and-go (TUG) test time and changes in frailty status in a longitudinal cohort study of rural Japanese older adults.
Patients and Methods: This prospective cohort study included 545 community-dwelling older adults. Initial and 2-year follow-up surveys were conducted. We compared the number of the Japanese version of the Cardiovascular Health Study components during the follow-up period and classified the participants into three groups: the favorable change, unchanged as prefrail, and unfavorable change groups. Associations between changes in frailty status and TUG time in the first survey were examined. The predictive ability of the TUG test was determined using the receiver operating characteristic (ROC) curve.
Results: The favorable change group comprised 315 individuals (57.8%), the unchanged as prefrail group 105 (19.2%), and the unfavorable change group 125 (22.9%). TUG time was associated with the favorable and unfavorable changes after adjustment for covariates (OR 0.79, 95% CI 0.68– 0.92, P=0.001 and OR 1.27, 95% CI 1.09– 1.49, P=0.002). The ROC curve of TUG time as a predictor of unfavorable changes showed an area under the curve of 0.59. A cut-off point of TUG was calculated as 6.3 s with 49.6% sensitivity and 66.0% specificity.
Conclusion: TUG time in the first survey was significantly associated with changes in frailty status 2 years later. However, its predictive value as a stand-alone test is limited and has the potential to predict future changes in the frailty status in older adults in combination with other tests.
Keywords: frailty, cardiovascular health study, older adults, physical function, timed up-and-go test
Introduction
Frailty is a geriatric state characterized by cumulative declines across multiple physiological systems. It is a state of increased vulnerability to stressors and causing adverse outcomes, including functional impairment, disability, and mortality.1
Frailty is a multidimensional concept; therefore, its diagnostic method has not been completely decided. The Fried frailty index2 frequently used in clinical settings focuses on physical components. Fried et al proposed that frailty syndrome was diagnosed based on the following five criteria: unintentional weight loss, self-reported exhaustion, low physical activity, slow gait speed, and weakness. Individuals with more than three variables were considered to be frail, and those with one or two variables were considered to be prefrail. This analysis revealed that frail and prefrail were predictive of adverse outcomes, including mortality. Therefore, frailty is a significant concern in superaged societies and non-aging societies. In Japan, the proportion of older adults is the highest worldwide. The estimated prevalence of frailty and prefrail among Japanese community-dwelling older people ranges from 7% to 17% and from 24% to 48%, respectively.3,4
Previous studies showed that frailty is a modifiable dynamic process characterized by frequent transitions among states over time.5,6 Therefore, adequate assessment and specific interventions could prevent or delay the progression of impairment and disability. However, whether a single-measure assessment, such as gait speed or handgrip strength, is sufficient to assess future changes in the frailty status remains controversial.
The timed up-and-go (TUG) test is a global measure of mobility.7 Increasing evidence has demonstrated that the TUG test is a useful predictor of falls,8–10 fracture incidence,11 future disability,12 mortality,13 and cognitive impairment.8,14 In addition to the TUG test, Short Physical Performance Battery (SPPB) is commonly used to evaluate physical function in older adults and recognized for its utility in maintaining higher physical functions and fewer comorbidities.15 However, the TUG test has the advantage of fewer evaluation components and a shorter administration time compared to SPPB. Frailty is considered the pre-stage of disability. In addition, individuals with frailty are at a higher risk for experiencing bone fracture resulting from falls.1 However, reports on the association between the TUG test and future change in the frailty status are few. The TUG test is simple, easy to perform, and an indicator of physical performance that can evaluate complex movements.16 This study was aimed at evaluating the relationship between TUG test results and future changes in the frailty status in a longitudinal cohort study involving rural Japanese community-dwelling older adults. We speculated that the TUG test might predict future changes in the frailty status in older adults by reflecting the reserve capacity of physical function.
Materials and Methods
Study Design and Participants
A prospective cohort analysis was designed and named the Frail Elderly in the Sasayama-Tamba Area (FESTA).17–19 The study population, comprising community-dwelling individuals aged 65 years old or more, was recruited from the Sasayama-Tamba area, a rural area in Japan. The inclusion criteria were as follows: (i) individuals aged 65 years and older living in the Sasayama-Tamba area, Hyogo Prefecture, and (ii) individuals who could visit the Sasayama Medical Center where the survey was conducted using any type of transportation. The exclusion criterion was the inability to walk independently (not merely the use of a stick). The initial survey was conducted between November 2015 and December 2017. The 2-year follow-up survey was conducted between April 2018 and December 2019.
Diagnosis of Frailty
The frailty phenotypes were characterized based on the number of the following five conditions measured using the Japanese version of CHS (J-CHS): slow gait speed, weakness, exhaustion, low activity, and weight loss.20 Participants who did not have any of these conditions were considered robust. To calculate walking speed, which was used as a stratification variable, the participants walked down a 12 m walkway at their preferred speed, and the time taken to reach 10 m was measured. Slow gait was established, according to a cut-off point < 1.0 m/s.21 Weakness was assessed using the maximum grip strength, which was measured in kilograms using a Smedley-type handheld dynamometer (GRIP-A; Takei Ltd., Niigata, Japan). Weakness was established, according to sex-specific cut-off points (< 28 kg for men and < 18 kg for women).22 Exhaustion was considered present if the participants responded “yes” to the following question, “In the last two weeks, have you felt tired without any reason?”. Physical activity was evaluated by asking the following question: “Do you engage in low levels of physical exercise aimed at health?” If participants answered “no” to the questions, they were classified into the low activity category. Weight loss was assessed by a response of “yes” to the question, “Have you lost 2 kg or more in the past six months?”
TUG
The TUG test requires a person to rise from a chair, walk 3 m as fast as possible without compromising safety, turn around a cone, walk back, and sit down.7 Participants could use their regular footwear and be allowed to use any mobility aid that they normally require. Timing started on the instructor’s “Go” and stopped when the person returned to the initial position. The TUG test was performed once and measured during the initial survey. A shorter time is indicative of a better physical performance.7
Other Variables
Participants’ age, sex, and comorbidities were self-reported. Mini-mental state examination (MMSE)23,24 was used to assess the global cognition level. We purchased the Japanese version of MMSE from Nihon Bunka Kagakusha Co., Ltd. (Tokyo, Japan). The geriatric depression scale (GDS) 15 was used to assess depressive symptoms.25,26 Participants were classified according to the GDS score as depressed (5 points or more) or non-depressed (4 points or less). Nutritional status was assessed by Mini nutritional assessment-short form (MNA-SF).27,28
Statistical Analyses
The participants’ characteristics assigned to the three groups regarding changes in frailty status were compared using the Kruskal–Wallis or chi-square test according to the type of variable. We also performed a pairwise comparison between two groups using the Steel-Dwass test as a post-hoc test. Multivariable logistic regression models (generalized linear models) were used to examine the associations between changes in the frailty status and TUG. This was a subgroup analysis stratified according to changes in the frailty status (favorable change, stable as prefrail, and unfavorable change). We adjusted for age and sex in model 1. In model 2, the frailty status, body mass index (BMI), numbers of comorbidities, MMSE score, and depression were added to model 1. The variables included both significant and non-significant ones in the regression model. Variables were selected based on their estimated association with changes in the frailty status and logical necessity for adjustment.
The predictive ability of the TUG test in identifying unfavorable changes in frailty status was determined using receiver operating characteristic (ROC) curves and area under the curve (AUC) analyses.29 The optimal cut-off points for TUG time to correctly distinguish those with unfavorable changes in frailty status from those without were calculated using ROC curve analysis. The time with the highest Youden’s index (sensitivity + specificity - 1) was determined to be the optimal cut-off point.
The data were analyzed using JMP version 15 (SAS Institute Japan Inc., Tokyo, Japan). Statistical significance was set at P < 0.05.
Results
Basic Characteristics of the Subgroups Divided by the Change in the Number of J-CHS Components
A total of 834 individuals participated in the first survey. Among them, 551 participated in the second survey. Six participants were excluded due to missing data. The mean age of 545 participants was 72 years. Of them, 357 were female (65.5%) and 188 were men (34.5%). Changes in the number of J-CHS components during the follow-up period are shown in Table 1. In the second survey 2 years later, 265 individuals exhibited a change in the number of J-CHS components, and 280 did not show any changes.
 |
Table 1 Changes in the Frailty Status Based on Changes in the Number of J-CHS Components |
Based on the change in the number of J-CHS components during the follow-up period, we divided the participants into three groups: the favorable change group (FCG), the unchanged as prefrail group (UPG), and the unfavorable change group (UCG) (Table 1).
When individuals showed an increase in the number of J-CHS components, they were assigned to the unfavorable change group. When individuals showed a decrease in the number of J-CHS components, they were assigned to the favorable change group. Among the 280 individuals without any changes in the number of J-CHS components, we assigned the robust individuals (0 positive component) to the FCG because their frailty status remained favorable. Among individuals without any changes in the number of J-CHS components, we assigned individuals with three positive J-CHS components to the UCG because their frailty status remained unfavorable.
Finally, the FCG, UPG, and UCG contained 315 (57.8%), 105 (19.2%), and 125 (22.9%) individuals, respectively (Table 2).
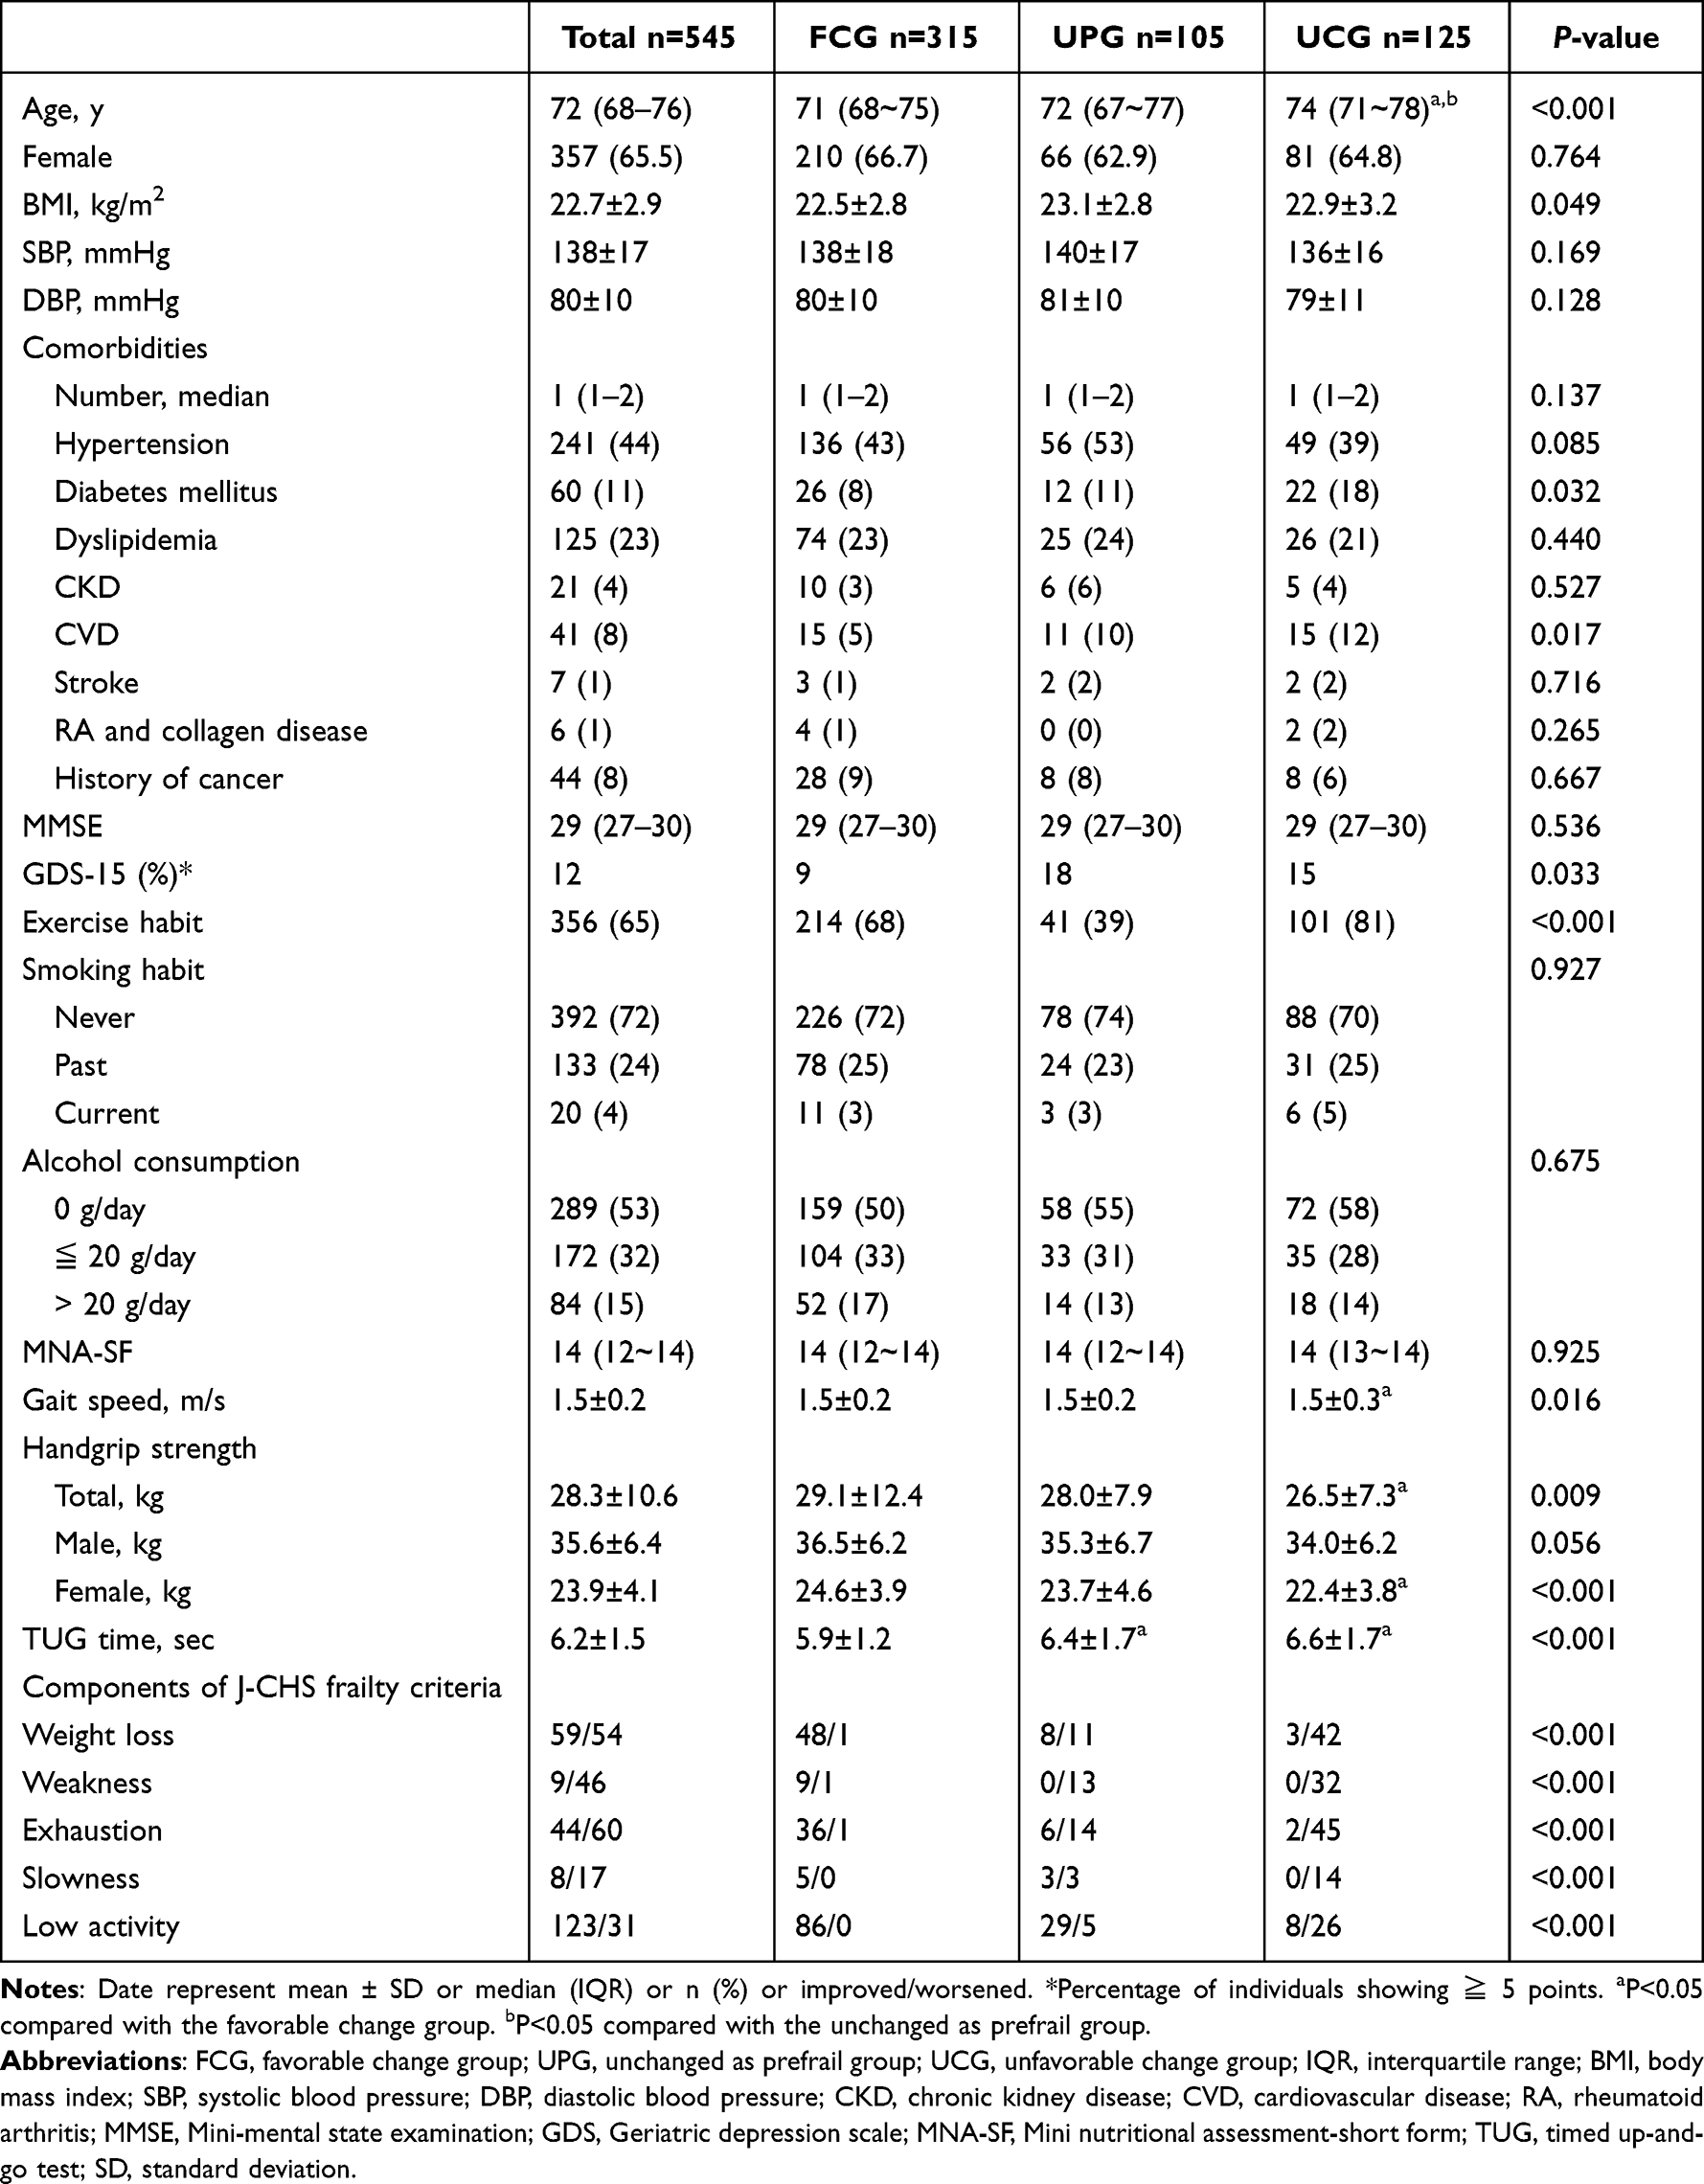 |
Table 2 Baseline Characteristics of the Study Participants |
Age was higher in the UCG than in the other groups. BMI was the highest in the UPG among the three groups. Significant differences were observed in the prevalence of diabetes and cardiovascular disease (CVD) among the three groups. There was a significant difference in the ratio of individuals with GDS scores of more than 5 points and that of individuals with exercise habits among the three subgroups. In the UCG, gait speed was slower than the FCG, and grip strength in females was lower than the FCG. The TUG time was longer in the UPG and the UCG than in the FCG.
In the FCG, 27.3% of the participants showed improvement in low activity, 15.2% in weight loss, and 11.4% in exhaustion. In the UCG, 36.0% newly complained of exhaustion, 33.6% experienced weight loss, and 25.6% experienced weakness. Unchanged individuals as prefrail had a combination of worsening and improved cases (Table 2).
Logistic Regression Analysis Regarding Factors Contributing to Changes in the Frailty Status
Multivariable logistic regression analysis showed that the TUG time was significantly associated with changes in frailty status (Table 3).
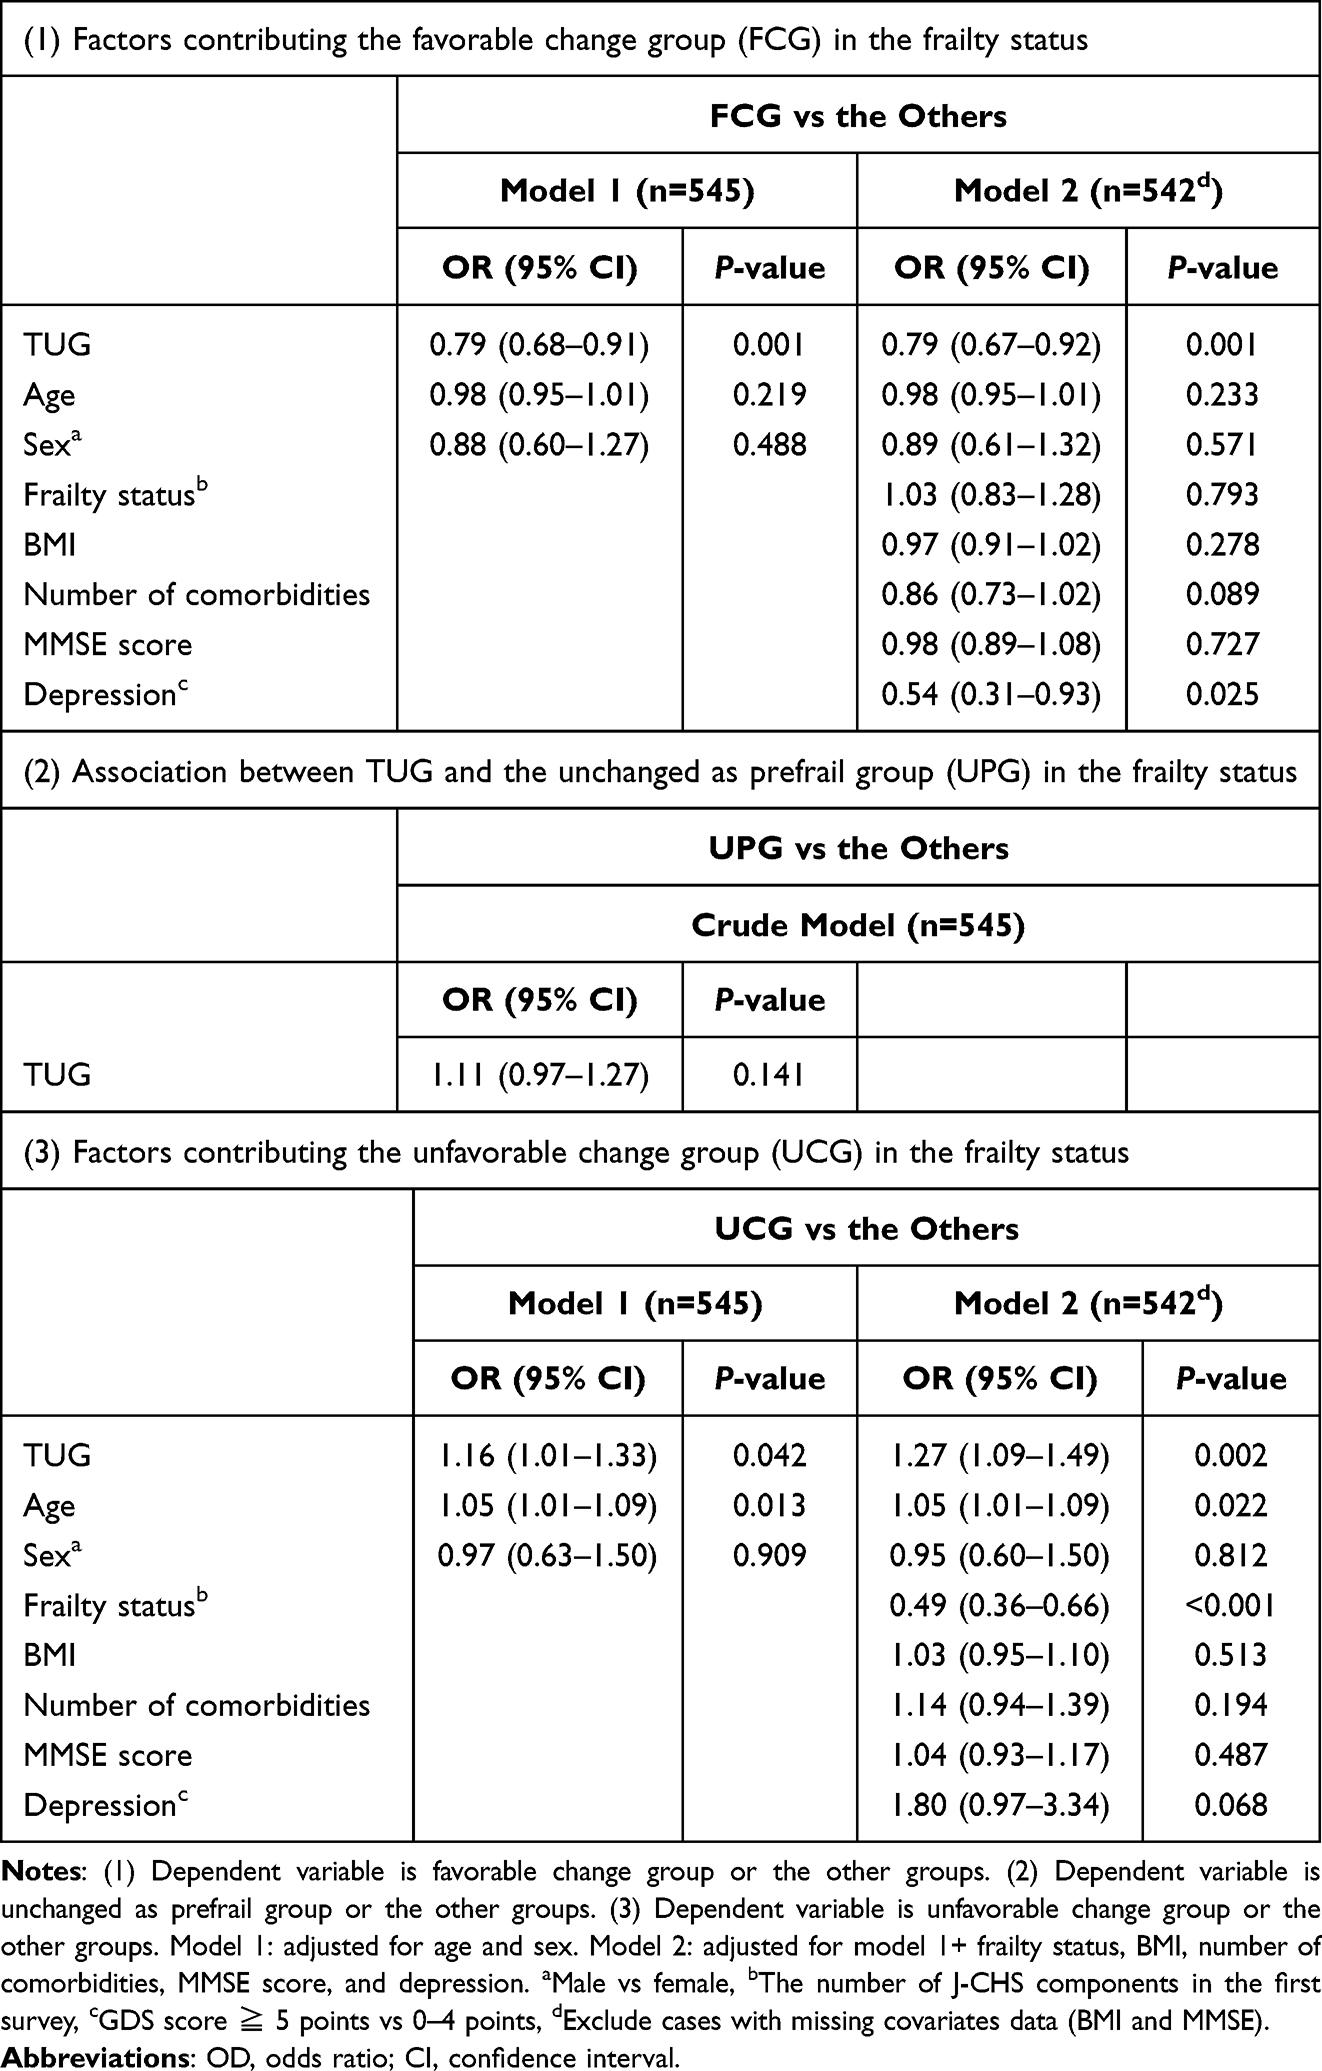 |
Table 3 Logistic Regression Analysis Regarding Factors Contributing to Changes in the Frailty Status |
TUG was associated with the favorable change in model 1 (odds ratio [OR] 0.79, 95% confidence interval [CI] 0.68–0.91, P = 0.001). In model 2, TUG (OR 0.79, 95% CI 0.68–0.92, P = 0.001) and low GDS score (OR 0.54, 95% CI 0.31–0.93, P = 0.025) were associated with the favorable change. Slower TUG time (OR 1.16, 95% CI 1.01–1.33, P = 0.042 and OR 1.27, 95% CI 1.09–1.49, P = 0.002), and older age (OR 1.05, 95% CI 1.01–1.09, P = 0.013 and OR 1.05, 95% CI 1.01–1.09, P = 0.022) were associated with the unfavorable change in both models 1 and 2. Fewer positive J-CHS components (OR 0.49, 95% CI 0.36–0.66, P < 0.001) were associated with the unfavorable change in model 2.
Predictive Ability of the TUG
The ROC curve of TUG time as a predictor of unfavorable change showed that the AUC was 0.59 in this study (Figure 1). The highest Youden’s index was 0.16, with a cut-off point of 6.3 s. With this cut-off point, the TUG time had 49.6% sensitivity and 66.0% specificity. Thus, the TUG time indicates the limited predictive ability for unfavorable change.
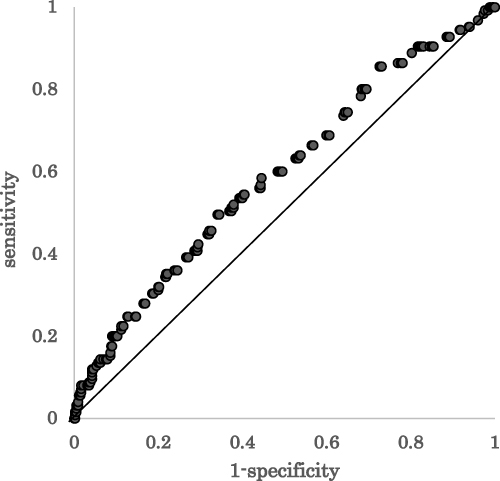 |
Figure 1 Receiver operating characteristic curve of TUG test time as a predictor of unfavorable change. Area under the curve=0.59. |
Discussion
In the present study, we demonstrated several novels and interesting findings regarding the usefulness of the TUG test in community-dwelling older adults. First, the TUG time was significantly associated with future changes in frailty status among older residents of a Japanese rural area. After adjusting for confounding factors, the TUG time at baseline was associated with either favorable or unfavorable changes in frailty status two years later. Previous studies demonstrated that TUG time was associated with hospitalization and mortality within 1 year,13 and an episode of falls within 6 months.10 However, the association between the TUG test results and changes in future frailty status has not been reported in a longitudinal cohort study, which is highlighted in the present study. Frailty is considered the pre-stage of disability and deemed to be reversible. Predicting the progression or improvement of the frailty status in the future is highly significant because it enables early intervention for high-risk individuals. Frailty is a multi-component, dynamic process, and the scale used provides a single perspective. This limitation could be overcome by using clinical frailty scales or frailty indices that provide cumulative information. Frailty scales consisting of multiple items have superior predictive ability for adverse events in the future compared to TUG alone.30,31 However, measuring multiple-item scales in clinical settings is difficult; therefore, the advantage of TUG lies in its simplicity and ease of measurement.
In this study, we determined the cut-off TUG time for predicting unfavorable changes in frailty status using the ROC curve. The cut-off level of conventional TUG time is 12 or 15 s for assessing the risk of falls9,10,32 and 9 s for predicting future events composed of falls, hospitalization, and death.13 The TUG time was significantly faster in the present study than in previous studies.9,10,13,32 Both the sample population and methodological issues may be attributed to this result. Regarding the sample population, the study participants were residents from a local area who could arrive at the survey venue by themselves, and they can be considered relatively healthy individuals in terms of physical ability. As for the methodological issues related to TUG measurement, instructing the participants to “walk as fast as possible” instead of “walk at a comfortable pace” may have contributed to the faster TUG times in the present study. Other studies in which the TUG test was conducted with instructions to “walk as fast as possible” in community-dwelling older adults have been reported.33,34 The mean TUG time was 6 s in the 60s age group and 7 s in the 70s age group when similar instructions were provided during the TUG test.33 These values are similar to those obtained in the present study. A previous study reported that the TUG possesses high reliability to perform as quickly as possible while evaluating physical functions of older adults in rural areas.34 These instructions should be differentiated based on the characteristics of the participants. Particularly, using the former instructions for patients with disabilities or residual symptoms after cerebrovascular disorders and the latter instructions for relatively healthy older adults would be a viable approach. Thus, the instructions in this study are appropriate for assessing the frailty status in the future.
Furthermore, the Japanese population may have a different walking speed. The previous studies involving community-dwelling Japanese older adults demonstrated that the usual walking speed ranged from 1.2 to 1.4 m/s.35,36 Additionally, a meta-analysis suggested that Japanese older adults have a faster usual walking speed during the 5-m walking test compared to non-Asian older adults.37 Another meta-analysis suggested that the TUG time in Japanese healthy older adults was faster than in African Americans and Caucasians.38 These differences may be attributed to societal environmental factors, such as greater use of public transportation in Japan and lifestyle habits that are globally recognized as higher levels of physical activity in the Japanese population.
The TUG test is an assessment tool for physical function in older adults and includes complex elements. Thus, we speculate that this complexity is responsible for predicting future changes in the frailty status of older adults. According to a report that evaluated the complex elements of TUG using a three-dimensional movement analysis system, much more time was spent on sitting movement (back-to-sit transfer) than on rising movement (sit-to-stand transfer) and the forward bending angle of the trunk at the time of rising and sitting became smaller in frail individuals than in non-frail individuals.39 The former is explained by the fact that it is more difficult for older adults to maintain balance while sitting because visual information is lacking, and gravity increases during sitting but not during the rising movement. The latter was examined because motor prediction is impaired in older adults. It is thought that TUG test can assess the ability to not only walk but also balance at the time of rising and sitting, and executive brain functions in this way. Because frailty is composed of multifactorial components closely associated with a decline in physical and psycho-neurological functions, the TUG test can likely predict changes in frailty status in the near future. We concluded that TUG is easily available for group medical check-ups, and useful for screening high-risk groups, whereby the frailty status is more likely to advance in the future. Recent studies demonstrated significant correlations between TUG subtasks and contractile muscle properties evaluated by tensiomyography.40,41 Therefore, TUG subtask measurements may be more useful for the prediction of changes in the frailty status.
Unfortunately, the AUC was 0.59, and the predictive ability of the TUG test for unfavorable changes in future frailty status was not high. In the unfavorable change group, there were more individuals with worsening fatigue and weight loss than those with decreased physical function. Therefore, psychological factors contributed, at least in part, to the worsening frailty status of the participants in this study. Although the TUG test is a prominent system that can evaluate overall physical function in older adults, it is reasonable to assume that there is a limitation in predicting future changes in frailty status using the TUG alone. Therefore, we conclude that the combination of the TUG test with other indexes enables easier prediction of future frailty status in older adults.
This study has some limitations. First, a participation selection bias might exist because only older adults who had voluntarily participated in the medical check-up were enrolled. We recruited community-dwelling older adults to participate using a community advertisement in a local newspaper, placing posters at the Sasayama Medical Center and oral announcements by medical staff in the city. This may have resulted in a bias, as the recruited participants were relatively healthy and had a low proportion of frailty. Second, the follow-up rate was not high (66%). Our study included individuals who could come to the establishment where the survey was conducted using any type of transportation. Therefore, many participants failed to complete the follow-up survey because public transportation is limited in the Tamba-Sasayama area. In particular, individuals who experienced a decline in physical function may have dropped out of the follow-up survey. Therefore, it is necessary to carefully interpret the analysis results regarding factors contributing to unfavorable changes in the frailty status. Third, the presence of diabetes mellitus may have a potential association with predicting future changes in the frailty status in older adults because diabetes mellitus is strongly associated with the existence of frailty.42 The proportion of diabetes mellitus was significantly higher in the UCG (Table 2). However, we measured blood glucose levels without dietary restrictions, and the presence of diabetes mellitus was determined based on self-reporting. The potential association between the presence of diabetes mellitus and predicting future changes in the frailty status is an important topic for future research.
While the potential of the TUG test has been established in the present study, its predictive ability for future changes in the frailty status is not high. This is likely because of the complexity of the frailty status and its components, such as exhaustion and muscle weakness, which may be challenging to predict with TUG alone. Therefore, investigating whether or not combining assessments related to endurance and body composition, for example, could enhance the predictive ability for future changes in the frailty status would be valuable. This could be explored through longitudinal studies.
Conclusion
In conclusion, we investigated the relationship between TUG time and frailty in a longitudinal study of community-dwelling 545 older adults and found that TUG time was associated with changes in frailty status. However, its predictive value as a stand-alone test is limited. The TUG test should be used in combination with other tests to predict changes in the frailty status.
Ethical and Consent Statement
Participant received oral and written explanations concerning the study and provided written consent prior to the commencement of the study. This study was conducted in accordance with the Declaration of Helsinki, and the Institutional Review Board of Hyogo College of Medicine approved the FESTA study, which complied with the current laws of Japan (approval no. Rinhi0342).
Acknowledgments
We would like to appreciate the medical staff at Sasayama Medical Center, Hyogo College of Medicine for their assistance.
Funding
This study was supported in part by the JSPS KAKENHI (grant number: 22K19496) (2022), Uehara Memorial Foundation (202120105), and National Center for Geriatrics and Gerontology (Choujyu 20-1) (2022) (Dr. Shinmura). The authors certify that they comply with the ethical guidelines for authorship and publishing in Clinical Interventions in Aging.
Disclosure
All authors declare no conflict of interest.
References
1. Clegg A, Young J, Iliffe S, Rikkert M, Rockwood K. Frailty in elderly people. Lancet. 2013;381:752–762. doi:10.1016/S0140-6736(12)62167-9
2. Fried LP, Tangen CF, Walston J, et al. Frailty in older adults: evidence for a phenotype. J Gerontol a Biol Sci Med Sci. 2001;56:M146–56. doi:10.1093/gerona/56.3.M146
3. Kojima G, Iliffe S, Taniguchi Y, et al. Prevalence of frailty in Japan: a systematic review and meta-analysis. J Epidemiol. 2017;27:347–353. doi:10.1016/j.je.2016.09.008
4. Hirose T, Sawaya Y, Ishizaka M, et al. Frailty under COVID −19 pandemic in Japan: changes in prevalence of frailty from 2017 to 2021. J Am Geriatr Soc. 2023;71:1603–1609. doi:10.1111/jgs.18237
5. Gill TM, Gahbauer EA, Allore HG, et al. Transitions between frailty states among community-living older persons. Arch Intern Med. 2006;166:418–423. doi:10.1001/archinte.166.4.418
6. Lee JS, Auyeung TW, Leung J, Kwok T, Woo J. Transitions in frailty states among community-living older adults and their associated factors. J Am Med Dir Assoc. 2014;15:281–286. doi:10.1016/j.jamda.2013.12.002
7. Podsiadlo D, Richardson S. The Timed “Up & Go”: a test of basic functional mobility for frail elderly persons. J Am Geriatr Soc. 1991;39:142–148. doi:10.1111/j.1532-5415.1991.tb01616.x
8. Ibrahim A, Singh D, Shahar S. ‘Timed Up and Go’ test: age, gender and cognitive impairment stratified normative values of older adults. PLoS One. 2017;12:e0185641. doi:10.1371/journal.pone.0185641
9. Kang L, Han P, Wang J, et al. Timed up and go test can predict recurrent falls: a longitudinal study of the community-dwelling elderly in China. Clin Interv Aging. 2017;12:2009–2016. doi:10.2147/CIA.S138287
10. Kojima G, Masud T, Kendrick D, et al. Does the timed up and go test predict future falls among British community-dwelling older people? Prospective cohort study nested within a randomised controlled trial. BMC Geriatr. 2015;15:38. doi:10.1186/s12877-015-0039-7
11. Jeong SM, Shin DW, Han K, et al. Timed up-and-go test is a useful predictor of fracture incidence. Bone. 2019;127:474–481. doi:10.1016/j.bone.2019.07.018
12. Lee J, Chun H, Kim Y, et al. Association between timed up and go test and subsequent functional dependency. J Korean Med Sci. 2020;35(3): e25. doi:10.3346/jkms.2020.35.e25
13. Batko-Szwaczka A, Wilczyński K, Hornik B, et al. Predicting adverse outcomes in healthy aging community-dwelling early-old adults with the timed up and go test. Clin Interv Aging. 2020;15:1263–1270. doi:10.2147/CIA.S256312
14. Kim G, Kim B, Kim DR, et al. An association between lower extremity function and cognitive frailty: a sample population from the KFACS Study. Int J Environ Res Public Health. 2021;18(3): 1007. doi:10.3390/ijerph18031007
15. Vergara I, Mateo-Abad M, Saucedo-Figueredo MC, et al. Description of frail older people profiles according to four screening tools applied in primary care settings: a cross sectional analysis. BMC Geriatr. 2019;19:342. doi:10.1186/s12877-019-1354-1
16. Ansai JH, Farche ACS, Rossi PG, et al. Performance of different timed up and go subtasks in frailty syndrome. J Geriatr Phys Ther. 2019;42:287–293. doi:10.1519/JPT.0000000000000162
17. Hasegawa Y, Sakuramoto A, Sugita H, et al. Relationship between oral environment and frailty among older adults dwelling in a rural Japanese community: a cross-sectional observational study. BMC Oral Health. 2019;19:23. doi:10.1186/s12903-019-0714-8
18. Kusunoki H, Tsuji S, Wada Y, et al. Relationship between sarcopenia and the serum creatinine/cystatin C ratio in Japanese rural community-dwelling older adults. JCSM Clin Rep. 2018;3:1–14. doi:10.17987/jcsm-cr.v3i1.57
19. Tamaki K, Kusunoki H, Tsuji S, et al. The relationship between dietary habits and frailty in rural Japanese community-dwelling older adults: cross-sectional observation study using a brief self-administered dietary history questionnaire. Nutrients. 2018;10:1982. doi:10.3390/nu10121982
20. Satake S, Shimada H, Yamada M, et al. Prevalence of frailty among community-dwellers and outpatients in Japan as defined by the Japanese version of the cardiovascular health study criteria. Geriatr Gerontol Int. 2017;17:2629–2634. doi:10.1111/ggi.13129
21. Shimada H, Suzuki T, Suzukawa M, et al. Performance-based assessments and demand for personal care in older Japanese people: a cross-sectional study. BMJ Open. 2013;3 e002424. doi:10.1136/bmjopen-2012-002424.
22. Chen LK, Woo J, Assantachai P, et al. Asian Working Group for Sarcopenia: 2019 consensus update on sarcopenia diagnosis and treatment. J Am Med Dir Assoc. 2020;21:300–307. doi:10.1016/j.jamda.2019.12.012
23. Folstein MF, Folstein SE, McHugh PR. ”Mini-mental state”. A practical method for grading the cognitive state of patients for the clinician. J Psychiatr Res. 1975;12:189–198. doi:10.1016/0022-3956(75)90026-6
24. O’Connor DW, Pollitt A, Hyde JB, et al. The reliability and validity of the mini-mental state in a British community survey. J Psychiatr Res. 1989;23:87–96. doi:10.1016/0022-3956(89)90021-6
25. Sheikh JI, Yesavage JA. Geriatric Depression Scale (GDS): recent evidence and development of a shorter version. Clin Gerontol. 1986;5:165–172. doi:10.1300/J018v05n01_09
26. Durmaz B, Soysal P, Ellidokuz H, et al. Validity and reliability of geriatric depression scale-15 (short form) in Turkish older adults. North Clin Istanb. 2018;30:216–220. doi:10.14744/nci.2017.85047
27. Rubenstein LZ, Harker Judith O, Antoni S, et al. Screening for undernutrition in geriatric practice: developing the Short-Form Mini-Nutritional Assessment (MNA-SF). J Gerontol a Biol Sci Med Sci. 2001;56:M366–M372. doi:10.1093/gerona/56.6.M366
28. Kather F, Hadzic M, Hehle T, et al. Test-retest reliability of the Mini Nutritional Assessment-Short Form (MNA-SF) in older patients undergoing cardiac rehabilitation. J Geriatr Cardiol. 2020;17:574–579. doi:10.11909/j.issn.1671-5411.2020.09.007
29. Hanley JA, McNeil BJ. The meaning and use of the area under a receiver operating characteristic (ROC) curve. Radiology. 1982;143:29–36. doi:10.1148/radiology.143.1.7063747
30. Mitnitski AB, Mogilner AJ, Rockwood K. Accumulation of deficits as a proxy measure of aging. Sci World J. 2001;8:323–336. doi:10.1100/tsw.2001.58
31. Rockwood K, Song X, MacKnight C, et al. A global clinical measure of fitness and frailty in elderly people. CMAJ. 2005;30:489–495. doi:10.1503/cmaj.050051
32. Ibeneme SC, Eze JC, Okonkwo UP, et al. Evaluating the discriminatory power of the velocity field diagram and timed-up-and-go test in determining the fall status of community-dwelling older adults: a cross-sectional observational study. BMC Geriatr. 2022;22:658. doi:10.1186/s12877-022-03282-2
33. Coelho-Junior HJ, Uchida MC, Gonçalves IO, et al. Age- and gender-related changes in physical function in community-dwelling Brazilian adults aged 50 to 102 years. J Geriatr Phys Ther. 2021;44:E123–E131. doi:10.1519/JPT.0000000000000246
34. Gafner S, Allet L, Hilfiker R, et al. Reliability and diagnostic accuracy of commonly used performance tests relative to fall history in older persons: a systematic review. Clin Interv Aging. 2021;16:1591–1616. doi:10.2147/CIA.S322506
35. Hirono T, Ikezoe T, Yamagata M, et al. Age-related changes in gait speeds and asymmetry during circular gait and straight-line gait in older individuals aged 60–79 years. Geriatr Gerontol Int. 2021;21:404–410. doi:10.1111/ggi.14150
36. Kawai H, Taniguchi Y, Seino S, et al. Reference values of gait parameters measured with a plantar pressure platform in community-dwelling older Japanese adults. Clin Interv Aging. 2019;4:1265–1276. doi:10.2147/CIA.S213216
37. Ando M, Kamide N. Japanese elderly persons walk faster than non-Asian elderly persons: a meta-regression analysis. J Physi Ther Sci. 2015;27:3481–3485. doi:10.1589/jpts.27.3481
38. Kamide N, Takahashi K, Shiba Y. Reference values for the timed up and go test in healthy Japanese elderly people: determination using the methodology of meta-analysis. Geriatr Gerontol Int. 2011;11:445–451. doi:10.1111/j.1447-0594.2011.00704.x
39. Hassani A, Kubicki A, Brost V, et al. Kinematic analysis of motor strategies in frail aged adults during the timed up and go: how to spot the motor frailty? Clin Interv Aging. 2015;10:505–513. doi:10.2147/CIA.S74755
40. Ziegl A, Hayn D, Kastner P, et al. Quantification of the link between timed up-and-go test subtasks and contractile muscle properties. Sensors. 2021;21:6539. doi:10.3390/s21196539
41. Fabiani E, Herc M, Šimunič B, et al. Correlation between timed up and go test and skeletal muscle tensiomyography in female nursing home residents. Musculoskelet Neuronal Interact. 2021;21:247–254.
42. Hubbard RE, Andrew MK, Fallah N, et al. Comparison of the prognostic importance of diagnosed diabetes, co-morbidity and frailty in older people. Diabet Med. 2010;27:603–606. doi:10.1111/j.1464-5491.2010.02977.x
 © 2023 The Author(s). This work is published and licensed by Dove Medical Press Limited. The
full terms of this license are available at https://www.dovepress.com/terms
and incorporate the Creative Commons Attribution
- Non Commercial (unported, 3.0) License.
By accessing the work you hereby accept the Terms. Non-commercial uses of the work are permitted
without any further permission from Dove Medical Press Limited, provided the work is properly
attributed. For permission for commercial use of this work, please see paragraphs 4.2 and 5 of our Terms.
© 2023 The Author(s). This work is published and licensed by Dove Medical Press Limited. The
full terms of this license are available at https://www.dovepress.com/terms
and incorporate the Creative Commons Attribution
- Non Commercial (unported, 3.0) License.
By accessing the work you hereby accept the Terms. Non-commercial uses of the work are permitted
without any further permission from Dove Medical Press Limited, provided the work is properly
attributed. For permission for commercial use of this work, please see paragraphs 4.2 and 5 of our Terms.
Recommended articles
Combined Vision and Hearing Impairment is Associated with Frailty in Older Adults: Results from the West China Health and Aging Trend Study
Zhao Y, Ding Q, Lin T, Shu X, Xie D, Gao L, Yue J
Clinical Interventions in Aging 2022, 17:675-683
Published Date: 2 May 2022
Experiences of Being Significant Others to Older Adults with Frailty Living Alone in Rural Arctic Norway: A Qualitative Study
Bjerkmo L, Helgesen AK, Blix BH
Risk Management and Healthcare Policy 2022, 15:1283-1292
Published Date: 1 July 2022
Intrinsic Capacity Declines with Elevated Homocysteine in Community-Dwelling Chinese Older Adults
Lin S, Wang F, Zheng J, Yuan Y, Huang F, Zhu P
Clinical Interventions in Aging 2022, 17:1057-1068
Published Date: 7 July 2022
An Easy-to-Implement Clinical-Trial Frailty Index Based on Accumulation of Deficits: Validation in Zoster Vaccine Clinical Trials

Andrew MK, Matthews S, Kim JH, Riley ME, Curran D
Clinical Interventions in Aging 2022, 17:1261-1274
Published Date: 19 August 2022
Recognition and Management of Hospital-Acquired Sepsis Among Older General Medical Inpatients: A Multi-Site Retrospective Study
Barker N, Scott IA, Seaton R, Mehta N, Kalke VR, Redpath L
International Journal of General Medicine 2023, 16:1039-1046
Published Date: 21 March 2023