Back to Journals » Clinical, Cosmetic and Investigational Dermatology » Volume 16
Association Between the Diabetic Foot Ulcer and the Bacterial Colony of the Skin Based on 16S rRNA Gene Sequencing: An Observational Study
Authors Zhang XN, Wu CY, Wu ZW, Xu LX, Jiang FT, Chen HW
Received 14 June 2023
Accepted for publication 19 September 2023
Published 10 October 2023 Volume 2023:16 Pages 2801—2812
DOI https://doi.org/10.2147/CCID.S425922
Checked for plagiarism Yes
Review by Single anonymous peer review
Peer reviewer comments 4
Editor who approved publication: Dr Anne-Claire Fougerousse
Xiu-Ni Zhang,1 Cui-Yi Wu,2 Zhi-Wei Wu,1 Li-Xian Xu,3 Feng-Ting Jiang,1 Han-Wei Chen4
1Department of Trauma Orthopedics, Panyu Central Hospital, Guangzhou, Guangdong, 511400, People’s Republic of China; 2Department of Outpatient, Panyu Central Hospital, Guangzhou, Guangdong, 511400, People’s Republic of China; 3Department of Endocrinology, Panyu Central Hospital, Guangzhou, Guangdong, 511400, People’s Republic of China; 4Administrative Office, Panyu District Health Management Center, Guangzhou, Guangdong, 511400, People’s Republic of China
Correspondence: Xiu-Ni Zhang, Email [email protected]
Objective: Microorganisms have been the main cause of refractory and high recurrence of diabetic foot ulcer (DFU). This study attempted to observe the skin bacterial colony in healthy skin, diabetic skin and DFU skin.
Methods: Forty-eight diabetes patients were recruited at Panyu Central Hospital from March 2021 to March 2022 and divided into DFU group (T group, n = 22), diabetes without foot ulcer group (TW group, n = 26). Besides, a healthy control group (H group, n = 10) was recruited at the same time. The swab samples of foot skin in the same position in the three groups were collected. The microorganisms obtained from the skin were analyzed by 16S rRNA gene sequencing. The composition of the skin microorganisms was determined, and the species diversity of the skin microbiota was analyzed by α and β diversity. The species differences in the skin microbiota and the relative abundance of different operational taxonomic units (OUTs) with the most significant abundance were analyzed by linear discriminant analysis effect size (LEfSe).
Results: Significant changes were found in the composition of the skin microbiota in the T and TW groups relative to the H group. However, the species diversity of the skin microbiota was significantly reduced in the T and TW groups, with the lowest one in the T group. The composition of microbial diversity in the T group was significantly different from that of the TW and H groups. Among the skin bacterial colonies, the abundance of Staphylococcus, Enhydrobacter, and Corynebacterium_1 was obviously reduced, while that of Escherichia coli and Pseudomonas was significantly increased.
Conclusion: Changes in the abundance of Staphylococcus, Enhydrobacter, Corynebacterium_1, Escherichia coli and Pseudomonas in the skin bacterial colonies can be the main causative factors for DFU. This study indicates that altering the microbiota composition of wounds may help the treatment of DFU.
Keywords: diabetes, foot ulcers, skin bacterial colony, 16S rRNA gene sequencing
Corrigendum for this paper has been published.
Introduction
Diabetes is a growing public health problem with increasing prevalence and mortality that threatens the health of people globally.1 In 2021, the global prevalence of diabetes in adults aged 20 to 79 years was estimated at 537 million, mainly caused by type 2 diabetes, and the number is expected to reach 783 million by 2045.2 Among these, diabetic foot ulcer (DFU) is a common complication with a high prevalence among diabetic patients.3 The International Working Group on Diabetic Foot (IWGDF) defines DFU as: patients with initial diabetes or a history of diabetes have ulcers in the foot, usually with lower limb neuropathy and/or peripheral arterial disease (PAD).4 Some studies have shown that 19–34% of diabetic patients may be affected by DFU during their lifetime, while the International Diabetes Federation reports that 9.1–26.1 million people will develop DFU each year.5 Moreover, DFU has a high mortality rate. Data show that DFU is associated with 5% of deaths within the first 12 months of diabetes onset, and 42% of deaths within 5 years of diabetes onset.6 DFU treatments should follow a multidisciplinary approach, such as local epidemiology-based antibiograms, personalized treatment, regular debridement, periodic wound assessment, and dressing changes, which requires years of experience in treating the condition7. Unfortunately, the failure rate for DFU patients to heal within a year of treatment is up to 20%, and the recurrence rate is as high as 40%.8 It is obvious that the unidentified mechanisms underlying the genesis and maintenance of DFUs make their treatment difficult. Therefore, additional research into the mechanisms is necessary to enhance the effectiveness of DFU treatment.
DFU is a chronic skin disease. Previous studies have shown that the healing and recurrence of chronic skin wounds are associated with altered bacterial diversity and instability in the microbiota composition of the wound.9 Skin microbiota plays an ambivalent role in wound healing, altering the microbiota composition of wounds directly affects their healing potential. On the one hand, some bacterial species can hinder the wound healing process and lead to chronic wounds; on the other hand, some bacterial species can accelerate the wound healing process and suppress the colonization of pathogens.10,11 There is a significant difference in skin microbial composition between diabetic and non-diabetic patients. Compared to healthy mice, a significant increase in Staphylococcus, Aerococcus, Porphyromonadaceae and Proteobacteria as well as an obvious decline in Streptococcus, Lachnospiraceae, and Acinetobacter were observed in the wounds of diabetic mice.12 There also exists a number of reports on the microbiota of DFU. For example, Gardner et al found that Staphylococcus, especially S. aureus, was the most common organism in the DFU skin. They also reported that the depth of diabetic ulcer was positively correlated with the amount of anaerobe and negatively correlated with the amount of Staphylococcus, and that ulcer duration was positively correlated with the species diversity, richness and relative abundance of Proteobacteria.13 Besides, it has been shown that DFU patients exhibit more pairs of pathogenic microorganisms, such as Candida and Pseudomonas.14 It is evident that alterations in the microbiota may be a major factor in the development of DFU. However, the wide variety of microorganisms and the multiple microbial properties usually present in DFU result in potentially diverse results of bacterial identification. Therefore, additional information is required to clarify the association between DFU and skin bacterial colony. The aim of this study was to look at the bacterial colonies in healthy skin, diabetic skin and DFU skin and to screen for organisms that mediate key changes in the bacterial colonies using 16S rRNA gene sequencing. It is anticipated that this study will shed fresh light on the relationship between DFU and microorganisms.
Materials and Methods
Study Subjects
A total of 48 patients with diabetes aged 18 years or older were recruited at Panyu Central Hospital from March 2021 to March 2022, including 22 patients with DFU (T group), 26 diabetic patients without foot ulcers (TW group), and 10 healthy volunteers (H group). Inclusion criteria: (1) patients were diagnosed with diabetes according to the diagnostic criteria of American Diabetes Association;15 (2) patients with foot ulcers had an explicit ulcer on the foot or a recurrent foot ulcer for at least 6 months. Exclusion criteria: (1) patients received antibiotic therapy one week prior to sample collection; (2) patients were combined with active wound infection, untreated osteomyelitis, gangrene, immunocompromised disease; (3) wounds were unrelated to diabetes or its complications; and (4) patients with tumors.16 The flow chart of the study process was showed in Figure 1. This study was approved by the ethics committee of the Ethics Committee of Panyu Central Hospital (ethics number: PYRC-2020-008).
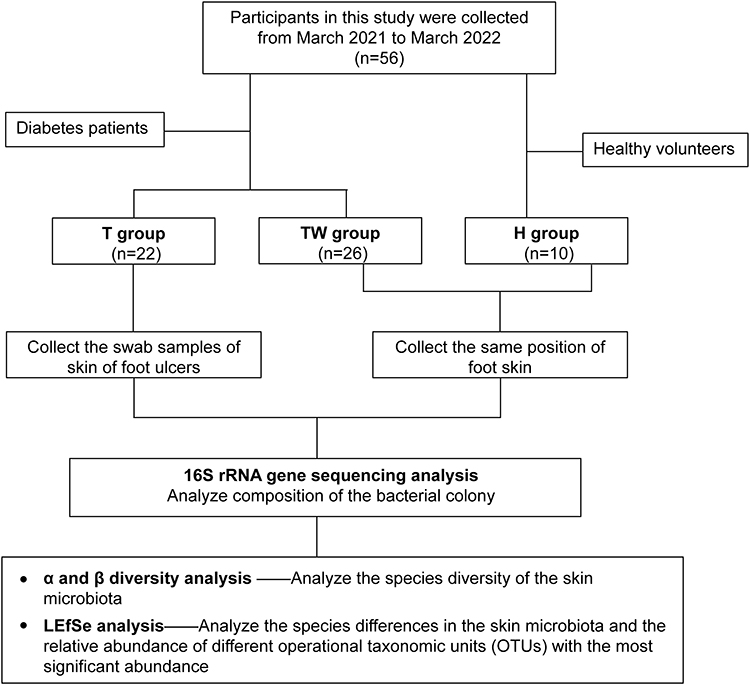 |
Figure 1 A flow chart of study process. |
DNA Extraction
The swab was removed and moistened the tip with sterile saline. The skin of the foot ulcer area in T group (including toe, heel, sole, medial, lateral and dorsal side of the foot) was swabbed. At the same time, the skin of the foot was swabbed in the same position in TW group and H group. Then, the swabs with samples were quickly placed into the sampling tube, snapped the break against the wall of the mouth of the 2 mL collection tube, and left the swab head inside the liquid of the sampling tube. At least two swab samples were collected from each patient. The collected samples were immediately frozen in collection tubes at −2 °C~-5 °C. DNA was subsequently extracted from the skin swabs using a Bacterial Genomic DNA Isolation Kit (DP302, TIANGEN) and sequenced using a 16S rDNA amplicon.
16S rRNA Gene Sequencing
The obtained bacterial DNA was used as a template to amplify the V3-V4 region of the bacterial 16S rRNA gene using PCR. The sequences of the primers used were 343F: 5’- TACGGRAGGCAGCAG-3’ and 798R: 5’- AGGGTATCTAATCCT −3’. The obtained PCR products were subjected to 1% agarose gel electrophoresis (120 V, 30 min). The concentration of the collected DNA was detected using Qubit® 2.0 (Qubit Flex, Invitrogen). The prepared libraries were then sequenced using tags on the MiSeq platform (Illumina Inc., USA), and 250 bp paired-end reads were obtained. Approximately 10 million reads were generated. These sequences were joined into the original longer tags by overlapping their 3’ ends. Then, the chimeric sequences were identified and removed using UCHIME v4.2 software to obtain valid tags. The tags with 97% sequence similarity were clustered in QIIME software (version 1.8.0)17 using UCLUST18 to obtain operational taxonomic units (OUTs). Based on Silva (bacteria, http://www.arb-silva.de) and UNITE (fungi, http://unite.ut.ee/index.php; to OTUs for taxonomic annotation) bioclassification databases, the OUTs were classified and annotated. A 0.005% sequence of all sequence numbers was used as a threshold to filter OUTs.19 The taxonomic information of the species corresponding to each OTU was obtained by comparing the representative sequences of OTUs with the microbial reference database. Later, the composition of each sample was counted at each level (ie, phylum, class, order, family, genus, species). Based on this, species abundance tables at different taxonomic levels were generated using the QIIME software, and the colony structure charts at each taxonomic level using the R package. Species annotation was performed using the RDP classifier (version 2.2, http://sourceforge.net/projects/rdpclassifier/) with a believable threshold of 0.8.20
Data Analysis
SPSS 23.0 software was used for statistical analysis. Measurement data were expressed as mean ± standard deviation (SD). Analysis of variance or Kruskal–Wallis test was used for comparison between multiple groups. The least square difference test was performed to further analyze the differences between the two groups. Independent samples t-test was used for comparison between two groups. The differences were statistically significant when P < 0.05. The α diversity of the samples (including Chao1, Shannon, Simpson, Richness) was analyzed using Mothur software (version v.1.30). The Bray–Curtis and Euclidean algorithms of QIIME and R software were adopted for β-diversity analysis. In addition, statistical analysis of the variation of microbial colonies in different groups of samples was performed, and linear discriminant analysis (LDA) of multilevel species difference was carried out by using linear discriminant analysis effect size (LEfSe).
Results
Composition of the Bacterial Colony
First, we analyzed the bacterial colony structure by OTUs based on the 16s sequencing results of the skin bacterial colony in three groups of subjects. The results showed that there were a total of 3453 amplified sequences in the TW group, 1475 amplified sequences in the T group, and 4173 amplified sequences in the H group. A total of 2812 sequences were identical between the TW group and the H group, and 981 identical sequences were identical between the TW group and the T group, with 944 amplicons common to all three groups (Figure 2A). The bacterial flora of each subject was further analyzed. As shown in Figure 2B–D, the flora structure formed by Staphylococcus of the genus Staphylococcaceae in the phylum Firmicutes was predominant in the H group, and that formed by Enhydrobacter of the genus Moraxellaceae in the phylum Proteobacteria and by Corynebacterium_1 of the genus Corynebacteriaceae in the phylum Actinobacteria were also present in the H group. In the T group, a significant decrease in the abundance was observed in Staphylococcus of the genus Staphylococcaceae in the phylum Firmicutes, while an increase in the abundance was found in Proteus of the genus Enterobacteriaceae and the phylum Proteobacteria, Corynebacterium_1 of the genus Corynebacteriaceae in the phylum Actinobacteria, and bacterium_NLAE-zl-H13 of the genus Bacteroides in the phylum Bacteroidetes. It can be noticed that when Enterococcus and Streptococcus were the dominant organisms in the group, the abundance of the others decreased significantly. In contrast to the H group, the abundance of Corynebacterium_1 was obviously increased in the TW group. More interestingly, the abundance of Staphylococcus was significantly raised in the TW group compared to the other two groups (Figure 3). Overall, the differences are very obvious in the bacterial colony structure between the TW group and the T and H groups.
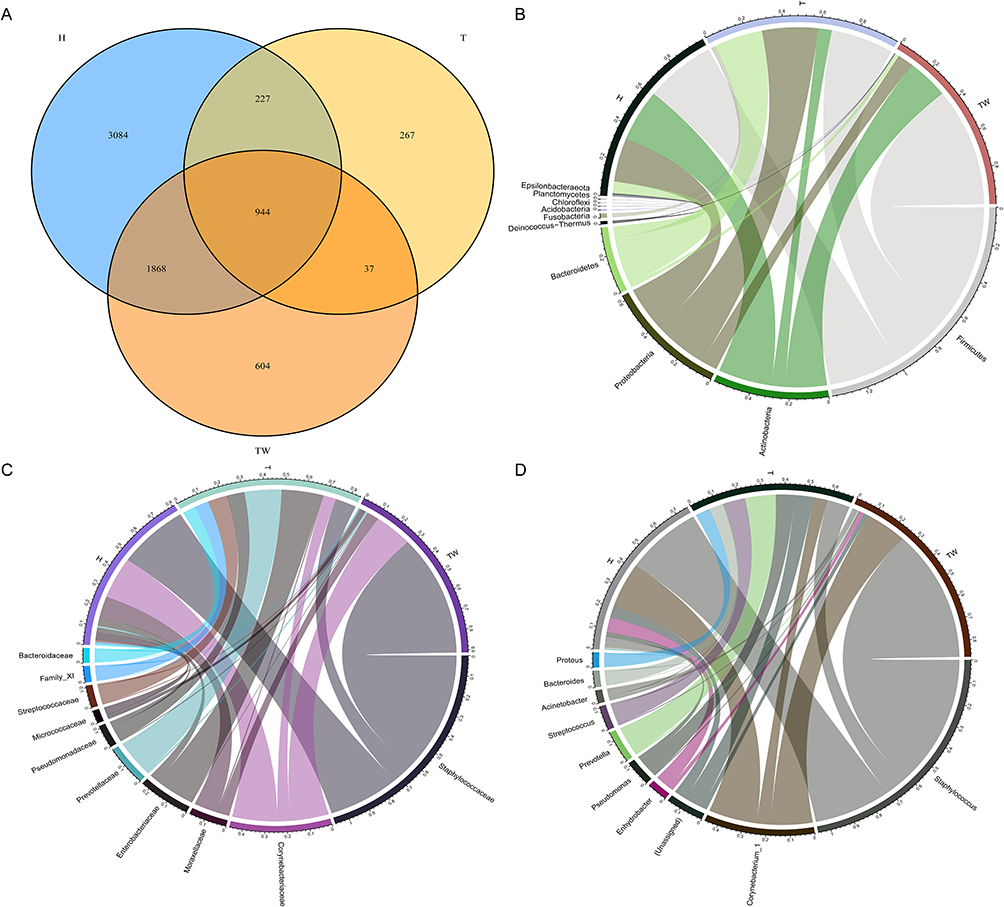 |
Figure 2 Composition of bacterial colonies. (A) Venn diagram of sequencing results of the skin bacterial colony in three groups of subjects by OTU analysis; (B–D) assessment of bacterial colony structure in three groups of samples at phylum, family, and genus levels. Abbreviation: OUT, operational taxonomic unit. |
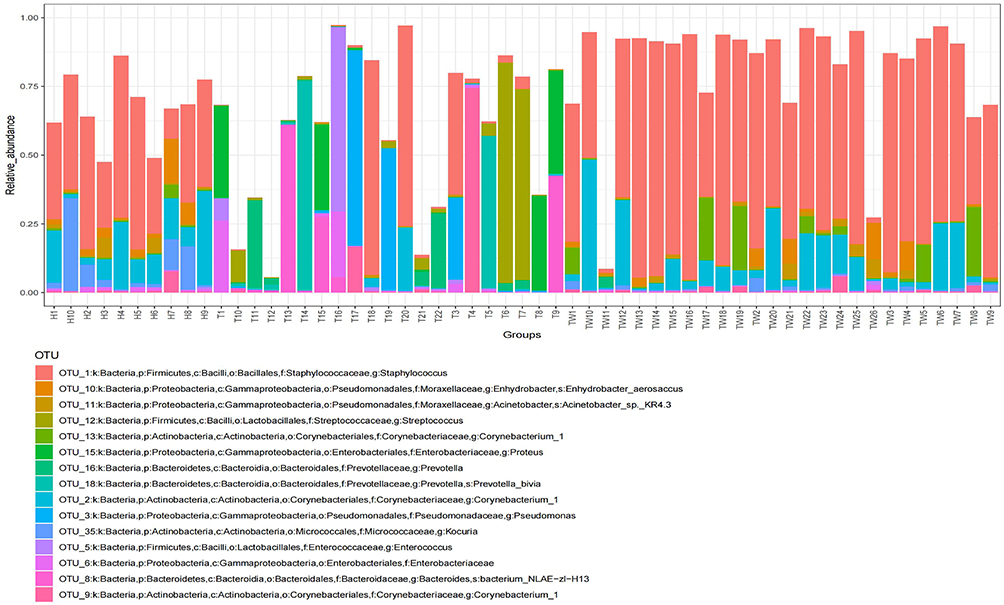 |
Figure 3 Bacterial colony composition. Bacterial colony structure of the top 15 most abundant different OTUs in T, TW, and H groups. Abbreviation: OUT, operational taxonomic unit. |
α Diversity Analysis
The α diversity analysis was subsequently performed on the bacterial colony of the samples from each group. It was observed that the chao1 index was much lower in the T group relative to the H and TW groups, but it was much higher in the H group than in the TW group (Figure 4A). As for the Shannon index, the TW group showed significantly lower than the H group, and the T group showed higher than the H and TW groups (Figure 4B). A notable rise in the Simpson index was observed in the T group relative to the H group; however, there was no significant difference in the Simpson index between the H and TW groups and between the T and TW groups (Figure 4C). In addition, the richness index was significantly decreased in the TW group compared to the H group, and compared to the H and TW groups, the richness index was considerably lower in the T group (Figure 4D). Collectively, the bacterial colony in the skin of patients in the T group had significantly lower bacterial counts, bacterial diversity, species richness and evenness than those in the H group and the TW group.
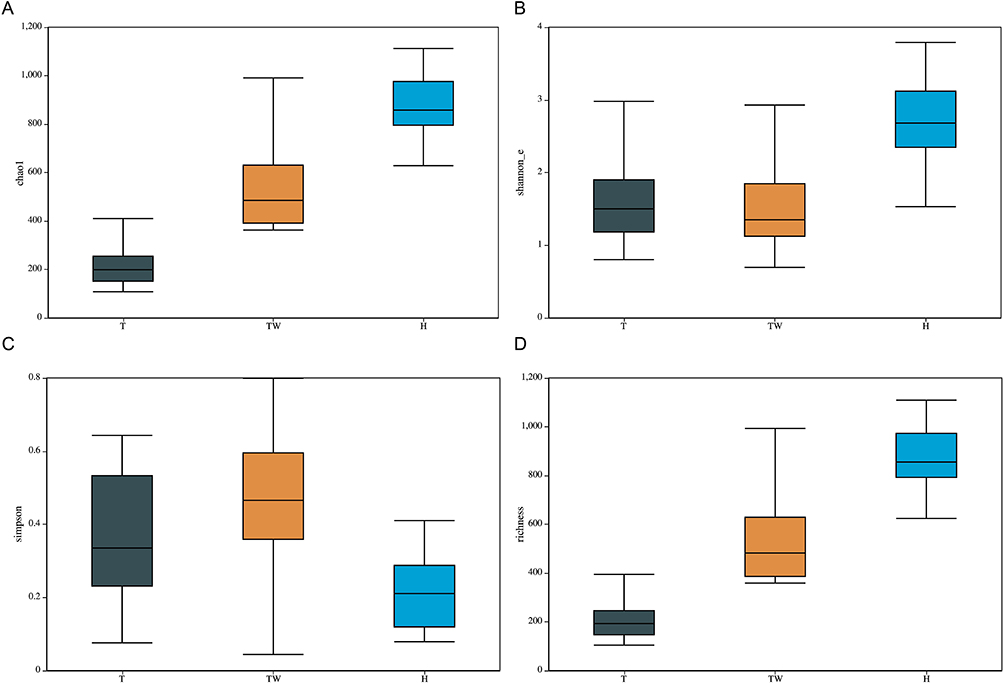 |
Figure 4 Variation of α-diversity index among the three groups. (A) α diversity analysis of chao1. (B) α diversity analysis of Shannon. (C) α diversity analysis of Simpson. (D) α diversity analysis of richness. |
β Diversity Analysis
Meanwhile, we performed β diversity analysis on the sample data. No matter the results of Bray–Curtis-based PCoA analysis or those of Euclidean-based PCoA analysis, it was discovered that the T group could be clearly distinguished from the H group with statistical significance, as well as clearly distinguished from the TW group. Further observation showed that the microorganisms in the TW group were partially dispersed in the T group and the H group (Figure 5A and B). Thus, it can be seen that the bacterial colony structure of the T group is different from that of the H and TW groups.
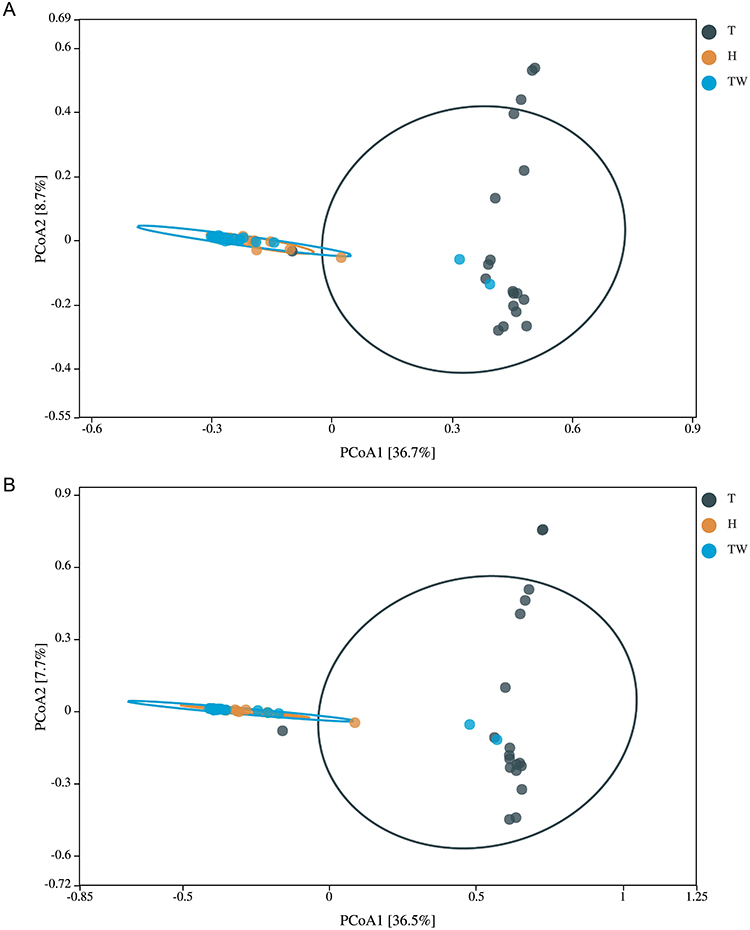 |
Figure 5 β diversity of microbiota in the three groups. (A) PCoA analysis based on Bray–Curtis. (B) PCoA analysis based on Euclidean. |
LEfSe Analysis
In order to identify the key microbiota in the skin bacterial colony, we used LEfSe to analyze the species composition of microbiota in each group. The results showed that the relative abundance of genus Chryseobacterium and genus Lactobacillaceae Roseomonas was higher in the H group than in the TW and T groups. In the TW group, the relative abundance of genus Deinococcaceae and genus Staphylococcaceae was the highest. The highest relative abundance was found in Prevotella, Vagococcus, Peptostreptococcus, and Leptotrichiaceae in the T group (Figure 6A). Later, linear discriminant analysis (LDA) was then used to reveal microbiota that differed significantly among groups. In the H group, the changes of Actinobacteria, Micrococcales, Corynebacteriales, Corynebacteriaceae, and Corynebacterium were observably larger than those in the other two groups. The TW group displayed more distinct changes of Staphylococcaceae, Staphylococcus, Bacillales, Bacilli and Firmicutes than the other two groups. In terms of the T group, the changes of Bacteroidales, Bacteroidia, Enterobacteriaceae, Enterobacteriales and Prevotella were significantly more variable than the other two groups (Figure 6B).
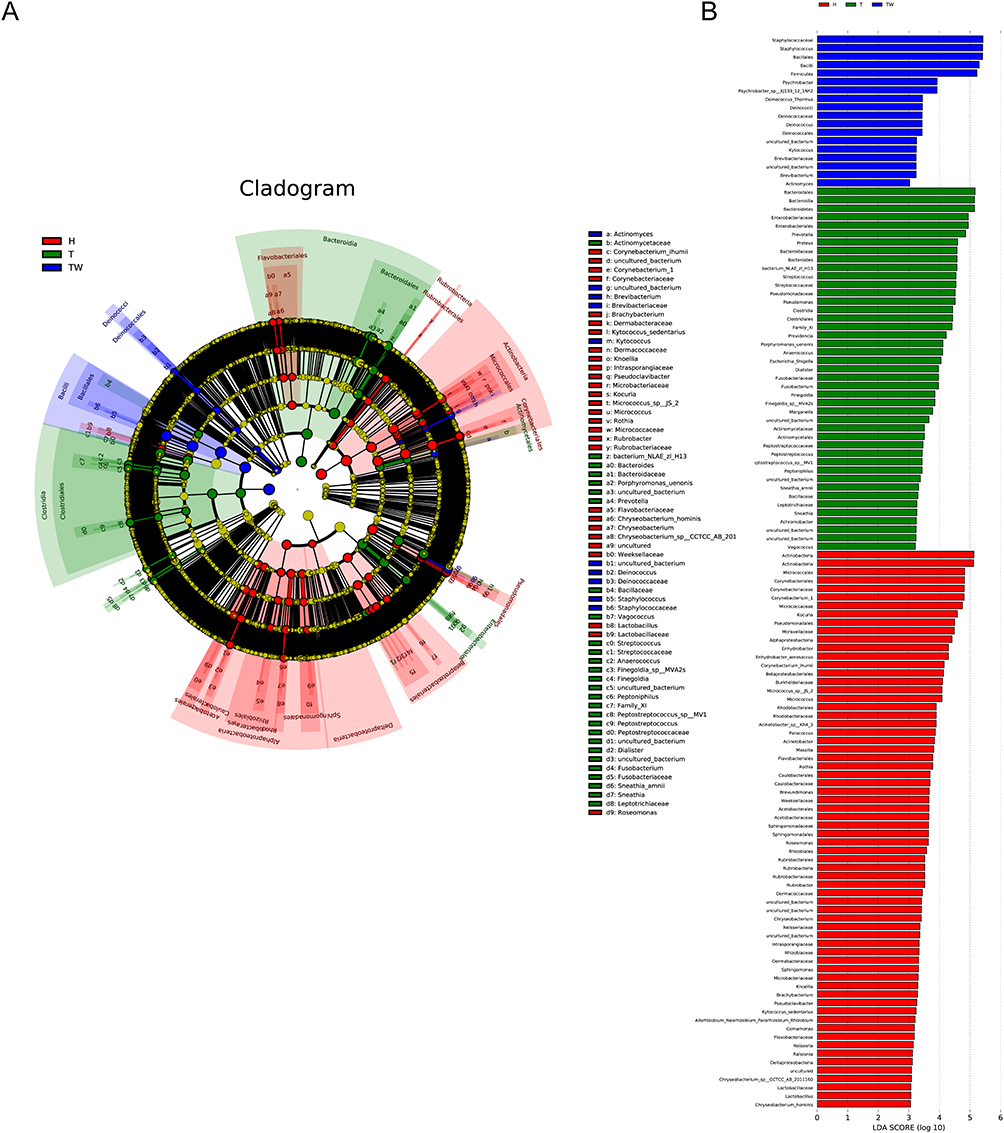 |
Figure 6 LEfSe analysis. (A) composition of species that differ in bacterial colonies in T, TW, and H groups revealed by LEfSe analysis. (B) linear discriminant analysis of microbiota that differ significantly between groups. |
Relative Abundance Percentages of Different Operational Taxonomic Units with the Most Significant Abundance in the Three Groups
Further observation of the significantly different OUTs in the three groups was conducted (Figure 7). Among them, OUT_1 is the Staphylococcus in the phylum Firmicutes, family Staphylococcaceae, with relatively low abundance in the T group relative to the TW and H groups. Similarly, OUT_2 is the Corynebacterium_1 in the phylum Actinobacteria, family Corynebacteriaceae, with relatively low abundance in the T group relative to the TW and H groups. OUT_10 is the Enhydrobacter in the phylum Proteobacteria, family Moraxellaceae, with lower abundance in the T group than in the TW and H groups. OUT_6 indicated the Enterobacteriaceae in the phylum Proteobacteria, family Enterobacteriaceae, which showed relatively low abundance in the T group relative to the TW and H groups. OUT_3, which represented Pseudomonas in the phylum Proteobacteria, family Pseudomonadaceae, had higher abundance in the T group than the TW and H groups.
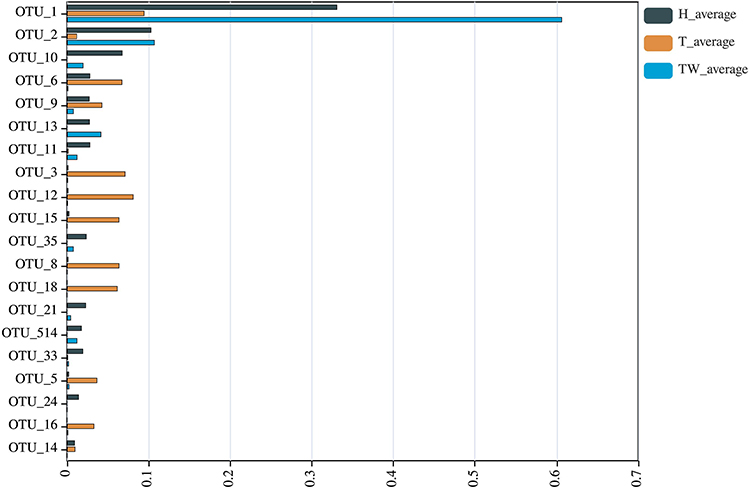 |
Figure 7 Relative abundance percentages of the different operational taxonomic units with the most significant abundance in the T, TW, and H groups. |
Discussion
Bacterial infection is the most common cause of delayed healing in a variety of chronic skin wounds. DFU is not an exception.21 However, the lack of appropriate diagnostic tools makes it impossible to distinguish whether the bacteria in the ulcer are a change in the status of the original colonized bacteria or originate from an external infection. Few studies have been performed on the change in flora from healthy skin to diabetic skin to DFU skin. Therefore, we revealed this change by 16S rRNA gene sequencing and found that the microbiota composition of DFU skin is entirely different from that of healthy and diabetic skin.
It is important to emphasize that the 16S rRNA gene varies between bacterial species. 16S rRNA gene sequencing was performed on the selected hypervariable regions within the 16S gene, although shorter sequences can provide results comparable to the whole genome. Sadly, no single hypervariable region has yet been identified that can discriminate between all known bacterial species.22 Right now, 16S rRNA gene sequencing is still a relatively more comprehensive detection method. In this study, participants were divided into healthy controls (H group), diabetic group (TW group) and DFU (T group). OTU analysis was performed after 16S sequencing using QIIME software. QIIME software focuses on sequencing and functional analysis of microbial colony diversity including data preprocessing, OUT analysis and sample difference analysis.17 As a result, 3453 amplified sequences were discovered in the TW group, 1475 amplified sequences in the T group and 4173 amplified sequences in the H group. Further analysis showed that there was a significant change in both the phylum level, family level and genus level in the T and TW groups compared to the H group. In a previous meta-analysis of DFU isolated strain, the most common pathogen was Staphylococcus aureus, Methicillin-resistant Staphylococcus aureus accounted 18.0%, and Pseudomonas spp., Escherichia coli and Enterococcus spp. were also included in it.23 Jnana et al compared microorganisms in wounds of diabetic and non-diabetic patients. They reported that in the wounds of diabetic patients, the abundance of Alcaligenes, Pseudomonas, Burkholderia and Corynebacterium changed significantly. On the other hand, Maria et al isolated relatively rare bacteria such as Abiotrophia defectiva, Providencia rettgeri, and Providencia stuartii in DFU patients.24 It is evident that there is an extremely high heterogeneity of the microbiome in DFU wounds. In the results of the present study, it can be observed that Staphylococcus was dominant in H and TW groups. Notably, the abundance of the Staphylococcus was significantly reduced, while that of the Enterobacteriaceae, Corynebacterium_1 and bacterium_NLAE -zl-H13 increased in the T group. Such a change in the microbiota was similar to the findings of previous studies.25
There are numerous indicators of α diversity that can be expressed in Mothur software with Shannon, Berger-Parker, Simpson, Q statistic; observed richness, Chao1, ACE, and jackknife.26 The β diversity analysis mainly reflects the degree of variation between samples. Several distance metrics, such as Unifrac, Bray–Curtis, Euclidean, Jaccard index, Yue & Clayton, and Morisita-Horn, have been often employed using QIIME and R software.27 In this study, the diversity of skin microorganisms was found to have gradually decreased from the H group to the T group in accordance with the results of α diversity analysis. Besides, β diversity analysis results revealed that the species diversity composition of the T group was significantly different from that of the TW and H groups, as the TW and H groups were in a state of gathering with small differences in diversity. These results differ from the findings of most of the previous reports. Some studies have suggested that species richness of microbiota shows a negative correlation with wound healing and a positive correlation with the increased time of wound healing.7,28 Other relevant studies have indicated that the burn wound healing time of Pseudomonas aeruginosa-colonized mice is significantly prolonged. The longer healing time can be explained by that the biofilms of Pseudomonas aeruginosa disrupt host defenses, thereby inducing a steady state of chronic infection that impairs wound healing.29 Similarly, it has also been shown that Pseudomonas aeruginosa significantly delays wound healing by inhibiting the formation of new blood vessels in wounds.30 What’s more, a study published in 2021 concluded that persistent infection with Staphylococcus aureus in porcine wound biofilm resulted in slowing down wound healing by causing deficiencies in granulation tissue collagen.31 It is thus clear that the slow wound healing caused by microorganisms may not only be a result of the flora abundance but may also be mediated by the key flora. In the present study, it could be observed that the change in abundance of Pseudomonas spp. was significantly increased in the T group, which could also be responsible for the persistence of foot ulcers.
In order to identify the key flora in the change of skin flora in the presence of healthy skin to DFU skin, we analyzed the relative abundance percentages of the different OTUs with the most significant abundance in the three groups. According to the analysis results, the abundance of Staphylococcus, Enhydrobacter and Corynebacterium _1 gradually decreased as the microbial colony structure changed from the H group to the T group, while Enterobacteriaceae and Pseudomonas showed an up-regulation trend. However, previous studies revealed that Staphylococcus and Pseudomonas are very common flora in diabetes, which increases the probability of ulcer infection. Antibiotics are also the primary line of defense against staphylococci due to the small number of Escherichia coli.32 As for the findings of this study, Staphylococcus in ulcers also changed significantly in abundance, and the number of Escherichia coli increased considerably, which may be due to the change in the dominant microflora.33 Additionally, Kurup et al reported that Gram-negative bacteria (63.0%) were more prevalent than Gram-positive bacteria (37.0%) in the wounds of DFU patients; Pseudomonas (18.8%) was the most common isolate, followed by Escherichia coli (13.9%).34 Such a phenomenon again emphasizes the heterogeneity and complexity of the bacterial histology of DFU.
Conclusion
In summary, the bacterial colony structure in the DFU skin changed significantly relative to the skin of healthy or diabetic patients. Notably, in the DFU skin, the abundance of Staphylococcus, Enhydrobacter and Corynebacterium_1 was significantly reduced, while that of Escherichia coli and Pseudomonas was remarkably increased. The difference between a healthy skin and diabetic skin with or without ulcer is the balance between normal and pathogenic microbiota. Altering the microbiota composition of wounds may help the treatment of DFU. 16S rRNA gene sequencing is a practical detection method with kinds of computational methods to achieve the variation of microbial colony analysis. However, the bacterial colony structure of DFU skin has obvious individual difference, and further studies are needed to break through the limitation brought on by individual difference.
Data Sharing Statement
The data used to support the findings of this study are available from the corresponding author upon request.
Ethics Statement
This study was approved by the ethics committee of the Ethics Committee of Panyu Central Hospital (ethics number: PYRC-2020-008). All patients provided written informed consent prior to enrollment in the study. All methods were carried out in accordance with the Declaration of Helsinki.
Funding
This work was financially supported by Guangzhou Municipal General Project Fund No. 20211A011119; Guangzhou Municipal Science and Technology Commission Project Fund No. 202102080567; Panyu District Key Discipline Project Fund No. 2020-Z04-010.
Disclosure
The authors declare that they have no competing interests in this work.
References
1. Zayed H. Genetic epidemiology of type 1 diabetes in the 22 Arab countries. Curr Diab Rep. 2016;16(5):37. doi:10.1007/s11892-016-0736-4
2. International Diabetes Federation. IDF Diabetes Atlas.
3. Grennan D. Diabetic foot ulcers. JAMA. 2019;321(1):114. doi:10.1001/jama.2018.18323
4. Bus SA, Lavery LA, Monteiro-Soares M, et al. Guidelines on the prevention of foot ulcers in persons with diabetes (IWGDF 2019 update). Diabetes Metab Res Rev. 2020;36(Suppl 1):e3269. doi:10.1002/dmrr.3269
5. Armstrong DG, Boulton AJM, Bus SA. Diabetic foot ulcers and their recurrence. N Engl J Med. 2017;376(24):2367–2375. doi:10.1056/NEJMra1615439
6. Walsh JW, Hoffstad OJ, Sullivan MO, Margolis DJ. Association of diabetic foot ulcer and death in a population-based cohort from the United Kingdom. Diabet Med. 2016;33(11):1493–1498. doi:10.1111/dme.13054
7. Baig MS, Banu A, Zehravi M, et al. An overview of diabetic foot ulcers and associated problems with special emphasis on treatments with antimicrobials. Life. 2022;12(7):1054.
8. Edmonds M, Lazaro-Martinez JL, Alfayate-Garcia JM, et al. Sucrose octasulfate dressing versus control dressing in patients with neuroischaemic diabetic foot ulcers (Explorer): an international, multicentre, double-blind, randomised, controlled trial. Lancet Diabetes Endocrinol. 2018;6(3):186–196. doi:10.1016/S2213-8587(17)30438-2
9. Xu Z, Hsia HC. The impact of microbial communities on wound healing: a review. Ann Plast Surg. 2018;81(1):113–123. doi:10.1097/SAP.0000000000001450
10. Luqman A, Gotz F. The ambivalent role of skin microbiota and adrenaline in wound healing and the interplay between them. Int J Mol Sci. 2021;22(9):4996. doi:10.3390/ijms22094996
11. Tomic-Canic M, Burgess JL, O’Neill KE, Strbo N, Pastar I. Skin microbiota and its interplay with wound healing. Am J Clin Dermatol. 2020;21(Suppl 1):36–43. doi:10.1007/s40257-020-00536-w
12. Grice EA, Snitkin ES, Yockey LJ, et al. Longitudinal shift in diabetic wound microbiota correlates with prolonged skin defense response. Proc Natl Acad Sci U S A. 2010;107(33):14799–14804. doi:10.1073/pnas.1004204107
13. Gardner SE, Hillis SL, Heilmann K, Segre JA, Grice EA. The neuropathic diabetic foot ulcer microbiome is associated with clinical factors. Diabetes. 2013;62(3):923–930. doi:10.2337/db12-0771
14. Oates A, Bowling FL, Boulton AJ, McBain AJ. Molecular and culture-based assessment of the microbial diversity of diabetic chronic foot wounds and contralateral skin sites. J Clin Microbiol. 2012;50(7):2263–2271. doi:10.1128/JCM.06599-11
15. American Diabetes Association. Diagnosis and classification of diabetes mellitus. Diabetes Care. 2011;34(Suppl 1):S62–S69. doi:10.2337/dc11-S062
16. Jnana A, Muthuraman V, Varghese VK, et al. Microbial community distribution and core microbiome in successive wound grades of individuals with diabetic foot ulcers. Appl Environ Microbiol. 2020;86(6). doi:10.1128/AEM.02608-19
17. Caporaso JG, Kuczynski J, Stombaugh J, et al. QIIME allows analysis of high-throughput community sequencing data. Nat Methods. 2010;7(5):335–336. doi:10.1038/nmeth.f.303
18. Edgar RC. Search and clustering orders of magnitude faster than BLAST. Bioinformatics. 2010;26(19):2460–2461. doi:10.1093/bioinformatics/btq461
19. Bokulich NA, Subramanian S, Faith JJ, et al. Quality-filtering vastly improves diversity estimates from Illumina amplicon sequencing. Nat Methods. 2013;10(1):57–59. doi:10.1038/nmeth.2276
20. Wang Q, Garrity GM, Tiedje JM, Cole JR. Naive Bayesian classifier for rapid assignment of rRNA sequences into the new bacterial taxonomy. Appl Environ Microbiol. 2007;73(16):5261–5267. doi:10.1128/AEM.00062-07
21. Pitocco D, Spanu T, Di Leo M, et al. Diabetic foot infections: a comprehensive overview. Eur Rev Med Pharmacol Sci. 2019;23(2 Suppl):26–37. doi:10.26355/eurrev_201904_17471
22. Liu Z, Lozupone C, Hamady M, Bushman FD, Knight R. Short pyrosequencing reads suffice for accurate microbial community analysis. Nucleic Acids Res. 2007;35(18):e120. doi:10.1093/nar/gkm541
23. Macdonald KE, Boeckh S, Stacey HJ, Jones JD. The microbiology of diabetic foot infections: a meta-analysis. BMC Infect Dis. 2021;21(1):770. doi:10.1186/s12879-021-06516-7
24. Demetriou M, Papanas N, Panagopoulos P, Panopoulou M, Maltezos E. Atypical microbial isolates from infected diabetic foot ulcers: a case series from Greece. Rev Diabet Stud. 2017;14(2–3):258–259. doi:10.1900/RDS.2017.14.258
25. Shanmugam P, J M, Susan SL. The bacteriology of diabetic foot ulcers, with a special reference to multidrug resistant strains. J Clin Diagn Res. 2013;7(3):441–445. doi:10.7860/JCDR/2013/5091.2794
26. Schloss PD, Westcott SL, Ryabin T, et al. Introducing mothur: open-source, platform-independent, community-supported software for describing and comparing microbial communities. Appl Environ Microbiol. 2009;75(23):7537–7541. doi:10.1128/AEM.01541-09
27. Marathe A, Priyadarsanan DR, Krishnaswamy J, Shanker K. Gamma diversity and under-sampling together generate patterns in beta-diversity. Sci Rep. 2021;11(1):21420. doi:10.1038/s41598-021-99830-8
28. Canesso MC, Vieira AT, Castro TB, et al. Skin wound healing is accelerated and scarless in the absence of commensal microbiota. J Immunol. 2014;193(10):5171–5180. doi:10.4049/jimmunol.1400625
29. Trostrup H, Lerche CJ, Christophersen LJ, et al. Chronic Pseudomonas aeruginosa biofilm infection impairs murine S100A8/A9 and neutrophil effector cytokines-implications for delayed wound closure? Pathog Dis. 2017;75(7). doi:10.1093/femspd/ftx068
30. Trostrup H, Lerche CJ, Christophersen LJ, et al. Pseudomonas aeruginosa biofilm hampers murine central wound healing by suppression of vascular epithelial growth factor. Int Wound J. 2018;15(1):123–132. doi:10.1111/iwj.12846
31. Roy S, Santra S, Das A, et al. Staphylococcus aureus biofilm infection compromises wound healing by causing deficiencies in granulation tissue collagen. Ann Surg. 2020;271(6):1174–1185. doi:10.1097/SLA.0000000000003053
32. Uhre ML, Gotland N, Sandholdt H, et al. Increased risk of diabetes mellitus five years after an episode of Staphylococcus aureus bacteraemia. Infect Dis. 2019;51(7):512–518. doi:10.1080/23744235.2019.1602284
33. Mirani ZA, Fatima A, Urooj S, Aziz M, Khan MN, Abbas T. Relationship of cell surface hydrophobicity with biofilm formation and growth rate: a study on Pseudomonas aeruginosa, Staphylococcus aureus, and Escherichia coli. Iran J Basic Med Sci. 2018;21(7):760–769. doi:10.22038/IJBMS.2018.28525.6917
34. Kurup R, Ansari AA. A study to identify bacteriological profile and other risk factors among diabetic and non-diabetic foot ulcer patients in a Guyanese hospital setting. Diabetes Metab Syndr. 2019;13(3):1871–1876. doi:10.1016/j.dsx.2019.04.024
 © 2023 The Author(s). This work is published and licensed by Dove Medical Press Limited. The
full terms of this license are available at https://www.dovepress.com/terms
and incorporate the Creative Commons Attribution
- Non Commercial (unported, 3.0) License.
By accessing the work you hereby accept the Terms. Non-commercial uses of the work are permitted
without any further permission from Dove Medical Press Limited, provided the work is properly
attributed. For permission for commercial use of this work, please see paragraphs 4.2 and 5 of our Terms.
© 2023 The Author(s). This work is published and licensed by Dove Medical Press Limited. The
full terms of this license are available at https://www.dovepress.com/terms
and incorporate the Creative Commons Attribution
- Non Commercial (unported, 3.0) License.
By accessing the work you hereby accept the Terms. Non-commercial uses of the work are permitted
without any further permission from Dove Medical Press Limited, provided the work is properly
attributed. For permission for commercial use of this work, please see paragraphs 4.2 and 5 of our Terms.