Back to Journals » Neuropsychiatric Disease and Treatment » Volume 13
Association between serotonin transporter polymorphisms (5-HTTLPR) and the MADRS Dysphoria, Retardation, and Vegetative Subscale scores in the treatment of depression
Authors Takahashi H, Higuchi H, Sato K, Kamata M, Yoshida K, Nishimura K ![]()
Received 2 October 2016
Accepted for publication 5 April 2017
Published 7 June 2017 Volume 2017:13 Pages 1463—1469
DOI https://doi.org/10.2147/NDT.S123708
Checked for plagiarism Yes
Review by Single anonymous peer review
Peer reviewer comments 2
Editor who approved publication: Professor Taro Kishi
Hitoshi Takahashi,1 Hisashi Higuchi,2 Kazuhiro Sato,3 Mitsuhiro Kamata,3 Keizo Yoshida,4 Katsuji Nishimura1
1Department of Neuropsychiatry, Tokyo Women’s Medical University School of Medicine, Shinjuku-ku, 2Suzuki Jikoh Hospital, Ome-shi, Tokyo, 3Akita Kaiseikai Hospital, Akita-shi, 4Health Care Promotion Division, DENSO Corporation, Kariya-shi, Aichi, Japan
Objective: We investigated the association between serotonin- or 5-hydroxytryptamine (5-HT)-related gene polymorphisms and response to antidepressant treatment in a specific symptom cluster of major depression by using the three-factor model of the Montgomery–Åsberg Depression Rating Scale (MADRS), ie, dysphoria (items of sadness, pessimistic thoughts, and suicidal thoughts), retardation (items of lassitude, inability to feel, apparent sadness, and concentration difficulties), and vegetative symptoms (items of reduced sleep, reduced appetite, and inner tension).
Methods: This study was an open-label and nonrandomized trial. A total of 160 patients with baseline MADRS scores of ≥21, who were treated with fluvoxamine or milnacipran for 6 weeks, were included in the statistical analysis. Polymorphisms within a 5-HT transporter (5-HTT) gene-linked polymorphic region (5-HTTLPR), a variable number of tandem repeats in the second intron of the 5-HTT gene (5-HTTVNTR), and 5HT2A receptor (1438G/A) were determined by polymerase chain reaction-restriction fragment length polymorphism (PCR-RFLP).
Results: The 5-HTTLPR polymorphisms affected the MADRS score change in dysphoria, but not in retardation, vegetative, or total symptoms. Dysphoria scores significantly decreased in patients with the S/S genotype compared to those in patients with the short (S)/long (L) + L/L genotype. However, 5-HTTVNTR and 1438G/A polymorphisms were not significantly associated with the treatment response to any cluster of depressive symptoms. When a Bonferroni correction was made, however, our results did not reach the criteria for statistical significance.
Conclusion: The use of a single total depression rating scale may not be sufficient to accurately estimate the clinical response to antidepressants. Analyzing a subset of symptoms in psychological scales could be important when performing pharmacogenetic studies.
Keywords: serotonin transporter polymorphism, dysphoria score, antidepressants, MADRS
Introduction
There is considerable evidence supporting the hypothesis that alterations in serotonergic neuronal function are involved in the pathophysiology of depression.1 Selective serotonin reuptake inhibitors (SSRIs) and serotonin or 5-hydroxytryptamine (5-HT) and norepinephrine (NE) reuptake inhibitors (SNRIs) are now widely used to treat major depressive disorders (MDDs). The primary pharmacological action of SSRIs and SNRIs is inhibition of 5-HT reuptake by binding to the 5-HT transporter (5-HTT). Heils et al2 reported both the long (L) and short (S) (44bp insertion/deletion) variants of the 5-HTT gene-linked polymorphic region (5-HTTLPR). In vitro evidence suggests that the L (insertion) form of 5-HTTLPR is functionally more active than the S (deletion) form.3 Therefore, 5-HTTLPR polymorphisms are expected to correlate with the treatment response to SSRIs and SNRIs.
Several early studies have suggested that SSRIs were more effective in patients with the L/L genotype.4,5 A meta-analysis of Serretti et al6 has provided support, but the large Sequenced Treatment Alternatives to Relieve Depression (STAR*D) study provided negative findings.7 Furthermore, Kim et al8 reported that outcomes in patients with the L/L genotype were negative compared to those in patients with other genotypes for SSRIs. We reported that the 5-HTTLPR polymorphisms are not associated with the time course and final antidepressant response to milnacipran, an SNRI for major depressive patients.9 The underlying reasons for the differences between study results examining the relationship between 5-HTTLPR and antidepressant treatment responses are not clear thus far.
Ginsburg et al10 proposed that the symptoms of MDD could be clustered and linked to distinct genetic mechanisms. However, little attention has been paid to the association between antidepressant treatment responses to specific MDD symptom clusters and 5-HT-related genetic polymorphisms.
Our colleagues analyzed pretreatment Montgomery–Åsberg Depression Rating Scale (MADRS) scores in 132 Japanese patients with unipolar MDD and suggested a three-factor model for MADRS.11 The three-factor model is broken down into categories of dysphoria, retardation, and vegetative symptoms. Dysphoria is then further broken down into items of sadness, pessimistic thoughts, and suicidal thoughts. Similarly, retardation is further broken down into items of lassitude, inability to feel, apparent sadness, and concentration difficulties. Finally, vegetative symptoms are broken down into items of reduced sleep, reduced appetite, and inner tension. Based on these classifications, the authors reported that non-severely depressed patients receiving a low pretreatment score in the vegetative symptom category were predictively good responders to fluvoxamine, an SSRI, but not to milnacipran, an SNRI.12
In the present study, we investigated the relationship between antidepressant response and several 5-HT-related genetic polymorphisms, including 5-HTTLPR, on each factor of the MADRS model as proposed by Suzuki et al11 in MDD. To the best of our knowledge, this is the first report assessing the association between genetic factors and antidepressant treatment responses to specific symptom clusters of MDD.
Methods
Subjects
Study participants were Japanese patients who fulfilled the Diagnostic and Statistical Manual of Mental Disorders, Fourth Edition (DSM-IV) criteria for an MDD with MADRS scores of ≥21.13 Patients with other axis I disorders (including dementia, substance abuse, dysthymia, panic disorder, obsessive–compulsive disorder, and generalized anxiety disorder) and those with axis II disorders as determined by clinical interviews were excluded. Patients with a history of childhood disorders were also excluded, as were patients with severe nonpsychiatric medical disorders. The patients were aged 20–69 years and had been free of psychotropic drug use for at least 14 days before entry into the study. Study participants were given a complete description of the study, and a written informed consent was obtained. The ethical committee of Akita University School of Medicine and Nagoya University Graduate School of Medicine approved this study.
Fluvoxamine treatment
New subjects and subjects from a previous study12 were included in the present study. Therefore, detailed inclusion criteria have been previously described.12 In brief, fluvoxamine was administered twice daily (equivalent doses after dinner and at bedtime) for 6 weeks. The initial total daily dose was 50 mg/day. The daily dose was increased to 100 mg/day after 1 week, and the dose was set to 100, 150, or 200 mg/day after the second week. New subjects, recruited after our previous publication, were placed on the same dosing schedule during the first and second weeks; the dosage was adjusted thereafter depending on efficacy. Concomitant administration of psychotropic drugs was restricted as in our study of milnacipran.14
Milnacipran treatment
Subjects from a previous study of milnacipran14 were included in the present study. Therefore, detailed inclusion criteria have been previously described.14 In brief, milnacipran was administered twice daily (an equivalent dose after dinner and at bedtime) for 6 weeks. The initial total daily dose was 50 mg/day, which was increased to 100 mg/day after 1 week. Patients with insomnia were prescribed the benzodiazepine sedative hypnotic brotizolam (0.25 or 0.5 mg) at bedtime. No other psychotropic drugs were permitted during the study.
Data collection
The characteristics and severity of depressive symptoms were assessed by the total and three-factor (dysphoria, retardation, and vegetative symptoms) MADRS scores. Assessments were conducted at baseline and at 1, 2, 4, and 6 weeks after initiation of antidepressant treatment. The person who rated MADRS scores was not blinded to the treatment and to the genotyping results for a given subject. A clinical response was defined as a ≥50% decrease in the baseline MADRS score. At 4 weeks after initiation of antidepressant treatment, blood samples were collected 12 hours after drug administration at bedtime.
Genotyping
Polymorphisms of 5-HTTLPR, a variable number of tandem repeats in the second intron of the 5-HTT gene (5-HTTVNTR), and 1438G/A in the promoter region of the 5-HT2A receptor gene (5-HT2A 1438G/A) were determined by polymerase chain reaction-restriction fragment length polymorphism (PCR-RFLP). This method has been previously described in detail.15–17
Plasma antidepressant concentrations
Plasma concentrations of milnacipran and fluvoxamine were quantified by high-performance liquid chromatography (HPLC) as previously described by Higuchi et al18 and Ohkubo et al,19 respectively. Laboratory personnel who performed the genotyping and measurement of plasma concentrations were blinded to the identity of the patients and the clinical antidepressant assigned. Moreover, the clinicians were unaware of the genotyping results and plasma concentrations of each patient.
Statistical analysis
Differences in patient characteristics were analyzed by an unpaired t-test or chi-square test where appropriate. Differences in the change in total MADRS dysphoria, retardation, and vegetative symptom scores (the mean score at each evaluation point minus the mean score at pretreatment) in this study were examined using the two-way repeated measures analysis of variance (ANOVA) with genotype and time as factors. When significant interactions between factors were observed, differences in the change in dysphoria, retardation, and vegetative symptom scores at each evaluation point were examined with an unpaired t-test. Statistical analysis was performed using StatView version 5.0 (SAS Institute Inc., Cray, NC, USA). All the tests were two tailed, and a P-value of ≤0.05 was regarded as significant. A power analysis was performed using G*Power.20
Results
In the fluvoxamine treatment, 100 patients were enrolled. Of these100 patients, 16 patients did not complete the study because of nausea or vomiting (n=3), severe insomnia and inner tension (n=3), or unexplained reasons (n=10). Of the 84 patients who completed the 6-week study, four patients were excluded from the current analysis because plasma samples revealed extremely low fluvoxamine concentrations. Patients who completed the study included 43 women and 37 men (55 outpatients and 25 inpatients), ranging from 21 to 69 years of age (mean age =48.3±13.5 [SD]). The final daily dose of fluvoxamine was 100 mg for 10 patients, 150 mg for eight patients, and 200 mg for 62 patients.
In the milnacipran treatment, 96 patients were enrolled. Of these 96 patients, 10 patients did not complete the study because of side effects (n=5), severe insomnia (n=1), or unexplained reasons (n=4). Of the 86 patients who completed the 6-week study, six patients were excluded from the current analysis because plasma samples revealed extremely low milnacipran concentrations, indicative of poor compliance. Patients who completed the study included 52 women and 28 men (49 outpatients and 31 inpatients), ranging from 25 to 69 years of age (mean age =51.4±12.2 [SD]).
The clinical characteristics of the patients treated with fluvoxamine or milnacipran are shown in Table 1. There were no significant differences between responders and nonresponders with regard to sex, age, number of previous episodes, presence of melancholia, pretreatment total MADRS score, pretreatment dysphoria score, pretreatment retardation score, and pretreatment vegetative symptoms score. The number of previous depressive episodes was very low, with most of the patients (milnacipran: 64/80 and fluvoxamine: 59/80) experiencing their first episode upon enrollment in this study. There were no significant differences in clinical characteristics when fluvoxamine- and milnacipran-treated patients were analyzed independently (data not shown).
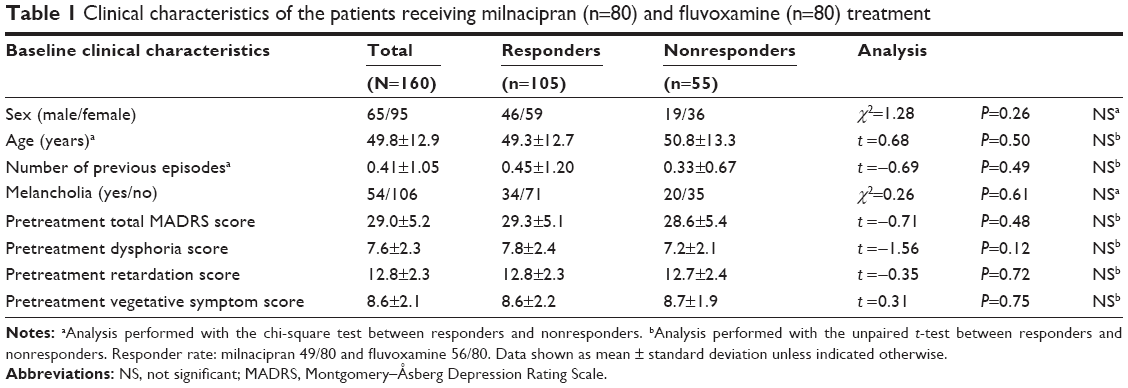 | Table 1 Clinical characteristics of the patients receiving milnacipran (n=80) and fluvoxamine (n=80) treatment |
5-HTTLPR
There was a significant difference in the genotype × time interaction between the S/S and S/L + L/L genotype groups in dysphoria scores (F =3.23, df =4, P=0.012). There were no significant differences at week 1 (t =−1.36, df =158, P=0.18), week 2 (t =−1.47, df =158, P=0.14), and week 4 (t =−1.96, df =158, P=0.052). There was a significant difference at week 6 (t =−2.51, df =158, P=0.013; Figure 1). In contrast, there were no significant differences in the genotype × time interaction between the S/S and S/L + L/L genotype groups in retardation scores (F =1.06, df =4, P=0.37; Figure 2), vegetative symptoms scores (F =1.68, df =4, P=0.15; Figure 3), and total MADRS scores (F =2.26, df =4, P=0.062; Figure 4).
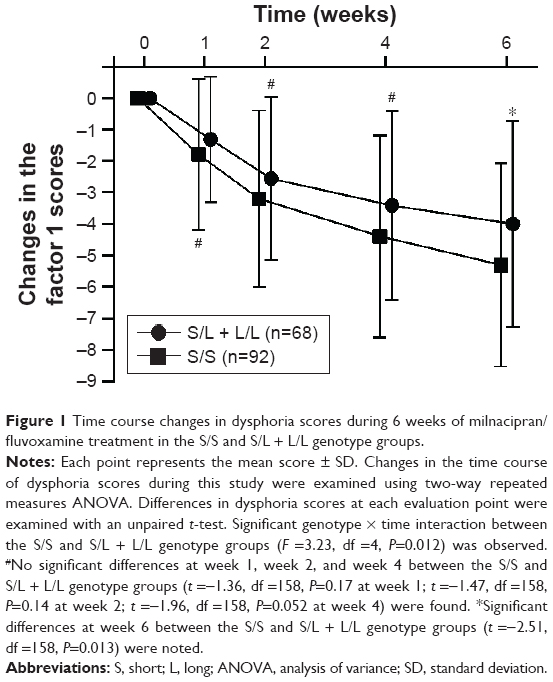 | Figure 1 Time course changes in dysphoria scores during 6 weeks of milnacipran/fluvoxamine treatment in the S/S and S/L + L/L genotype groups. |
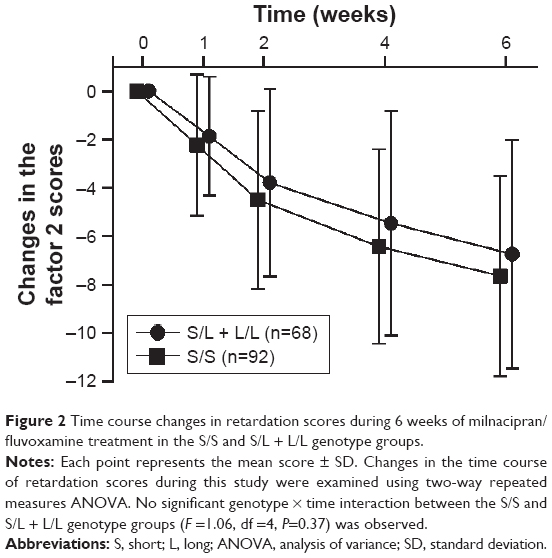 | Figure 2 Time course changes in retardation scores during 6 weeks of milnacipran/fluvoxamine treatment in the S/S and S/L + L/L genotype groups. |
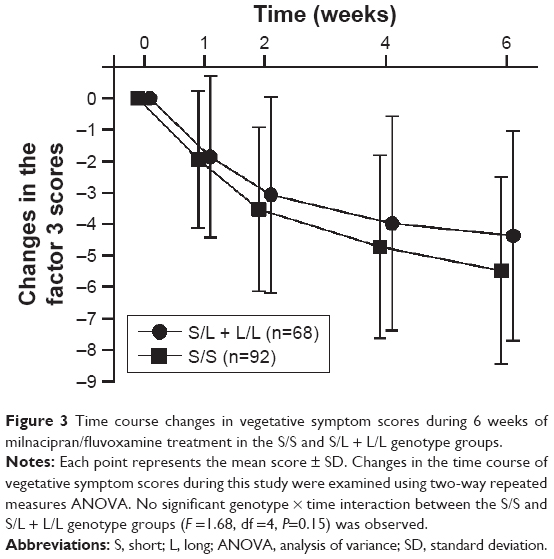 | Figure 3 Time course changes in vegetative symptom scores during 6 weeks of milnacipran/fluvoxamine treatment in the S/S and S/L + L/L genotype groups. |
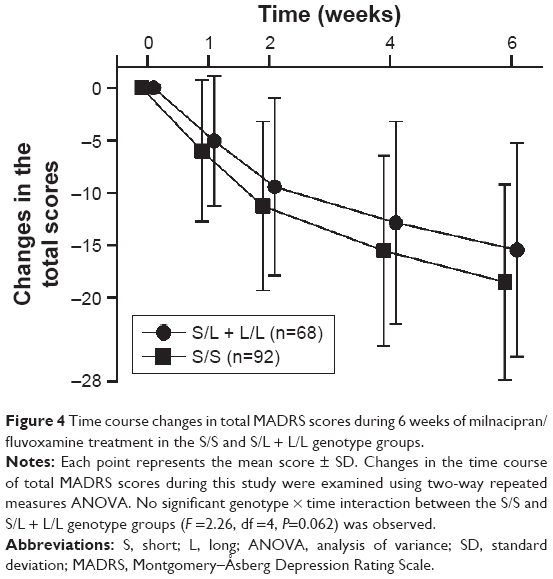 | Figure 4 Time course changes in total MADRS scores during 6 weeks of milnacipran/fluvoxamine treatment in the S/S and S/L + L/L genotype groups. |
5-HTTVNTR
There were no significant differences in the genotype × time interaction between 12/12 and 12/10 + 10/10 genotype groups in dysphoria scores (F =0.54, df =4, P=0.71), retardation scores (F =0.53, df =4, P=0.72), vegetative symptoms scores (F =1.80, df =4, P=0.13), and total MADRS scores (F =1.31, df =4, P=0.27).
5-HT2A (1438G/A)
There were no significant differences in the genotype × time interaction between G/G, G/A, and A/A genotype groups in dysphoria scores (F =0.24, df =8, P=0.98), retardation scores (F =0.70, df =8, P=0.69), vegetative symptoms scores (F =0.43, df =8, P=0.90), and total MADRS scores (F =0.39, df =8, P=0.93).
Power analysis
For the two-way repeated measures of ANOVA, this study had a power of 0.51 to detect a small effect, 0.99 to detect a medium effect, and 0.99 to detect a large effect (N=160). In the power analysis, effect size conventions were determined according to Cohen21 as follows: small effect size, 0.10; medium effect size, 0.25; and large effect size, 0.40 (α =0.05).
Bonferroni correction
As we made multiple testing (three types of gene polymorphisms such as 5-HTTLPR, 5-HTTVNTR, and 1438G/A × four symptom clusters such as total, dysphoria, vegetative, and retardation symptoms), a Bonferroni correction for each set of analysis by using a P-value of 0.05/12=0.004 was adopted. When this correction was used, none of the analysis could be considered statistically significant.
Discussion
The present study suggested that the 5-HTTLPR polymorphisms affect the efficacy of antidepressants on dysphoria scores, but not on retardation scores, vegetative symptoms scores, or total MADRS scores. These results show that analyzing a subset of symptoms in psychological scales could be important when performing pharmacogenetic studies. A significantly higher reduction in dysphoria scores was observed from pretreatment to the study’s conclusion in patients with the S/S genotype in 5-HTTLPR polymorphisms compared with those with the S/L + L/L genotype. Although this result does not withstand the Bonferroni correction, our finding may suggest that it is not sufficiently accurate to estimate the clinical response to antidepressants using only a total depression rating scale (eg, MADRS and Hamilton Depression Rating Scale [HAMD-S]), especially in clinical pharmacogenetic studies. The association between allelic variations of 5-HTTLPR and antidepressant response to SSRIs has been a controversial topic. A report by Lewis et al22 showed no association between 5-HTTLPR polymorphisms and antidepressant response to citalopram, an SSRI, in major depressive British patients. In addition, studies have reported a significantly higher frequency of the S allele in responders than in nonresponders in the treatment of Japanese major depressive patients treated with SSRIs,23,24 supporting our earlier report about fluvoxamine treatment.15 In consideration of these controversies, it is necessary to investigate the association between subscale of HAMD-S or MADRS scores and 5-HTTLPR polymorphisms in the treatment of major depression using SSRIs. Indeed, our recent study suggested a significant relationship between the presence of the S allele in 5-HTTLPR polymorphisms and higher dysphoria scores when analyzed according to MADRS in Japanese MDD patients.25 Although we did not adopt an item analysis in the present study, this would be helpful to understand whether the significant findings that were seen for the dysphoria factor were driven primarily to one of the specific component of this subscale.
In a review by Healy and McMonagle,26 it was suggested that NE enhances vigilance, motivation, and self-perception, whereas 5-HT affects impulse and irritability. There is a consensus that drugs targeting the NE system act on drive and vigilance markedly compared with drugs targeting the 5-HT system. Retardation scores represent reduced motivation and drive and, therefore, may be related to the NE but not the 5-HT system. This likely explains the lack of association between changes in MADRS scores of retardation and gene polymorphisms related to 5-HT in this study. This comment is nothing more than our personal opinion, because there have been some clinical studies showing the favorable effect of SSRIs on each item in MADRS that comprises retardation factor.
Interferon-alpha is a cytokine that is known to induce neuropsychiatric symptoms, including depressive mood, anhedonia, and neurovegetative symptoms (eg, appetite loss and sleep disturbances).27,28 Some reports have suggested that prophylactic SSRI treatment has only a limited efficacy in treating interferon-alpha-induced neurovegetative symptoms compared to symptoms of a depressive mood, indicating that the neurovegetative symptoms are being affected by monoamine pathways other than 5-HT.29 Indeed, recent reports support the concept that interferon-alpha may profoundly alter dopamine metabolites and the function of basal ganglia circuitry, thereby contributing to deterioration of neurovegetative symptoms.30–32 These findings may explain the lack of association between changes in MADRS vegetative symptom scores and 5-HT-related polymorphisms in this study. 5-HTTVNTR and 1438G/A polymorphisms were not associated with changes in MADRS dysphoria, retardation, and vegetative symptom scores from pretreatment to the study’s conclusion under the treatment of antidepressants. Similarly, we previously showed no association between these polymorphisms and antidepressant response as judged by total MADRS scores.16,17 Therefore, the 5-HTTVNTR and 1438G/A polymorphisms likely have no influence on the antidepressant response.
In additional analysis, we investigated whether our results regarding associations between treatment response and 5-HTTLPR polymorphisms vary between the subset of patients with severe symptom (defined as ≥35 on MADRS total score) versus those with less severe symptom (defined as ≤34 on MADRS total score).33 As a result, in patients with severe symptom, we found no significant differences in the genotype × time interaction between the S/S and S/L + L/L genotype groups in dysphoria scores (F =0.01, df =4, P=0.98), retardation scores (F =1.35, df =4, P=0.26), vegetative symptom scores (F =1.57, df =4, P=0.19), and total MADRS scores (F =0.85, df =4, P=0.50). On the other hand, in patients with less severe symptom, there were significant differences in the genotype × time interaction between the S/S and S/L + L/L genotype groups in dysphoria scores (F =3.07, df =4, P=0.016), retardation scores (F =2.46, df=4, P=0.04), vegetative scores (F =3.69, df =4, P=0.006), and total MADRS scores (F =4.22, df =4, P=0.002). We also found significant differences at study end point in dysphoria scores (t =−2.49, df =135, P=0.014), vegetative scores (t =−2.20, df =135, P=0.030), and total MADRS scores (t =−2.65, df =135, P=0.009), but not in retardation scores (t =−1.91, df =135, P=0.06). We do not know a reasonable explanation why improvement in depression may be influenced by 5-HTTLPR gene polymorphisms in patients with less severe symptom but not in patients with severe symptom.
The limitations of this study include a small sample size and lack of control group. Further studies with a larger number of subjects are needed to confirm the results of this study. Although both antidepressants adopted in this study have the ability of inhibiting 5-HT reuptake, the exact mechanisms of action are different. This is also one of the limitations in this study. These results should also be confirmed outside of Japan because ethnic differences have been reported in studies seeking to determine the influence of 5-HTTLPR polymorphisms on the antidepressant response to SSRIs.
Author contributions
All authors made substantial contributions to conception and design, acquisition of data, or analysis and interpretation of data; took part in drafting the article or revising it critically for important intellectual content; gave final approval of the version to be published; and agree to be accountable for all aspects of the work.
Disclosure
The authors report no conflicts of interest in this work.
References
Owens MJ, Nemeroff CB. Role of serotonin in the pathophysiology of depression: focus on the serotonin transporter. Clin Chem. 1994;40(2):288–295. | ||
Heils A, Teufel A, Petri S, et al. Allelic variation of human serotonin transporter gene expression. J Neurochem. 1996;66(6):2621–2624. | ||
Lesch KP, Bengel D, Heils A, et al. Association of anxiety-related traits with a polymorphism in the serotonin transporter gene regulatory region. Science. 1996;274(5292):1527–1531. | ||
Smeraldi E, Zanardi R, Benedetti F, Di Bella D, Perez J, Catalano M. Polymorphism within the promoter of the serotonin transporter gene and antidepressant efficacy of fluvoxamine. Mol Psychiatry. 1998;3(6):508–511. | ||
Zanardi R, Benedetti F, Di Bella D, Catalano M, Smeraldi E. Efficacy of paroxetine in depression is influenced by a functional polymorphism within the promoter of the serotonin transporter gene. J Clin Psychopharmacol. 2000;20(1):105–107. | ||
Serretti A, Kato M, De Ronchi D, Kinoshita T. Meta-analysis of serotonin transporter gene promoter polymorphism (5-HTTLPR) association with selective serotonin reuptake inhibitor efficacy in depressed patients. Mol Psychiatry. 2007;12(3):247–257. | ||
Hu XZ, Rush AJ, Charney D, et al. Association between a functional serotonin transporter promoter polymorphism and citalopram treatment in adult outpatients with major depression. Arch Gen Psychiatry. 2007;64(7):783–792. | ||
Kim H, Lim SW, Kim S, et al. Monoamine transporter gene polymorphisms and antidepressant response in Koreans with late-life depression. JAMA. 2006;296(13):1609–1618. | ||
Yoshida K, Takahashi H, Higuchi H, et al. Prediction of antidepressant response to milnacipran by norepinephrine transporter gene polymorphisms. Am J Psychiatry. 2004;161(9):1575–1580. | ||
Ginsburg BE, Werick TM, Escobar JI, Kugelmass S, Treanor JJ, Wendtland L. Molecular genetics of psychopathologies: a search for simple answers to complex problems. Behav Genet. 1996;26(3):325–333. | ||
Suzuki A, Aoshima T, Fukasawa T, et al. A three-factor model of the MADRS in major depressive disorder. Depress Anxiety. 2005;21(2):95–97. | ||
Higuchi H, Sato K, Yoshida K, et al. Predictors of antidepressant response to fluvoxamine obtained using the three-factor structures of the Montgomery and Åsberg Depression Rating Scale for major depressive disorders in Japanese patients. Psychiatry Clin Neurosci. 2008;62(3):301–306. | ||
Montgomery SA, Åsberg M. A new depression scale designed to be sensitive to change. Br J Psychiatry. 1979;134:382–389. | ||
Yoshida K, Higuchi H, Kamata M, et al. The G196A polymorphism of the brain-derived neurotrophic factor gene and the antidepressant effect of milnacipran and fluvoxamine. J Psychopharmacol. 2007;21(6):650–656. | ||
Yoshida K, Ito K, Sato K, et al. Influence of the serotonin transporter gene-linked polymorphic region on the antidepressant response to fluvoxamine in Japanese depressed patients. Prog Neuropsychopharmacol Biol Psychiatry. 2002;26(2):383–386. | ||
Ito K, Yoshida K, Sato K, et al. A variable number of tandem repeats in the serotonin transporter gene does not affect the antidepressant response to fluvoxamine. Psychiatry Res. 2002;111(2–3):235–239. | ||
Sato K, Yoshida K, Takahashi H, et al. Association between 1438A promoter polymorphism in the 5-HT2A receptor gene and fluvoxamine response in Japanese patients with major depressive disorder. Neuropsychobiology. 2002;46(3):136–140. | ||
Higuchi H, Yoshida K, Takahashi H, et al. Milnacipran plasma levels and antidepressant response in Japanese major depressive patients. Hum Psychopharmacol. 2003;18(4):255–259. | ||
Ohkubo T, Shimoyama R, Otani K, Yoshida K, Higuchi H, Shimizu T. High-performance liquid chromatographic determination of fluvoxamine and fluvoxamino acid in human plasma. Anal Sci. 2003;19(6):859–864. | ||
Faul F, Erdfelder E, Lang AG, Buchner A. G*Power 3: a flexible statistical power analysis program for the social, behavioral, and biomedical sciences. Behav Res Methods. 2007;39(2):175–191. | ||
Cohen J. Statistical Power Analysis for the Behavioral Sciences. 2nd ed. Hillsdale, NJ: Erlbaum Associates; 1998. | ||
Lewis G, Mulligan J, Wiles N, et al. Polymorphism of the 5-HT transporter and response to antidepressants: randomised controlled trial. Br J Psychiatry. 2011;198(6):464–471. | ||
Umene-Nakano W, Yoshimura R, Ueda N, et al. Predictive factors for responding to sertraline treatment: views from plasma catecholamine metabolites and serotonin transporter polymorphism. J Psychopharmacol. 2010;24(12):1764–1771. | ||
Won ES, Chang HS, Lee HY, Ham BJ, Lee MS. Association between serotonin transporter-linked polymorphic region and escitalopram antidepressant treatment response in Korean patients with major depressive disorder. Neuropsychobiology. 2012;66(4):221–229. | ||
Kamata M, Suzuki A, Yoshida K, Takahashi H, Higuchi H, Otani K. Genetic polymorphisms in the serotonergic system and symptom clusters of major depressive disorder. J Affect Disord. 2011;135(1–3):374–376. | ||
Healy D, McMonagle T. The enhancement of social functioning as a therapeutic principle in the management of depression. J Psychopharmacol. 1997;11(4 suppl):S25–S31. | ||
Capuron L, Ravaud A, Dantzer R. Early depressive symptoms in cancer patients receiving interleukin 2 and/or interferon alfa-2b therapy. J Clin Oncol. 2000;18(10):2143–2151. | ||
Yates WR, Gleason O. Hepatitis C and depression. Depress Anxiety. 1998;7(4):188–193. | ||
Miller AH. Norman Cousins Lecture. Mechanisms of cytokine-induced behavioral changes: psychoneuroimmunology at the translational interface. Brain Behav Immun. 2009;23(2):149–158. | ||
Capuron L, Miller AH. Cytokines and psychopathology: lessons from interferon-alpha. Biol Psychiatry. 2004;56(11):819–824. | ||
Kamata M, Higuchi H, Yoshimoto M, Yoshida K, Shimizu T. Effect of single intracerebroventricular injection of alpha-interferon on monoamine concentrations in the rat brain. Eur Neuropsychopharmacol. 2000;10(2):129–132. | ||
Schaefer M, Schwaiger M, Pich M, Lieb K, Heinz A. Neurotransmitter changes by interferon-alpha and therapeutic implications. Pharmacopsychiatry. 2003;36(suppl 3):S203–S206. | ||
Müller MJ, Szegedi A, Wetzel H, Benkert O. Moderate and severe depression. Gradations for the Montgomery-Asberg Depression Rating Scale. J Affect Disord. 2000;60(2):137–140. |
 © 2017 The Author(s). This work is published and licensed by Dove Medical Press Limited. The
full terms of this license are available at https://www.dovepress.com/terms
and incorporate the Creative Commons Attribution
- Non Commercial (unported, 3.0) License.
By accessing the work you hereby accept the Terms. Non-commercial uses of the work are permitted
without any further permission from Dove Medical Press Limited, provided the work is properly
attributed. For permission for commercial use of this work, please see paragraphs 4.2 and 5 of our Terms.
© 2017 The Author(s). This work is published and licensed by Dove Medical Press Limited. The
full terms of this license are available at https://www.dovepress.com/terms
and incorporate the Creative Commons Attribution
- Non Commercial (unported, 3.0) License.
By accessing the work you hereby accept the Terms. Non-commercial uses of the work are permitted
without any further permission from Dove Medical Press Limited, provided the work is properly
attributed. For permission for commercial use of this work, please see paragraphs 4.2 and 5 of our Terms.