Back to Journals » Research and Reports in Urology » Volume 14
Association Between Prostate Size and MRI Determined Quantitative Prostate Zonal Measurements
Authors Sellers J, Wagstaff R, Helo N, de Riese WT ![]()
Received 16 February 2022
Accepted for publication 22 June 2022
Published 30 June 2022 Volume 2022:14 Pages 265—274
DOI https://doi.org/10.2147/RRU.S362070
Checked for plagiarism Yes
Review by Single anonymous peer review
Peer reviewer comments 4
Editor who approved publication: Dr Panagiotis J Vlachostergios
Jake Sellers,1 Rachel Wagstaff,1 Naseem Helo,2 Werner TW de Riese1
1Texas Tech University Health Sciences Center - School of Medicine, Department of Urology, Lubbock, TX, 79430-7260, USA; 2University Medical Center - Department of Radiology, Lubbock, TX, 79415, USA
Correspondence: Werner TW de Riese, Texas Tech University Health Sciences Center – Department of Urology, 3601 4 th Street, Lubbock, TX, 79430-7260, USA, Tel +1 806-743-3862, Fax +1 806-743-3030, Email [email protected]
Purpose: Benign prostatic hyperplasia (BPH) and prostate cancer (PCa) are the two most prevalent and common urologic diseases impacting elderly men. The current literature has well documented an inverse relationship between prostate/BPH-size and incidence of PCa, but the exact interaction between these two disease entities is not well understood. The purpose of this study is to analyze prostatic zonal measurements with magnetic resonance imaging (MRI) in order to investigate the dynamic changes of the transition zone (TZ) and peripheral zone (PZ) in response to prostate/BPH growth.
Methods: Multiparametric magnetic resonance imaging (mpMRI) scans of 430 consecutive male patients aged 18– 89 years were obtained to measure the different zonal areas of the prostate. The data were statistically analyzed to identify specific associations between the different measurement parameters and total prostate volume (TPV).
Results: The Mann–Whitney U-test showed a significant decline of the average peripheral zone thickness (PZT) (z = − 4.5665, p < 0.0001) in larger prostates when compared to smaller prostates. The Spearman correlation between TPV and PZT demonstrated a significant negative correlation (− 0.20, p < 0.0001).
Conclusion: The data revealed that PZT was significantly smaller in the subgroup of patients with higher TPV. This supports the hypothesis of PZ compression and thinning caused by the growing and expanding TZ in BPH prostates. This dynamic growth-related process in the different prostatic zones may explain the protective effect of BPH against PCa.
Keywords: BPH, MRI imaging, peripheral zone, central gland, measurements
Introduction
Benign prostatic hyperplasia (BPH) and Prostate Cancer (PCa) are the two most prevalent and common urologic diseases impacting elderly men. BPH affects almost half of all men in the later decades of their lives, and PCa is one of the most common lethal cancers affecting men in the United States.1,2 These two growth-related diseases often coexist with one another and are both related to the proliferation of prostatic tissue.3 However, the exact mechanism of interaction between BPH and PCa is currently not well understood.4 Recent literature has demonstrated an inverse relationship between BPH/ prostate-size and the incidence of PCa, and these findings are barely challenged. A recent systematic review and meta-analysis showed that 95% of the reviewed clinical studies reported a statistically significant inverse relationship between prostate volume and the incidence of biopsy-proven PCa.5
The zones of the prostate gland are divided into the central zone (CZ), transition zone (TZ), peripheral zone (PZ), and anterior fibromuscular stroma (AFS). These zones arise from different embryologic origins and are distinguished by their appearance, anatomic landmarks, biologic functions, and susceptibility to pathology.6 All these factors impact the development of BPH and PCa, and it is documented in anatomical and imaging studies that BPH mainly originates in the TZ, while 80–85% of PCa originates in the PZ.6–8
Magnetic resonance imaging (MRI) is a precise, systematic and noninvasive imaging technique in studying and measuring the different distinct zones within the prostate (in particular the PZ), providing a unique advantage when compared to transrectal ultrasound which is very operator-dependent.9,10 While the inverse relationship between BPH-size and PCa is clinically recognized, there are very limited studies discussing an explanation for this interaction. However, a better understanding of the etiology and interaction of both disease entities is crucial in order to reduce the current significant burden in morbidity and mortality. The purpose of this study is to provide prostatic zonal measurements through MRI technology to further investigate the dynamic changes in the TZ and PZ in response to prostate growth with possible implications on PCa development. The main goal is to determine the “fate” of the PZ in growing prostates and whether this zone grows with the prostate, stays “unchanged”, or gets thinner.
Materials and Methods
Study Design and Population
After obtaining the Internal Review Board (IRB) approval of Texas Tech University HSC, Lubbock, Texas (#L20-147), a retrospective study was conducted measuring the different zonal dimensions of the prostate using multi-parametric MRI imaging. The IRB waived the need to obtain informed consent due to meeting criteria in accordance with 45 CFR 46.104(d)(4)(iii) in which no identifying information was presented for the studied patients. The following study is in compliance with the Declaration of Helsinki, and the privacy of study participants was maintained with confidentiality. The studied patients were a consecutive cohort to reduce any potential selection bias and consisted of MRI films of the pelvis, including trauma and a workup for elevated PSA. The inclusion criteria for the study were: a) male patients who underwent MRI imaging of the pelvis between April 2019 and March 2020; and b) patients between the ages of 18 and 89 years. Exclusion criteria were: a) patients previously diagnosed and/or treated for any malignancy of the pelvis including prostate cancer; b) any type of previous androgen deprivation therapy or any hormonal therapy including 5α reductase inhibitors (5ARIs) such as finasteride; c) any type of previous radiation therapy of the pelvis, and/or prior surgical treatment of the prostate; and d) poor imaging technique. Cerner PowerChart and other accessible medical records were used to collect demographic and clinical parameters/variables (for details see Table 1). Race was self-reported.
 |
Table 1 Patients’ Characteristics by Total Prostate Volume (TPV) |
MRI Study
All imaging was obtained by a 3 Tesla Magnet, anterior cardiac coil MRI scanner at the University Medical Center in Lubbock, Texas. To avoid interpersonal variation of reading, all MRI scans were read by one experienced radiologist. Table 2 shows the detailed MRI protocol for this study according to PI-RADS guidelines.
 |
Table 2 MRI Protocol |
Measures
The investigating radiologist used the MRI scans to collect the following parameters for each patient: central gland length (CGL), width (CGW), and height (CGH) to determine central gland volume (CGV); total gland length (TGL), width (TGW), and height (TGH); peripheral zone volume (PZV); peripheral zone thickness (PZT) measured at 4:00, 6:00, and 8:00 positions to calculate average PZT. The measurements obtained at the 4:00, 6:00, and 8:00 positions were compiled from the mid-prostate, or equatorial level. This approach was based on previous histo-anatomical studies, which showed the mid-prostate to be the most representative area for the peripheral zone.8 The serum prostate-specific antigen (PSA) levels were obtained from blood samples.
The CGV was calculated according to the standard ellipsoid formula (length x width x height x (pi/6)). The sum of CGV and PZV is the total prostate volume (TPV).
Statistical Analysis
The relationship between TPV and PZT was analyzed. In the lower to mid-sized prostate volumes (<87.5 cc) the PZT values varied greatly from 1.56 mm to 15.3 mm. However, in the higher volume range (>87.5) the PZT does not extend beyond 9.233 mm other than one exception (12.6 mm).
In order to further elucidate the potential clinical ramifications of this difference in PZT, patients were stratified by TPV at or below 87.5 cc (lower TPV: n=393, TPV  =38.52 ± 18.68 cc) and TPV above 87.5 cc (higher TPV: n=37, TPV
  =117.89 ± 34.16 cc). An 87.5 cc cutoff was determined after graphing the data and analyzing the group’s averages. 87.5 cc was where the average PZT had the greatest difference in means for any separation value and provided a larger sample size for the larger prostate group.
A Mann–Whitney U-Test was performed to confirm if there was a difference between PZT for TPV subgroups, and t-tests were conducted between TPV subgroups to determine if there was a significant difference for all other parameters (see Table 1 for results). The Spearman correlation for TPV and PZT and Pearson correlations for TPV and the other secondary outcomes (CGL, CGW, CGH, CGV, TGL, TGW, TGH, PZV, PSA, age, and body mass index) were calculated and the results are listed in Table 3. A level of p <0.05 was considered statistically significant. All analyses were conducted using Statistical Analysis Software (SAS) Version 9.4 (SAS Institute Inc., Cary, NC, USA).
 |
Table 3 Correlation Table for Prostate Parameters in the Study Correlations (N = 430) |
Results
The relationship between TPV and prostatic zone values (PZT, CGV, and PZV) is depicted as scatterplots with the line of demarcation separating the lower to mid-sized prostates and large prostates (below and above 87.5 cc) in Figure 1A (TPV vs PZT), Figure 1B (TPV vs CGV) and Figure 1C (TPV vs PZV). The results of the Mann–Whitney U-test showed a significant difference (z=−4.5665, p<0.0001) between the average PZT for the lower and higher TPV subgroups. Furthermore, statistically significant differences between these two TPV subgroups were found for the following parameters: age, CGV, CG and TG length, width, and height and PZV. The Spearman correlation between TPV and PZT demonstrated a significant negative correlation (−0.20, p<0.0001). When grouped by TPV, only the lower subgroup (≤ 87.5 cc) demonstrated that TPV was weakly negatively, yet again statistically significantly, correlated with PZT (−0.11, p=0.02). Regarding the Pearson correlation results, strong correlations (all with p<0.0001) were found between TPV and the following variables: CGL (r=0.87), CGW (r=0.84), CGH (r=0.87), CGV (r=0.94), TGL (r=0.88), and TGH (r=0.90). A significant positive correlation was also found between TPV and age (r=0.28, p<0.0001).
 |
Figure 1 (A) Scatterplot of Total Prostate Volume (cc) and Peripheral Zone Thickness (mm): Each blue circle represents a patient’s measurement. The red line denotes the stratification line (87.5 cc) where patient’s PZT appeared, on average, significantly lower after 87.5 cc. (B) Scatterplot of Total Prostate Volume (cc) and Central Gland Volume (cc): Each blue circle represents a patient’s measurement. The red line denotes the stratification line (87.5 cc) where patient’s CGV appeared, on average, significantly higher after 87.5 cc. (C) Scatterplot of Total Prostate Volume (cc) and Peripheral Zone Volume (cc): Each blue circle represents a patient’s measurement. The red line denotes the stratification line (87.5 cc) where patient’s PZV appeared, on average, significantly higher after 87.5 cc. |
Figure 2 illustrates the MRI findings of a small prostate (30 cc) where the PZ is relatively thick when compared to Figure 3 that illustrates the MRI findings of a large prostate (137 cc) where the PZ is much thinner.
 |
Figure 2 Example of MRI scan of a small prostate (30 cc): Axial T2 image of the mid-gland region of a prostate with total volume of 30 cc showing a relatively thick peripheral zone as delineated by the red arrows. |
 |
Figure 3 Example of MRI scan of a large prostate (137 cc): Axial T2 image of the prostate gland within the mid-gland region of a prostate with total volume of 137 cc showing a relatively thin peripheral zone (when compared to Figure 2) as delineated by the red arrows. |
Discussion
The inverse relationship between prostate/ BPH-size and PCa incidence has been established in various studies.1,11–15 Furthermore, an extensive review conducted by an international group of co-authors revealed favorable cancer prognosis in larger prostates.1 Additionally, Freeland et al found in a cohort of men treated with radical prostatectomy an inverse correlation between prostate size and high grade disease.15 Al-Khalil et al reported for prostates greater than 65 cc in size a 40% reduction in PCa incidence.16 While these findings have not been challenged in the recent literature, the exact etiology of this clinical phenomenon is not well understood, and therefore, further research is necessary to elucidate the interaction between BPH and PCa incidence.
The anatomical capsule in young males is a “false capsule” that forms posteriorly and laterally around the prostate (and is mainly absent in the anterior aspect of the prostate).17,18 This anatomical “incomplete” capsule derives from the peri-prostatic pelvic fascia and is composed of smooth muscle cell layers with an outer collagenous layer.17,18 Large BPH prostates in elderly men develop fibrotic and collagenous layers adjacent and inwardly from the anatomical capsule, causing thickening of the anatomical capsule. Since the introduction of BPH surgery, experienced urologists call this thickened fibrotic layer in large BPH the “surgical capsule”, a well-known phenomenon in large prostates (>80 cc, where the surgical capsule allows the surgeon an easy enucleation of the BPH component/ removal of the adenoma).18,19 This surgical phenomenon is much less pronounced in smaller prostates.
This clinical observation correlates with histo-anatomical studies showing significant structural changes within the PZ associated with BPH growth resulting in thickening of fibrotic layers adjacent and inward to the anatomical capsule.11 This process leads to an increased capsular thickness with widespread epithelial atrophy and decreased glandular density within the PZ.11 These study results have suggested that the TZ growth in BPH is causing mechanical stress on the cells within the PZ leading to secondary fibrosis and glandular atrophy. The changes within the PZ are more pronounced in larger prostates when compared to smaller prostates. Guzman et al have well illustrated this disease process and zonal histo-anatomical changes as shown in Figures 4 and 5.20 As 80–85% of PCa originates in the PZ, the compression effect on the PZ in larger prostates may be one the main mechanisms of a protective effect against development of PCa.6,13 However, the histo-anatomical studies are limited due to the inability in delineating the exact boundary between the TZ and the PZ, and thus lack of exact zonal thickness measurements.11
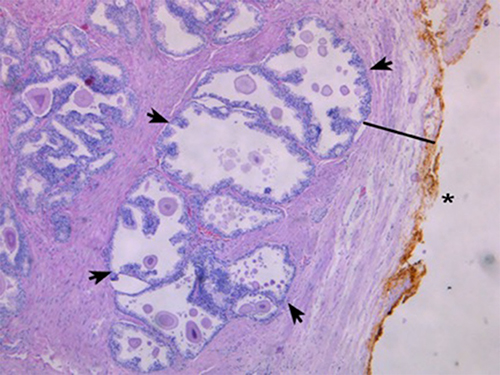 |
Figure 4 Example of a small prostate specimen (24 cc), H&E stained at 50× magnification: The external, posterior margin is inked and marked with an asterisk (*). A decent number of hyperplastic glands (as indicated by arrows) are present and easily visible in the peripheral zone (PZ) (black line) close to the thin capsule. Reprinted with permission from Guzman JA, Sharma P, Smith LA, Buie JD, de Riese WT. Histological changes of the peripheral zone in small and large prostates and possible clinical implications. Res Rep Urol. 2019;11:77–81. Copyright © 2019 Dove Medical Press.20 |
 |
Figure 5 Example of a large prostate specimen (100 cc), H&E stained at 50× magnification (as in Figure 4): The external, posterior margin is also inked and marked with an asterisk (*). The arrow is indicating an atrophic gland within the extended fibrotic layer/ surgical capsule (black line). This capsule is much thicker in comparison to Figure 4, and no hyperplastic glands are present. Reprinted with permission from Guzman JA, Sharma P, Smith LA, Buie JD, de Riese WT. Histological changes of the peripheral zone in small and large prostates and possible clinical implications. Res Rep Urol. 2019;11:77–81. Copyright © 2019 Dove Medical Press.20 |
Unlike histo-anatomical studies, MRI imaging provides excellent visualization of the PZ, specifically the boundary of the PZ and the TZ, and therefore allowing exact measurements of PZT.20 This visualization in MRI imaging is much better than in transrectal ultrasound where imaging is less standardized and more operator-dependent.21,22
To our knowledge, this is the first report of an extensive cohort using MRI imaging to study the anatomical changes and the “fate” of the PZ in response to BPH growth. We hypothesize that carcinoma occurs less frequently in the PZ with increasing size of the central gland due to anatomic reduction in PZ zonal volume from mechanical stress by TZ growth. According to the presented data, once 87.5 cc of total prostate gland volume is reached, a noticeable drop in average PZT was observed. A possible interpretation of this finding could be that the PZ is able to resist pressure caused by TZ/ BPH growth to a certain point (around 87.5 cc of total prostate gland volume in our study). After this level of BPH volume and secondary tissue/mechanical pressure, the PZ may be subjected to thinning, as seen by the significant decrease in average PZT for patients above 87.5 cc of total prostate gland volume. Figures 2 and 3 illustrate this phenomenon well in two cases: A small prostate (30cc) with a thick PZ (Figure 2), and a large prostate (137cc) with a much thinner PZ (Figure 3). This observed drop in PZT supports the hypothesis that BPH-induced TZ growth leads to thinning of the PZ region and thus may provide a protective effect against PCa development as 80–85% of PCa originates in the PZ.
This inverse relationship between BPH size and incidence of PCa caused by the expansion of the TZ with presumable secondary mechanical stress on the PZ (as outlined above) may also explain the results of The Prostate Cancer Prevention Trial, where almost 19,000 patients received continuous Finasteride medication. The treatment arm showed a more than twofold increase in high grade aggressive PCa. Finasteride as a 5ARI is known to affect and reduce the growth of the TZ, thus giving the glandular epithelium of the PZ more room within the prostate to grow and expand. This clinical observation has been confirmed by Lorenzo et al in mathematical simulation studies analyzing the effects of 5ARIs, and found that “the shrinkage of the prostate induced by 5ARIs reduced the mechanical stress that had accumulated over years in BPH prostatic tissue leading to a mechanical state that favored the development of PCa”.13 This hypothesis of a cancer-protective effect in BPH is also supported by a recently published systematic review and meta-analysis of more than 40 studies which confirmed an inverse (negative) association between prostate gland volume and incidence of prostate cancer. Sample sizes ranged from 114 to 6692 patients.5 Thirty-nine (95%) of the 41 studies showed a statistically significant inverse relationship, but no study could be found in this extensive literature search showing the contrary (a positive correlation between BPH size and the incidence of PCa).5
We acknowledge several limitations of this presented MRI study. The scans were reviewed and examined by one single (although MRI-experienced) radiologist, exposing the results to potential user bias. Using several experienced radiologists could limit user-error and bias. Also, all MRI imaging was done in one institution. Reproducing the data in a multi-institutional setting would increase the validity of the findings across larger populations. Additionally, due to the clinical phenomenon that very large prostates are less common and because this study has been a consecutive cohort, there is a difference of subgroup-size with large and smaller prostates. The subgroup above 87.5 cc contains 37 subjects, and the subgroup below 87.5 cc contains 393 subjects. Extra data points in the larger TPV subgroup would be more optimal for data uniformity. Finally, there are only few reports regarding the effect of TPV on PZT, and further investigations of this phenomenon are necessary to increase the statistical power and validity of our findings. As mentioned earlier, the cohort of our study includes a wide range of MRI indications including pelvic trauma and many patients did not undergo any form of prostate biopsy technique. Therefore, this study is not suitable to analyze and compare incidences of biopsy-proven PCa between any subgroups.
Despite these limitations, this study provides further evidence in supporting the hypothesis that prostate/ BPH size may be protective against PCa. We hope our study encourages other clinicians and researchers to further investigate the dynamic relationship between BPH and PCa. If the hypothesis of protective features within BPH against PCa is correct, it will surely impact future diagnosis and treatment of BPH and PCa.
Conclusion
This MRI study outlines the anatomical changes of the peripheral zone in relation to prostate/ BPH size. The observed anatomical zonal changes may explain the well-documented inverse correlation between BPH-size and incidence of PCa. The presented data supports the hypothesis that the TZ enlargement in growing BPH compresses the PZ with secondary thinning. Histo-anatomical studies have well documented increased fibrosis and glandular atrophy within the PZ secondary to BPH growth. Combining these results with the observed MRI finding of PZ thinning in larger prostates should lead to a reduced total glandular epithelial volume within the PZ where 80–85% of PCa originates. This mechanism in large BPH prostates may be protective against PCa. Our study should encourage further investigations into the dynamic relationship between prostate volume and the incidence and severity of prostate cancer. If the outlined hypothesis is correct, there will be relevant clinical implications on the future diagnosis and treatment of BPH and PCa.
Disclosure
The authors report no conflicts of interest in this work.
References
1. Alcaraz A, Hammerer P, Tubaro A, Schröder FH, Castro R. Is there evidence of a relationship between benign prostatic hyperplasia and prostate cancer? Findings of a literature review. Eur Urol. 2009;55(4):864–875. doi:10.1016/j.eururo.2008.11.011
2. Kelly SP, Anderson WF, Rosenberg PS, Cook MB. Past, current, and future incidence rates and burden of metastatic prostate cancer in the United States. Eur Urol Focus. 2018;4(1):121–127. doi:10.1016/j.euf.2017.10.014
3. Siegel R, Naishadham D, Jemal A. Cancer statistics, 2013. CA Cancer J Clin. 2013;63(1):11–30. doi:10.3322/caac.21166
4. Dai X, Fang X, Ma Y, Xianyu J. Benign prostatic hyperplasia and the risk of prostate cancer and Bladder Cancer. Medicine. 2016;95:18. doi:10.1097/md.0000000000003493
5. Yamashiro JR, de Riese WTW. Any correlation between prostate volume and incidence of prostate cancer: a review of reported data for the last thirty years. Res Rep Urol. 2021;13:749–757. doi:10.2147/rru.s331506
6. Grignon DJ, Sakr WA. Zonal origin of prostatic adenocarcinoma: are there biologic differences between transition zone and peripheral zone adenocarcinomas of the prostate gland? J Cell Biochem. 1994;1(Supplement. 19):267–269.
7. Weaver PE, Smith LA, Sharma P, Keesari R, Al Mekdash H, de Riese WT. Quantitative measurements of prostate capsule and gland density and their correlation to prostate size: possible clinical implications in prostate cancer. Int Urol Nephrol. 2020;52(10):1829–1837. doi:10.1007/s11255-020-02527-6
8. Holder K, Galvan B, Sakya J, Frost J, de Riese W. Anatomical changes of the peripheral zone depending on benign prostatic hyperplasia size and their potential clinical implications: a review for Clinicians. Urol Practice. 2021;8(2):259–263. doi:10.1097/upj.0000000000000201
9. Peng Y, Shen D, Liao S, et al. MRI-based prostate volume-adjusted prostate-specific antigen in the diagnosis of prostate cancer. J Magnetic Resonance Imaging. 2015;42(6):1733–1739. doi:10.1002/jmri.24944
10. Matsugasumi T, Fujihara A, Ushijima S, et al. Morphometric analysis of prostate zonal anatomy using Magnetic Resonance Imaging: impact on age-related changes in patients in Japan and the USA. BJU Int. 2017;120(4):497–504. doi:10.1111/bju.13823
11. Frost JM, Smith LA, Sharma P, de Riese WT. Possible clinical implications of peripheral zone changes depending on prostate size. Int Urol Nephrol. 2019;51(10):1721–1726. doi:10.1007/s11255-019-02221-2
12. Al-Khalil S, Boothe D, Durdin T, et al. Interactions between benign prostatic hyperplasia (BPH) and prostate cancer in large prostates: a Retrospective Data Review. Int Urol Nephrol. 2015;48(1):91–97. doi:10.1007/s11255-015-1146-2
13. Lorenzo G, Hughes TJ, Dominguez-Frojan P, Reali A, Gomez H. Computer simulations suggest that prostate enlargement due to benign prostatic hyperplasia mechanically impedes prostate cancer growth. Proc National Acad Sci. 2019;116(4):1152–1161. doi:10.1073/pnas.1815735116
14. Sellers J, Wagstaff RG, Helo N, de Riese WT. Quantitative measurements of prostatic zones by MRI and their dependence on prostate size: possible clinical implications in prostate cancer. Ther Adv Urol. 2021;13:175628722110008. doi:10.1177/17562872211000852
15. Freedland SJ, Isaacs WB, Platz EA, et al. Prostate size and risk of high-grade, advanced prostate cancer and biochemical progression after radical prostatectomy: a search database study. J Clin Oncol. 2005;23(30):7546–7554. doi:10.1200/jco.2005.05.525
16. Al-Khalil S, Ibilibor C, Cammack J, de Riese W. Association of prostate volume with incidence and aggressiveness of prostate cancer. Res Rep Urol. 2016;8:201–205. doi:10.2147/rru.s117963
17. Ayala AG, Ro JY, Babaian R, Troncoso P, Grignon DJ. The prostatic capsule. Am J Surg Pathol. 1989;13(1):21–27. doi:10.1097/00000478-198901000-00003
18. McNeal J. Central Zone histology of the prostate. Hum Pathol. 2003;34(3):298. doi:10.1053/hupa.2003.18
19. Semple JE. Surgical capsule of the benign enlargement of the prostate. BMJ. 1963;1(5346):1640–1643. doi:10.1136/bmj.1.5346.1640
20. Guzman JA, Sharma P, Smith LA, Buie JD, de Riese WT. Histological changes of the peripheral zone in small and large prostates and possible clinical implications. Res Rep Urol. 2019;11:77–81. doi:10.2147/rru.s182781
21. Hoeks CM, Barentsz JO, Hambrock T, et al. Prostate cancer: multiparametric MR imaging for detection, localization, and staging. Radiology. 2011;261(1):46–66. doi:10.1148/radiol.11091822
22. Hricak H, Dooms GC, McNeal JE, et al. MR imaging of the prostate gland: normal anatomy. Am J Roentgenol. 1987;148(1):51–58. doi:10.2214/ajr.148.1.51
 © 2022 The Author(s). This work is published and licensed by Dove Medical Press Limited. The
full terms of this license are available at https://www.dovepress.com/terms
and incorporate the Creative Commons Attribution
- Non Commercial (unported, 3.0) License.
By accessing the work you hereby accept the Terms. Non-commercial uses of the work are permitted
without any further permission from Dove Medical Press Limited, provided the work is properly
attributed. For permission for commercial use of this work, please see paragraphs 4.2 and 5 of our Terms.
© 2022 The Author(s). This work is published and licensed by Dove Medical Press Limited. The
full terms of this license are available at https://www.dovepress.com/terms
and incorporate the Creative Commons Attribution
- Non Commercial (unported, 3.0) License.
By accessing the work you hereby accept the Terms. Non-commercial uses of the work are permitted
without any further permission from Dove Medical Press Limited, provided the work is properly
attributed. For permission for commercial use of this work, please see paragraphs 4.2 and 5 of our Terms.