Back to Journals » Journal of Pain Research » Volume 13
Association Between Multimorbid Disease Patterns and Pain Outcomes Among a Complex Chronic Care Population in Canada
Authors Ferguson M, Svendrovski A ![]() , Katz J
, Katz J ![]()
Received 27 June 2020
Accepted for publication 8 October 2020
Published 20 November 2020 Volume 2020:13 Pages 3045—3057
DOI https://doi.org/10.2147/JPR.S269648
Checked for plagiarism Yes
Review by Single anonymous peer review
Peer reviewer comments 4
Editor who approved publication: Professor Robert B. Raffa
Meaghan Ferguson,1 Anton Svendrovski,2 Joel Katz1
1Department of Psychology, Faculty of Health, York University, Toronto, Ontario, Canada; 2Department of Psychology, UZIK Consulting Inc, Toronto, Ontario, Canada
Correspondence: Meaghan Ferguson; Joel Katz
York University, 232 Behavioural Science Building, 4700 Keele Street, Toronto M3J 1P3, Ontario, Canada
Tel +1 647 218 6717
; +1 416 736 2100 ext. 40557
Email [email protected]; [email protected]
Purpose: Disease multimorbidity and pain is a complex, yet common, problem for the aging population, and a significant burden on the health-care systems around the world. Despite this, disease comorbidity and the association with pain in a complex chronic care population is not well understood. This study examined the most prevalent disease combinations and their association with pain.
Patients and Methods: The study initially included 139,920 residents, aged 18– 101 years, admitted to publicly funded hospital facilities for complex chronic care in Canada between the years 2006 and 2016. Data were acquired through the Canadian Institute for Health Information (CIHI) Facility-Based Continuing Care Reporting System (CCRS). Descriptive and chi-square statistics were used to summarize and compare the sample characteristics. Binary logistic regression analyses were used to examine the association between multimorbid disease categories and pain outcomes.
Results: The sample consisted of 139,573 residents (57% female), mostly older (mean age = 77.32 years), married (40%), or widowed (36%). Residents took an average of 11.9 medications and 77% were using analgesic medications. On average, residents had diagnoses from 3.06 disease categories (SD = 1.43). Heart/circulation diseases were the most prevalent among the sample (73%), with neurological second (46%) and musculoskeletal third (44%). Overall, 73% of residents reported pain, with 43% reporting moderate pain severity. Residents with multiple disease categories were more likely to report the presence of pain (OR = 1.08, 95% CI: 1.07– 1.08, p < 0.001), with each additional disease category associated with an 8% increase in the odds of reporting pain.
Conclusion: The findings from this study help identify common comorbid disease patterns related to pain in an institutionalized, complex chronic care population. This information contributes to both the pain and multimorbidity literature, and is invaluable for creating care plans to meet the demands of a challenging population.
Keywords: complex chronic disease, comorbidity, disease categories, health, health psychology
Introduction
As life expectancy increases with every passing decade, more and more individuals are developing multiple chronic health problems.1 A growing number of Canadians live with chronic health conditions that can be classified as complex chronic disease (CCD). A CCD is a condition involving multiple morbidities (MM) and a combination of functional,2,3 social,4 vocational5 and/or mental health challenges.6 Although the disease combinations that comprise multimorbidity are diverse, the most common diagnoses are diabetes, stroke, hypertension, cancer, arthritis, asthma, fractures, the presence of an artificial knee or hip, fatigue, multiple sclerosis, demyelinating diseases of the central nervous system, gonarthrosis, ataxia, COPD, renal failure, malignant neoplasm of breast/prostate, depressive episodes and anxiety, and hypercholesterolemia.7,8
Managing the demands of the CCD population and their multiple health needs can be difficult and problematic for primary health-care providers and the residents themselves.9 Primary, acute health-care services and facilities are generally unequipped to handle the health demands of the CCD population.10 In fact that the CCD population utilizes considerable province- and country-wide health-care resources, and represents one of the heaviest users of the Canadian health-care system as a whole.11–14
Complicating this complex health profile further, many individuals experience chronic pain in association with multiple other medical and health problems.15,16 Chronic pain alone is a prevalent and often debilitating condition that has significant negative effects on the individual and the health-care system, as it has been associated with declines in activities of daily living, loss of employment, mental health problems, large medical system expenditures and poor self-rated health and health-related quality of life (HRQoL).17,18 Alarmingly, suicidality also doubles among chronic pain residents due to the associated emotional toll.19
Despite the complexities associated with pain and multimorbidity, very little is known about this population, particularly as it relates to trends in disease comorbidity, progression, and pain, disability, and treatment management.7 In light of this overlapping information and the lack of understanding of pain and disease complexity within an elderly, health-complicated population, the current study seeks investigate relevant combinations of multimorbidity, specifically the most prevalent combinations associated with pain outcomes within a CCD population.
Objectives
This study investigates relevant combinations of multimorbidity associated with pain. Pain prevalence, intensity and frequency are examined in relation medical disease categories, as well as, combinations of two to five of the most prevalent multimorbid disease categories among this adult, CCD population. The study has several specific aims:
1) Examine and compare demographic, medication usage and pain variables of the CCD population, and identify the top five most frequent single disease category and most frequent multimorbid two, three, four and five disease categories;
2) Examine the association of specific disease categories with pain prevalence;
3) Examine the association of the number of disease categories with pain prevalence;
4) Identify and compare the most prevalent disease categories and the most prevalent multimorbid combinations of two, three, four and five disease categories and the association with pain prevalence.
Patients and Methods
Data Source
This study used data from the Canadian Institute for Health Information (CIHI) Facility-Based Continuing Care Reporting System (CCRS), which captures information on individuals admitted to publicly funded hospital facilities for complex chronic care in Canada (Continuing Care Reporting System, 2013–2014) between the years 2006 and 2016. Access to this dataset was obtained through the CIHI Graduate Student Data Access Program (GSDAP). CIHI data is freely available to qualifying graduate students through the GSDAP (https://www.cihi.ca/en/graduate-student-data-access-program). Upon entry to a complex chronic care (CCC) facility, residents are administered a standardized assessment protocol, the Resident Assessment Instrument – Minimum Data Set/Full Assessment (RAI-RAI/MDS/FA 2.0 Canadian Version), within 14 days of admission. If the resident remains in the facility for longer than 92 days, quarterly assessments are conducted. These assessments are typically completed by the treating nurse or physician and include resident self-reports and information from medical files. All residents between the ages of 18 and 101 years, assessed between 2006 and 2016, from Ontario facilities, were included in the study.
The RAI/MDS/FA 2.0 is an internationally validated clinical assessment instrument.20–25 This standard tool collects a wide array of information, including basic demographic characteristics, diagnostic profiles, medication usage and treatment participation, and outcomes, as well as categorizes diseases.
Disease Categories/Multimorbidity
The disease categories explored in this study were taken directly from RAI/MDS/FA 2.0. Table 1 provides a description of the disease categories and specific diseases found in the RAI/MDS/FA 2.0. Regarding the definition of multimorbidity, there is no internationally accepted list or system for classifying disease states/diagnoses.26,27 The most widely accepted approach for assessing multimorbidity within epidemiological research is to use a numerical count (two or more) of concurrent diseases in the same individual.28 Consistent with this literature, the current study utilized this method of assessment to quantify disease counts among all subjects and multimorbidity was defined as having 2 or more diagnoses.
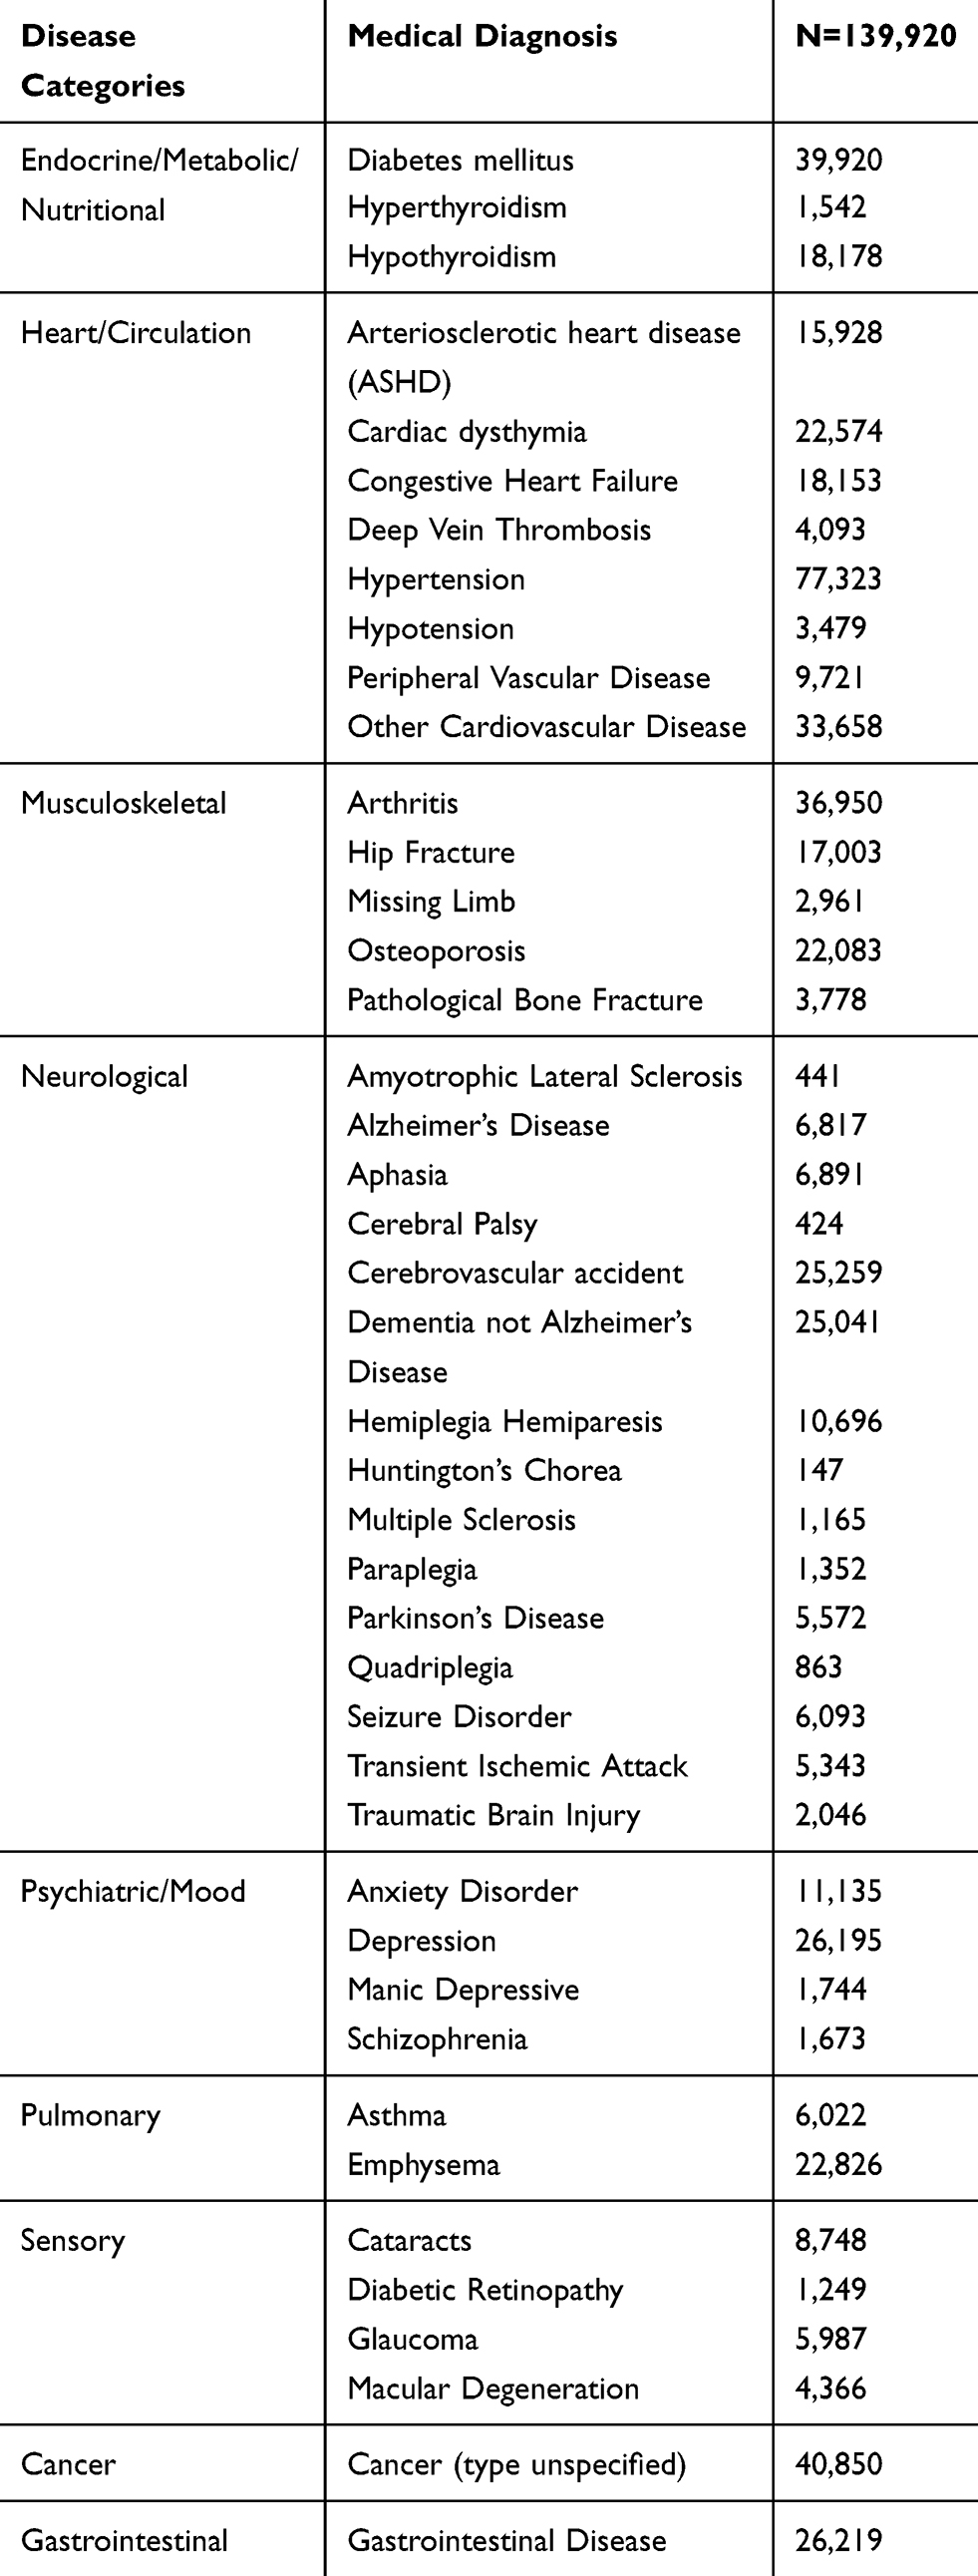 |
Table 1 Disease Categories and Medical Diagnoses Listed in the CCRS RAI/MDS/FA 2.0 |
Pain Measures
The CCRS RAI/MDS/FA 2.0 measures pain using two descriptive scales:
- Frequency: no pain (0), pain less than daily (1), pain daily (2); and,
- Intensity: mild pain (1), moderate pain (2), times when pain is horrible or excruciating (3).
For the present study, we created, three measures of pain by combining various items from the above two existing CCRS RAI/MDS/FA 2.0 scales:
1)P-Y/N: Pain prevalence dichotomous measure: no pain (0); pain (1) (mild, moderate, severe);
2)PI-4: 4-point pain intensity scale (PI-4): no pain (0), mild pain (1), moderate pain (2), severe pain (3);
3)PIPF-7: 7-point combined pain intensity and pain frequency scale (PIPF-7): no pain (0); mild pain less than daily (1); mild pain daily (2); moderate pain less than daily (3); moderate pain daily (4); severe pain less than daily (5); severe pain daily (6).
Data Analysis
All data used in this study is derived from the initial assessment of all residents, aged 18–101 years, from Ontario’s CCC facilities between the years 2006 and 2016, reported in the CIHI CCRS dataset.
Objective 1
Descriptive statistics were used to summarize the characteristics of the sample. Frequencies and proportions were used for categorical variables, and mean, standard deviation, and range for numerical variables. A Chi-square test was used to compare demographic variables of sex, marital status and analgesic use, and binary logistic regression for age and other medication usage.
Objective 2
As noted above, the CCRS RAI/MDS/FA 2.0 resident’s medical diagnoses are classified into nine disease categories (refer to Table 1). With respect to evaluating the association of pain prevalence (P-Y/N) with specific disease categories, a binary logistic regression model was used. The regression analyses were modelled two times: first, using predictive demographic variables (sex, age, marital status) and medication use (use of analgesics, number of medications used in the last 7 days); and second, controlling demographics, medication use and disease categories.
Objective 3
The association of the number of disease categories and multimorbid combinations on pain prevalence were assessed using binary regression analysis. Again, the analyses were modelled two times, similar to objective two.
Objective 4
We explored the reported pain prevalence of the top five single disease categories and the most prevalent multimorbid combinations of two to five disease categories. The decision to not exceed five multimorbid combinations was intentional, as to encapsulate the majority of the population. The population of residents diagnosed with more than five disease categories significantly decreases as the number of categories increases. On average, residents have diagnoses within three different disease categories (M = 3.06; SD = 1.43); therefore, by examining combinations of five, we were able to include the majority of the sample. In order to compare pain variables between disease categories, frequencies for PI-4 and PIPF-7 ratings were obtained for each disease category and subsequent Chi-Square analysis were performed. Descriptive statistics were used to calculate the proportion of pain ratings for each combination of disease categories and ranked according to the top five categories with the highest proportion of pain reported.
All inferential statistical analyses were performed using IBM SPSS software version 26 (Armonk, NY, USA). P-values < 0.05 are reported as statistically significant. Odds ratios and corresponding 95% confidence intervals are reported for regression model outcomes. The study was reviewed and approved by the York University research ethics board (Human Participants Research Committee) prior to receiving the data from the Canadian Institutes of Health Information.
Results
Objective 1: Examine and Compare Demographic and Pain Variables of the CCD Population
All medical diagnoses were classified into one of the nine disease categories (Table 1). Demographic variables, number of diseases, medical characteristics, and pain measures are shown in Table 2. The sample consisted of 139,573 residents (57% female), mostly older (mean age = 77.32 years), married (40%), or widowed (36%). Residents took an average of 11.9 medications. More than 3/4 (77%) were using analgesic medications. The vast majority of residents were classified as having heart/circulation conditions (73%), followed by neurological conditions (46%) and musculoskeletal disorders (44%). On average, residents have diagnoses from 3.06 disease categories (SD = 1.43). Fifteen percent of residents have medical diagnoses from five or more diagnostic categories. Table 3 shows the five most prevalent multimorbid combinations of one, two, three, four and five disease groups. Cancer was identified as the most prevalent individual disease category (3.64%).
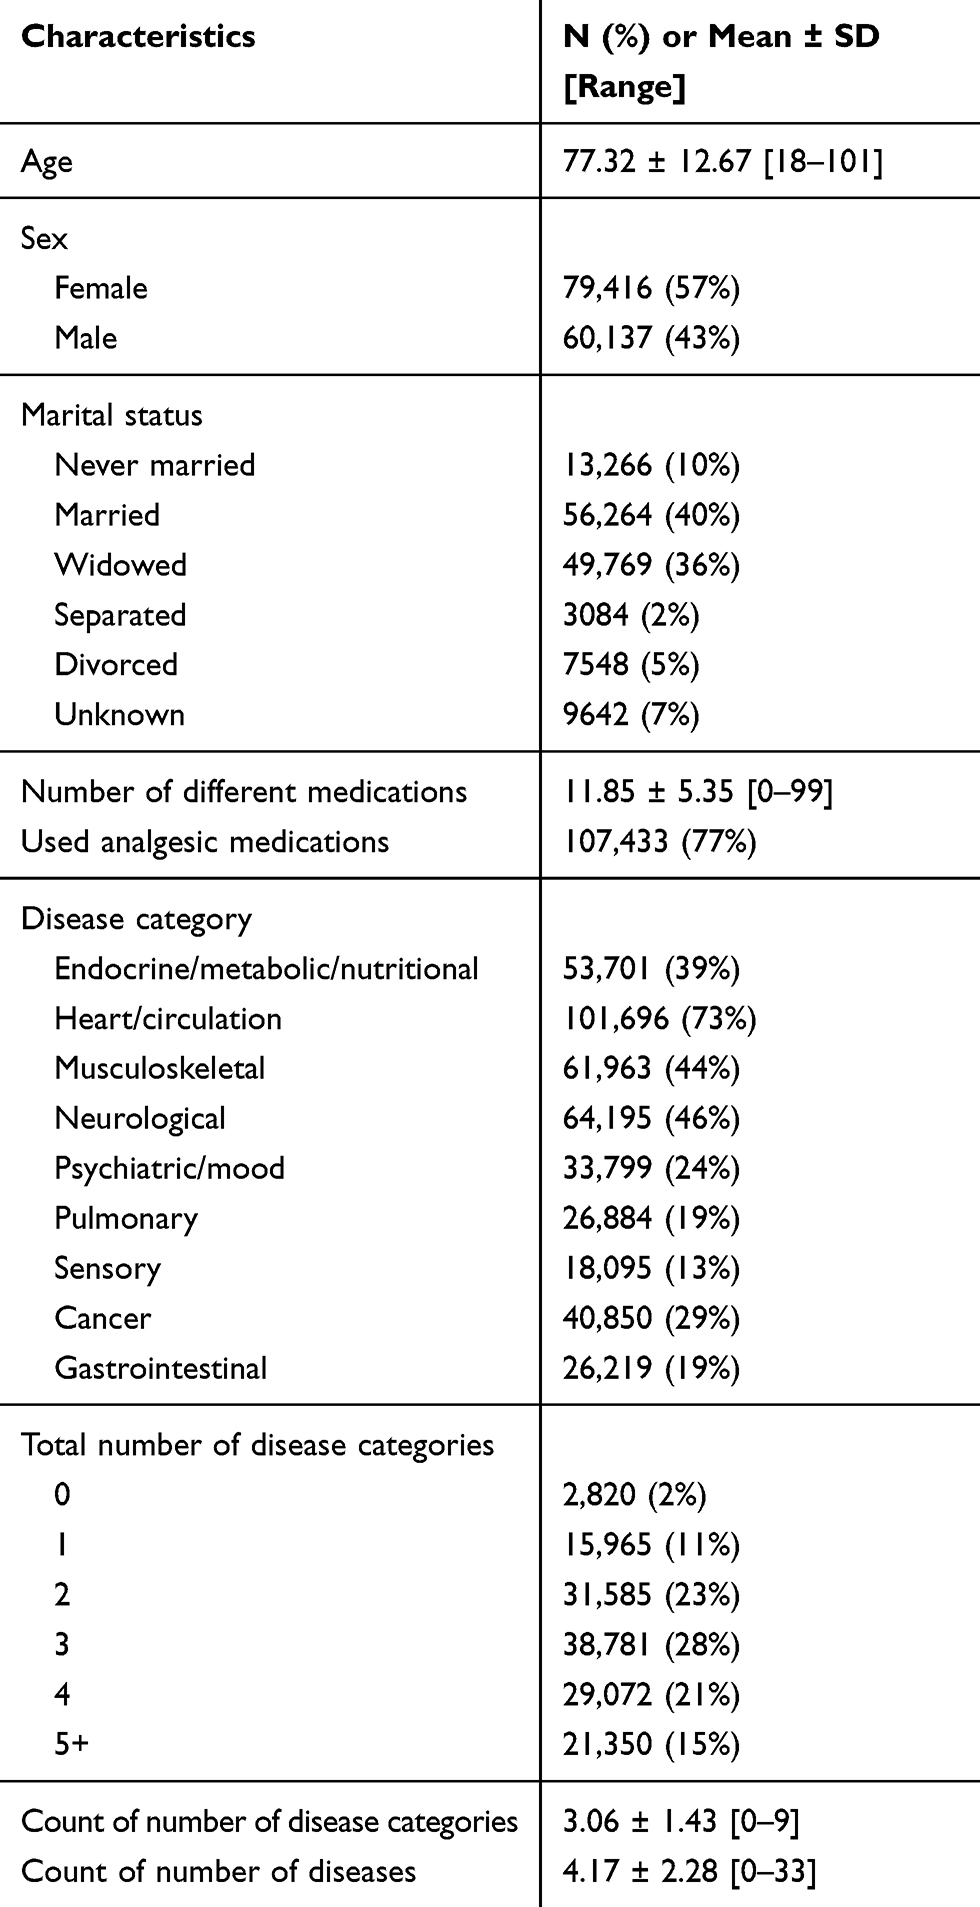 |
Table 2 Descriptive Characteristics of the Sample, n = 139,573 |
 |
Table 3 The Five Most Prevalent Combinations of One, Two, Three, Four and Five Disease Categories, Respectively |
Table 4 highlights the frequencies of reported pain levels (P-Y/N; PI-4; PIPF-7), regardless of the resident’s medical diagnosis or disease category. Overall, 73% of residents report pain (P-Y/N), and more specifically, the majority of residents report moderate intensity pain (43%; PI-4), and 8% report severe intensity pain (PI-4; 9% on PIFI-7).
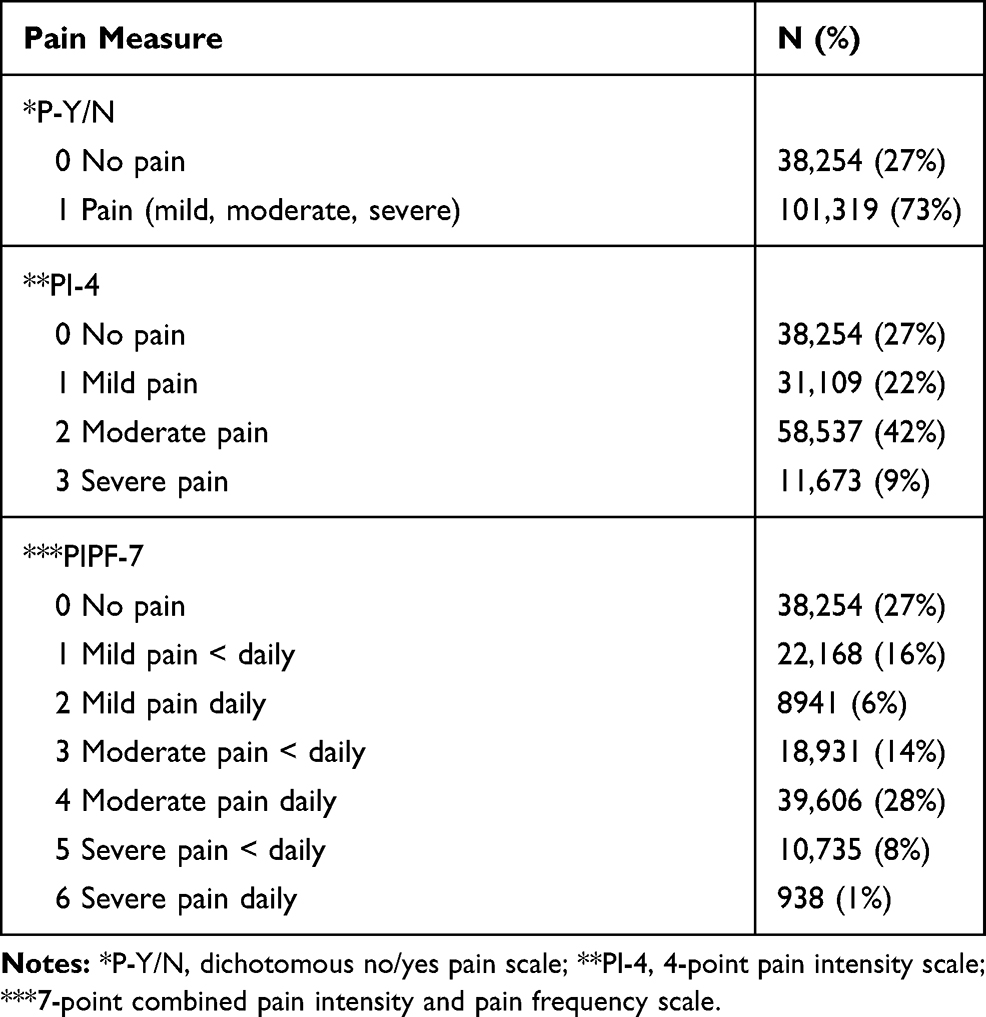 |
Table 4 Frequencies of Residents Reporting Various Levels of Pain on the Three Pain Measures Used in the Present Study |
Table 4 highlights the frequencies of reported pain levels (P-Y/N; PI-4; PIPF-7), regardless of the resident’s medical diagnosis or disease category. Overall, 73% of residents report pain (P-Y/N), and more specifically, the majority of residents report moderate intensity pain (43%; PI-4), and 8% report severe intensity pain (PI-4; 9% on PIFI-7).
All variables (sex, marital status, age, number of different medications used in the last 7 days, and use of analgesic medication) show statistically significant association with the dichotomous pain outcome (P-Y/N) (Table 5). The proportion of female residents reporting pain (76%) was significantly greater than males (68%). The proportion of separated (75%) and divorced (74%) residents was significantly higher than never married residents (71%). Older residents were less likely to have mild/moderate/severe pain (about 0.8% less likely to report pain for each year of age) than younger residents. Residents using more medications had higher odds of reporting pain (about 8.5% for each additional medication). The use of analgesic medications is the single most significant predictor of pain. Of residents who used analgesic medications, 86% reported pain compared to only 28% among residents who did not use analgesic medications.
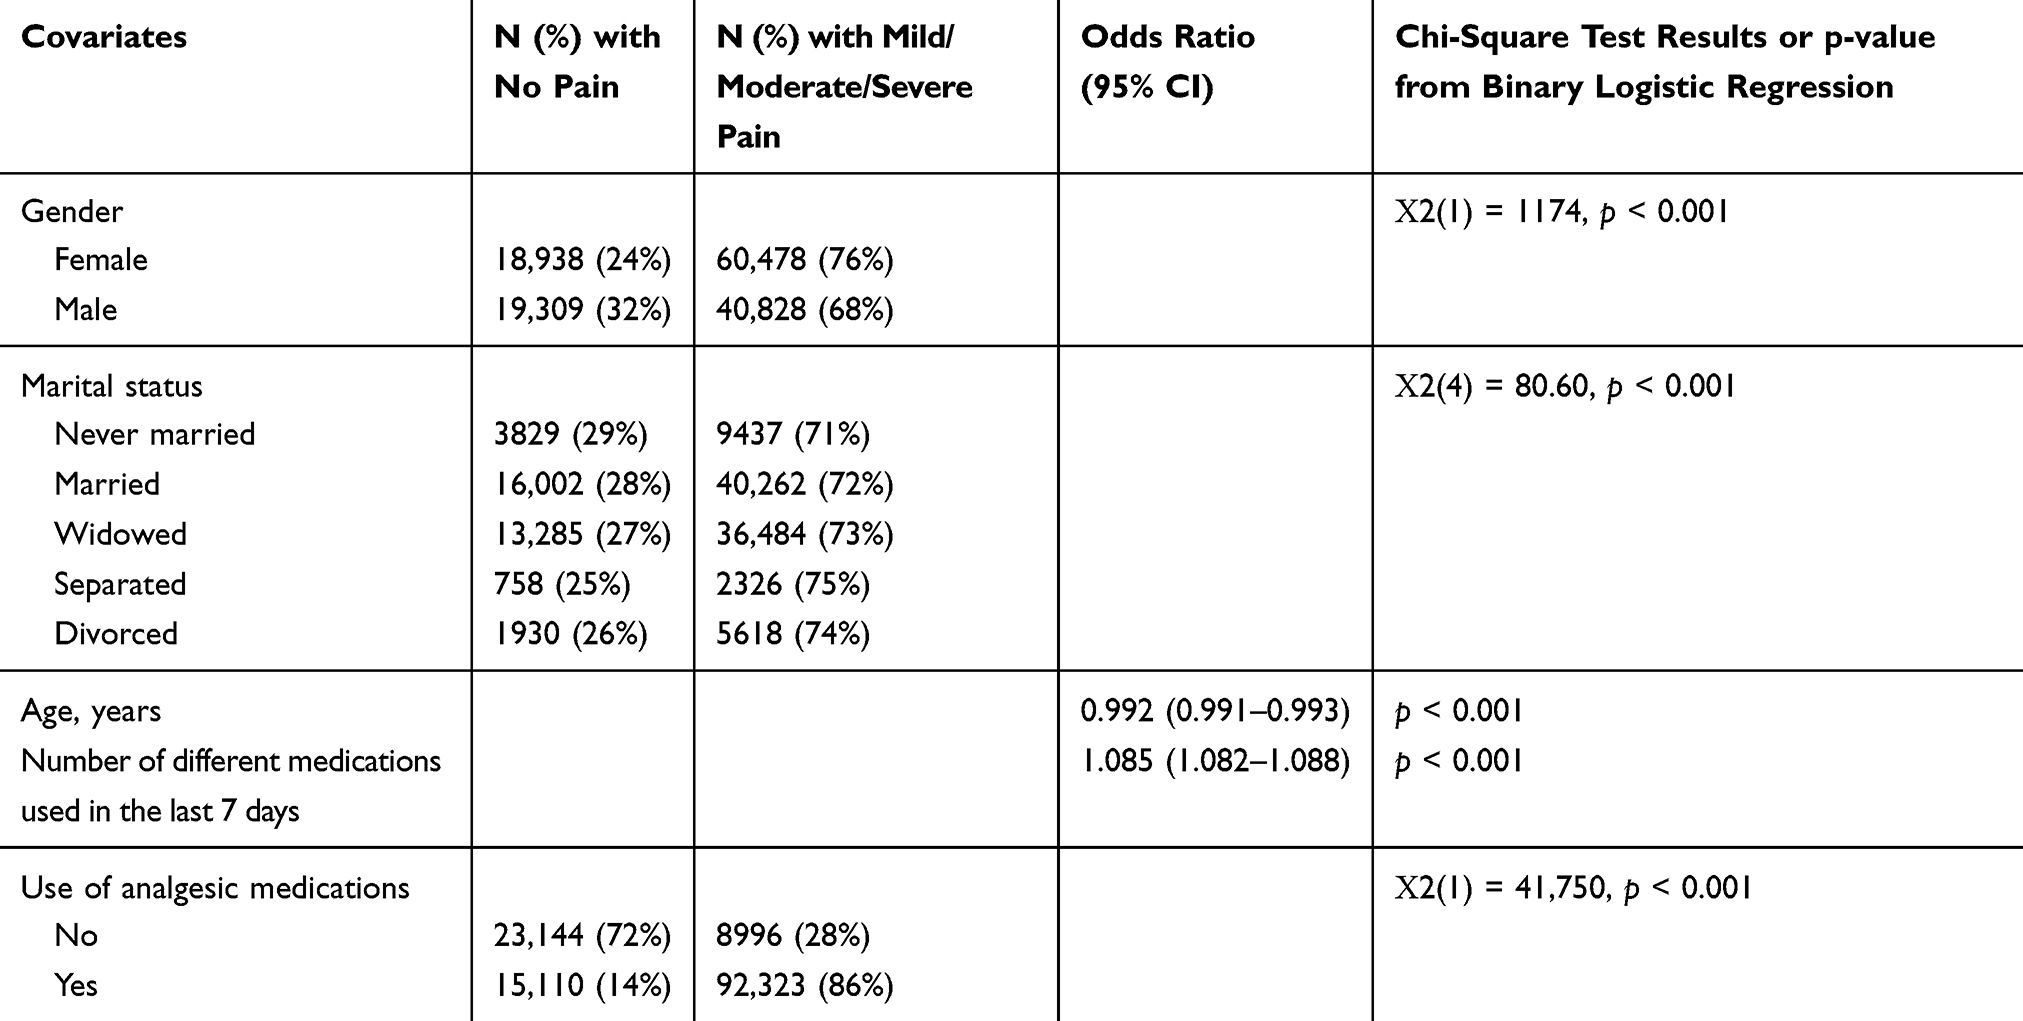 |
Table 5 Examining and Comparing Demographic and Medical Covariates, n = 139,573 (All Residents) |
Objective 2: Examine the Association Between Specific Disease Categories (1–9 Categories) and Pain Prevalence
Binary logistic regression models showed a significant association between most disease categories and the dichotomous P-Y/N pain variable, when controlling for demographic variables (sex, age, marital status) and medications (number of medications used in the last 7 days and use of analgesics). Pain was reported more often among residents with cancer (OR = 1.48; 95% CI: 1.43–1.53; p <0.001), musculoskeletal (OR = 1.32, 95% CI: 1.28–1.37; p <0.001), gastrointestinal diseases (OR = 1.11; 95% CI: 1.07–1.16; p <0.001) and psychiatric/mood (OR = 1.07; 95% CI: 1.03–1.11; p <0.001), compared to residents without those conditions. In contrast, residents with neurological or sensory conditions had significantly lower pain prevalence (OR = 0.67; 95% CI: 0.65–0.69; p <0.001; OR = 0.85; 95% CI: 0.81–0.88; p <0.001, respectively). Given the strong ORs for medication usage, we completed a third, post hoc model, in order to explore the association between specific disease categories and pain (P-Y/N) when excluding the use of medication (Table 6).
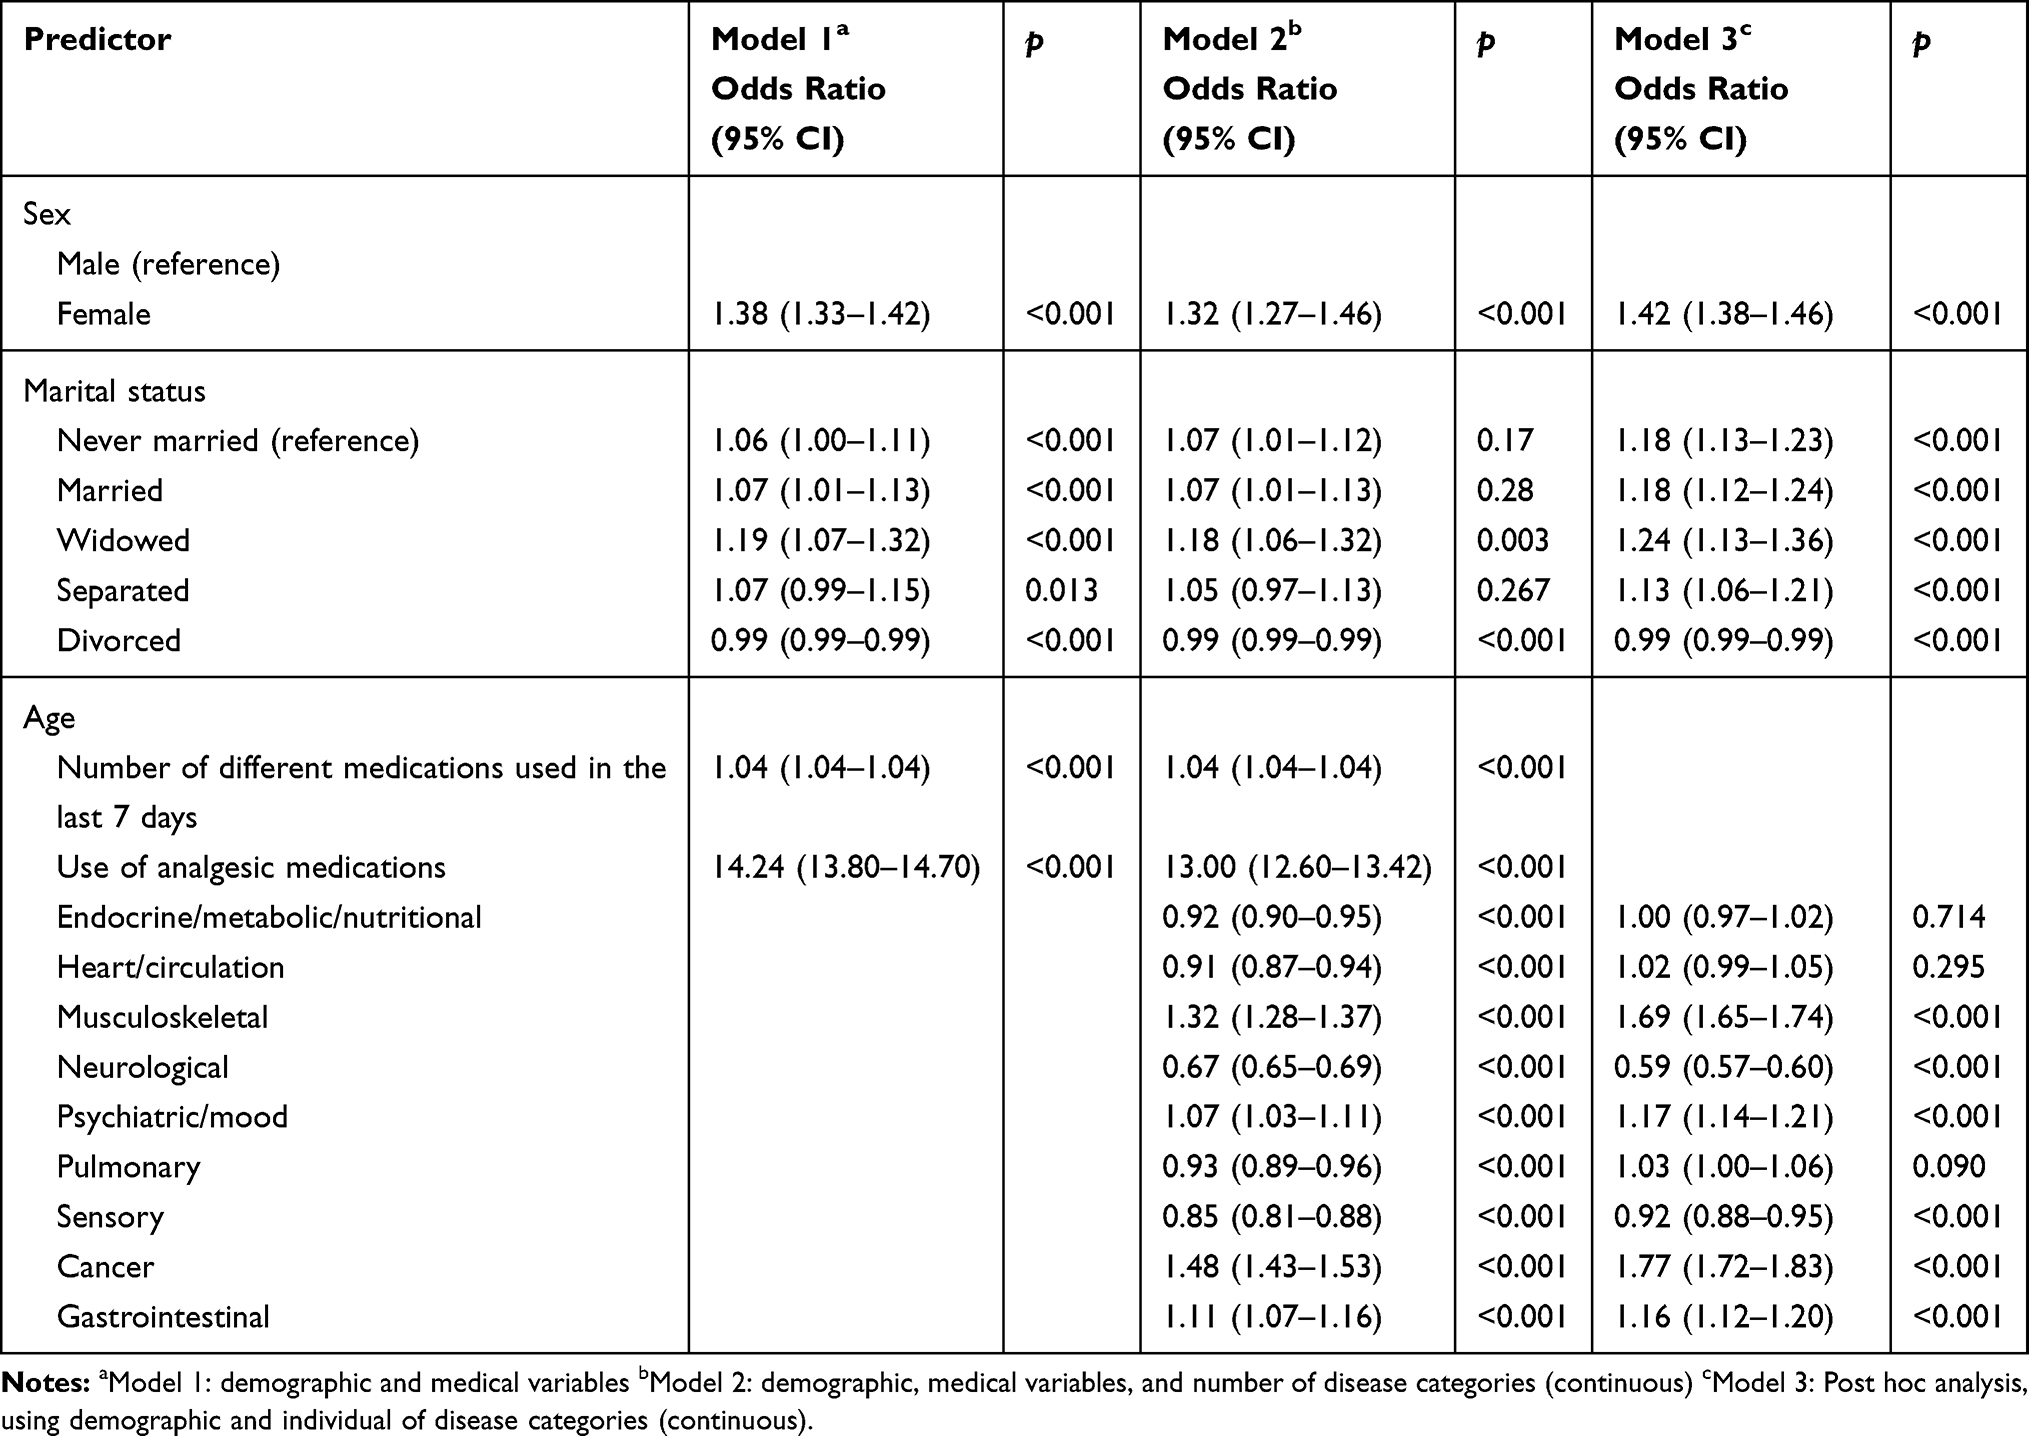 |
Table 6 Binary Logistic Regression with Pain (Yes/No) Being the Dependent Variable for Individual Disease Categories |
Objective 3: Examine the Association of the Number of Disease Categories with Pain Prevalence
We also examined the association between the number of disease categories (continuous, see Table 7, and categorical, see Table 8) and pain variables. Both the continuous and categorical disease category variables were assessed using binary regression, modelled in three blocks. Model 1 controlled for all demographics and medication usage, finding that female residents with multiple disease categories reported pain (P-Y/N) significantly more often than males (OR = 1.38, 95% CI: 1.33–1.42, p <0.001). Age was also significant. The use of analgesic medication was found to be significant, indicating that residents who report pain are 14 times more likely to be taking analgesics (OR = 14.24; 95% CI: 13.80–14.70, p <0.001).
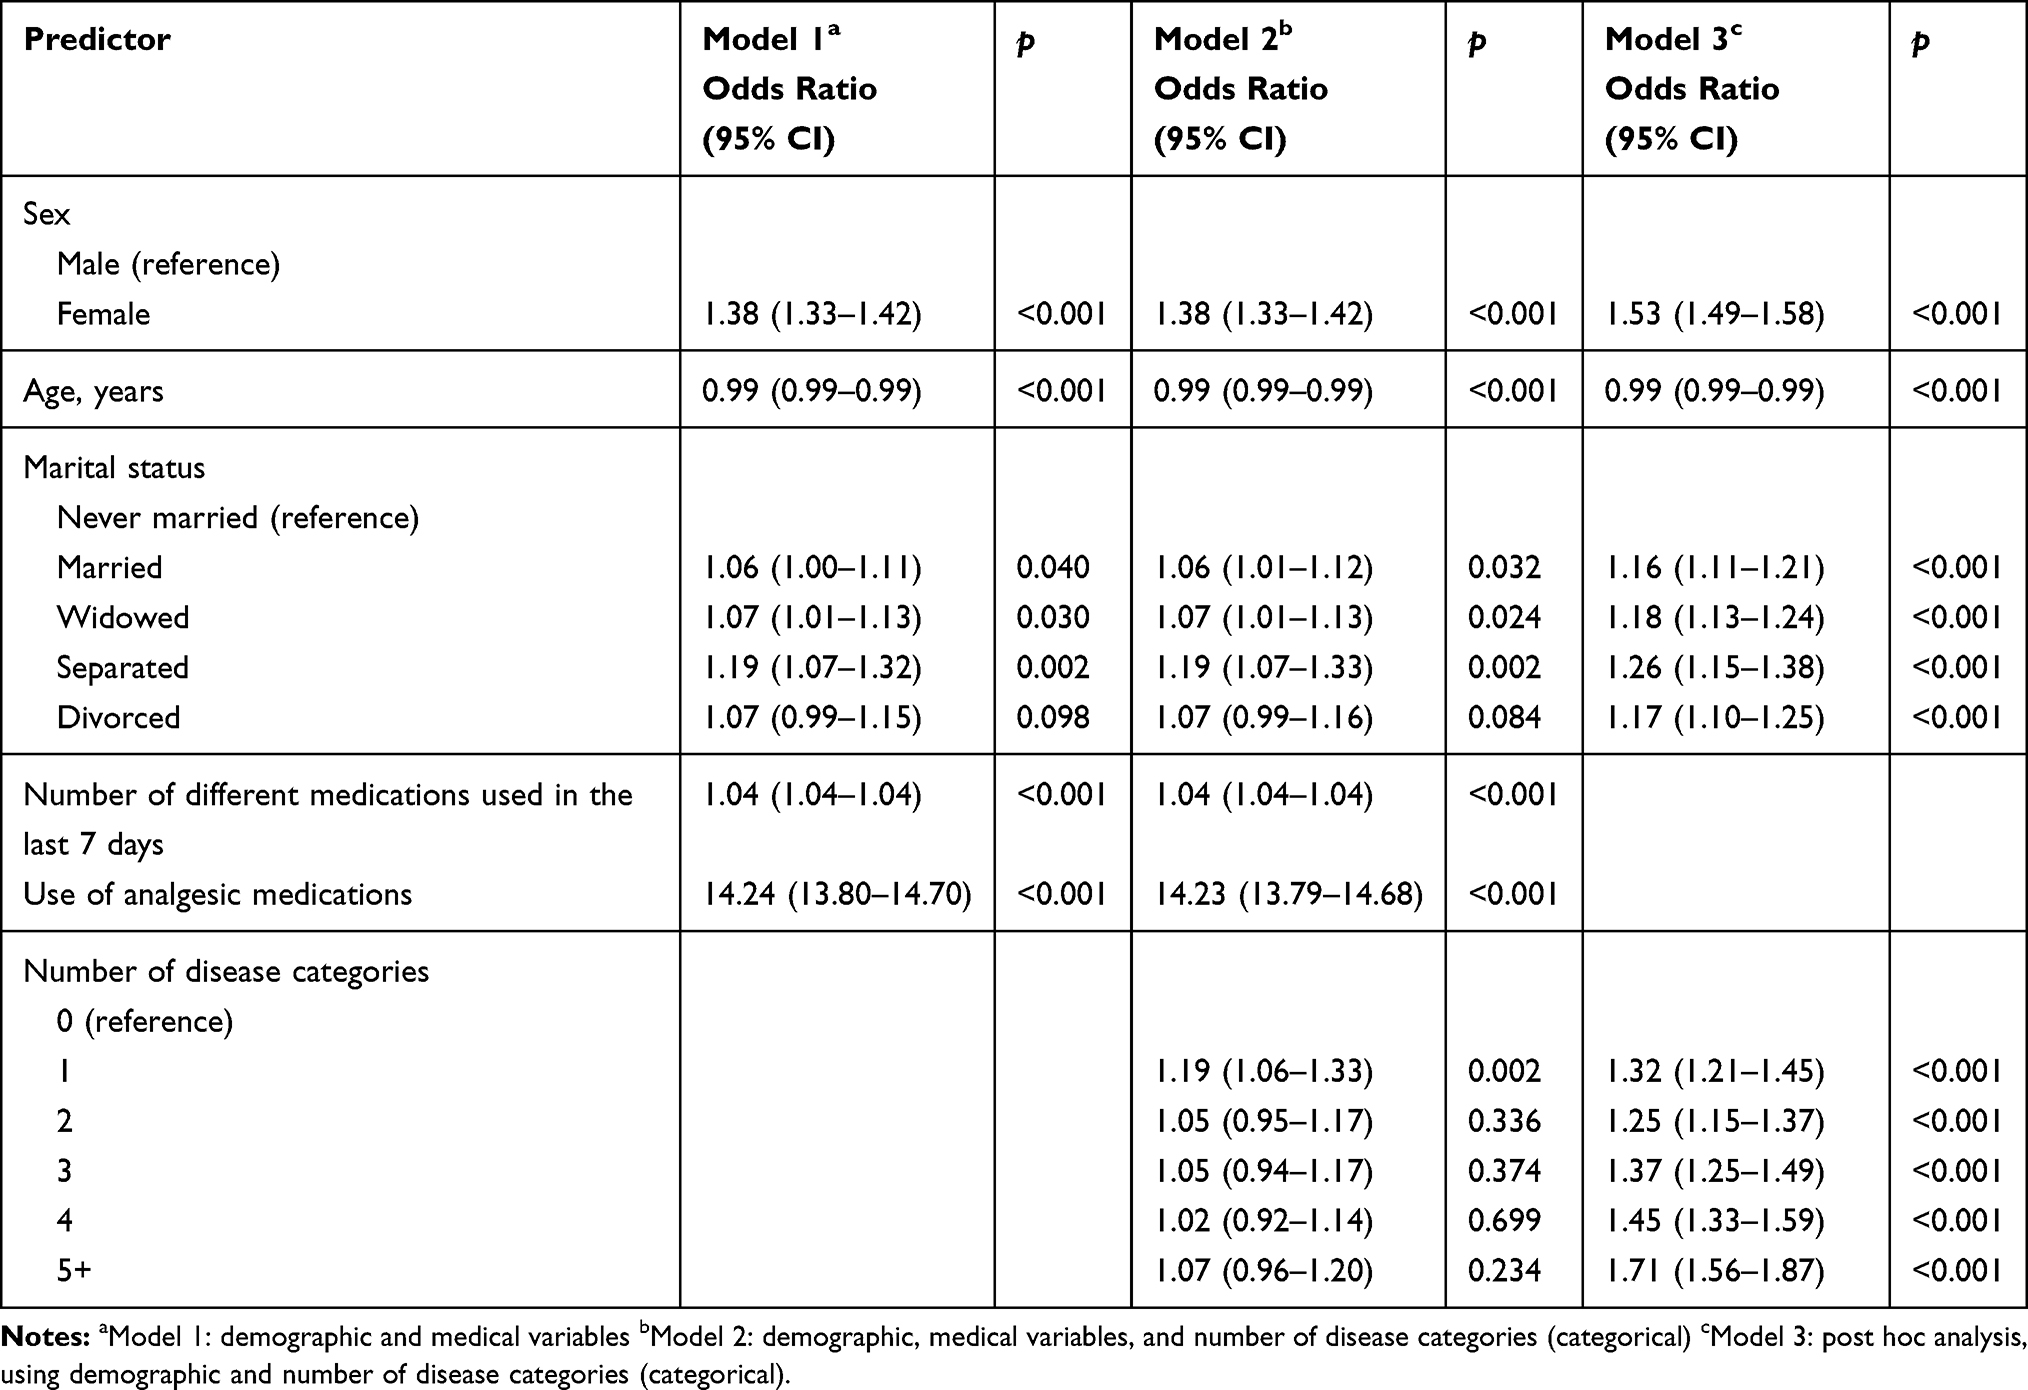 |
Table 7 Binary Logistic Regression with Pain (Yes/No) Being the Dependent Variable for Multimorbid Disease Categories (0–5+) |
 |
Table 8 The Top Five Combinations of One, Two, Three, Four and Five Disease Categories with Highest Proportion of Residents Within Each Disease Category or Combination Reporting Pain, Respectively |
In model 2, we additionally included the number of disease categories (for both continuous and categorical) and found a significant association between the number of disease categories and the P-Y/N variable (OR = 0.99, 95% CI: 0.98–1.00, p = 0.049). Sex, age and medication usage all remained significant. Given the finding that the use of medication and analgesics were found to have strong ORs, we ran a third model post hoc analysis and excluded the use of medications and analgesics.
The post hoc model 3 included demographic variables and number of disease categories only. Findings indicate that residents with multiple disease categories (continuous) were more likely to report the presence of pain (P-Y/N; OR = 1.08, 95% CI: 1.07–1.08, p < 0.001), with each additional disease category associated with an 8% increase in the odds of reporting pain, further suggesting the role of medication in managing pain. Categorically, the likelihood of reporting pain increased with multimorbidity, with five or more disease categories being the most highly associated with pain (OR = 1.71, 95% CI: 1.56–1.87, p <0.001). See Tables 7 and 9.
 |
Table 9 Binary Logistic Regression Using P-Y/N (Pain: Yes/No) as the Dependent Variable for the Number of Disease Categories |
Objective 4: Identify and Compare the Most Common Five Combinations of One, Two, Three, Four and Five Multimorbid Disease Categories and the Association with Pain Prevalence
The top five combinations of one, two, three, four and five disease categories with the highest proportion of patients reporting pain P-Y/N shown in Table 8. Of all the top combinations of diagnoses, the data shows clearly that the residents with a cancer diagnosis were found to have the highest pain prevalence (86%) followed by residents within the musculoskeletal diagnosis category (82%). The most common combination of two disease categories with reported pain was psychiatric/mood and cancer (Figure 1). The remaining three, four and five disease categories with residents reporting pain were as follows: musculoskeletal + pulmonary + cancer; musculoskeletal + psychiatric/mood + sensory + cancer; endocrine/metabolic/nutrition + musculoskeletal + psychiatric/mood + pulmonary + sensory. Chi-square tests to compare the proportion of residents endorsing the various levels of PI-4 pain for various disease categories, show statistically significant differences between 9 disease groups in terms of their distribution of 4-point pain levels, Χ2(24) = 1992, p < 0.001. The cancer group has the highest proportion of patients with severe (18%) and moderate (51%) pain levels. Musculoskeletal and gastrointestinal disease groups have the second largest proportion of moderate and severe pain (48% + 9% and 45% + 13%, respectively). The neurological group has the lowest proportion of severe (4%) and moderate (26%) pain patients (Figure 1).
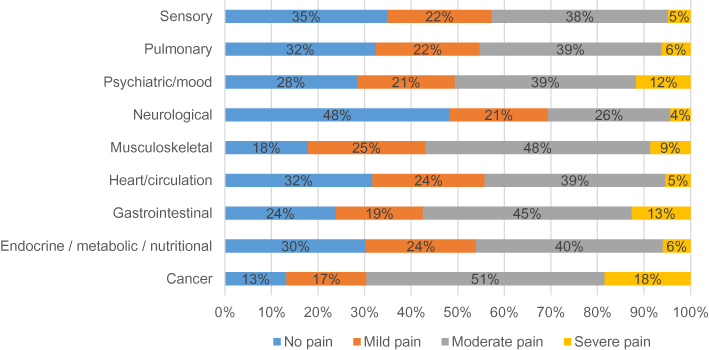 |
Figure 1 PI-4 pain severity ratings by individual single disease category. |
When evaluating pain using the more detailed PIPF-7 scale, the Chi-square test shows statistically significant differences between 9 disease groups in terms of distribution of 7-point pain levels, Χ2(48) = 2150, p < 0.001. Again, the cancer group still has the highest proportion of patients with pain level 4 (moderate pain daily; 37%) and level 5 (severe pain less than daily; 17%) (Figure 2).
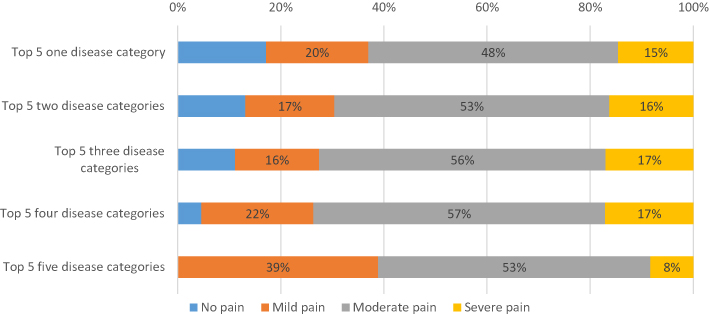 |
Figure 2 PI-4 pain severity ratings for the top five disease combinations with residents reporting pain. |
Discussion
We examined the prevalence of different multimorbidity combinations and the associated pain levels in a province-wide retrospective study of Ontario-based residents with complex chronic disease (CCD) (n=139,573). CCD involves multimorbidities (MM), in this study defined as 2 or more diseases in a single person. The prevalence of MM has been found to vary from 3.5% to 98.5%,29,30 depending on age, sex and setting, with higher prevalence among older populations and higher rates in women. Our findings indicated an average of 3.06 diseases per resident. With respect to overall pain findings, the presence of pain (ie, non-zero pain prevalence) was reported by 73% of the entire sample, and was significantly higher for females than males with a similar disease profile. Population-based studies indicate higher prevalence of general chronic pain among women, as well as several specific chronic pain conditions.31 These results are consistent with widely-reported sex differences in the clinical pain literature32–34 and the CCD literature.35,36 Age was also significantly associated with pain.
In examining the prevalence of disease categories, we found that heart/circulation diseases were the most prevalent among the sample (73%), with neurological second (46%) and musculoskeletal third (44%). Consistent with previous research on pain and MM (eg,15,35,37–39 our overall findings indicate that the greater the number of disease categories, the more likely the resident is to report the presence of pain). In fact, results showed that with each additional disease category, there was an 8% increase in the odds of residents reporting pain. Pain intensity also increased with multimorbidity of disease categories.
Although pain is common among multimorbid residents, little is known about the implications or role of pain and analgesic treatment on multimorbid residents.37 Our study initially controlled for the use of analgesic medication, as well as the number of other medications a patient was taking. We found that the use of medication, particularly analgesic medication, was the strongest factor associated with pain, with residents taking analgesic medication to be 14 times more likely to report pain. Given these findings, we subsequently conducted a post hoc analysis excluding the use of medication. When excluding medication usage, the number of disease categories was significantly associated with pain prevalence.
Residents with musculoskeletal, psychiatric, cancer and gastrointestinal diseases showed higher pain prevalence than those without these diseases. Residents with cancer were found to have the highest pain prevalence (87%), with musculoskeletal diseases next (82%). Individually and combined, both these disease categories are well documented in the published pain literature as diseases highly associated with pain.40–42
Multimorbidity of disease categories was also found to increase the prevalence and intensity of reported pain. As the number of MM conditions increase from one to five, the proportion of residents reporting mild pain decreases to zero among residents with 5 MM conditions. Several factors are known to contribute to pain intensity and frequency; most notably, depression and anxiety (see43 IsHak, Wen, Naghechi, Vanle, Dang, Knsop et al, 2018 for a recent review), musculoskeletal problems,40,44 and cardiovascular diseases;45 unfortunately, the interaction between chronic pain and CCD is not well understood. There is evidence, however, that management of CCD patients can become increasingly more challenging when patients also experience chronic pain, due to complications associated with medication dosing and interactions among multiple diseases. The interaction of various diseases and pain can also become complicated and difficult to decipher.46 The current study sought to further explore these associations and provide further information for research and patient care.
Limitations and Strengths
We examined multiple disease combinations by clustering and analyzing disease categories, while controlling for important demographic variables and medication usage. Despite this, residual confounding factors cannot be ruled out, particularly because we were unable to incorporate specific information about the disease profiles, such as disease progression, severity and treatment. Similarly, we were also unable to include information specific to pain factors, including pain site, cause and duration. Similar to other studies in pain research, pain was obtained by self-report. There also remains room for additional subjectivity among patient responses or clinician interpretation when completing surveys, such as the RAI/MDS/FA 2.0 utilized in this study. Similarly, surveys may not truly capture the level of morbidity in a population, as many symptoms, conditions or diseases a patient may have are not brought to the attention of the clinician completing the survey or the clinical records. This is an inherent limitation of using retrospective data, given our inability to determine whether pain was present before or after disease onset. Unfortunately, this restricts our ability to establish causal inferences about the relationship between multimorbidity and pain.
The benefits, however, of utilizing secondary, standardized, electronic sources of longitudinal data arguably outweigh the limitations; particularly in epidemiological research. Many of the challenges associated with primary data collection are avoided, including time and resources that are required to hire research personnel and recruit sufficient number of participants.47 A strength of our study is the large, province-wide sample of CCD residents in Ontario between the ages of 18 and 101 years, further contributing to the generalizability of the study. The large sample size also makes it possible to not only explore the impact of specific diseases, but also combinations of disease categories.
The data utilized is of high quality, given the use of standardized electronic records through the CIHI Facility-Based Continuing Care Reporting System, which captures information on residents admitted to publicly funded hospital facilities for complex chronic care in Canada. The RAI/MDS/FA 2.0 utilized in this validated tool, further contributing to the quality of the data.20 The primary argument for the use of binary logistic regression analyses to assess the associations between multimorbid disease categories and pain variables was to avoid confounding effects with ORs that are more directly comparable across the different diagnosis categories.
Implications
Individuals with CCD are both challenging and unique in that they require attention and assistance from multiple health and social service providers.7 This typically involves management of complex treatment regimens that include multiple appointments, numerous medications, regular monitoring and surveillance, and adherence to treatment recommendations and protocols.48,49 Pain is often associated with multiple medical conditions16 and can further add to the complexity of this population; yet, very little is known about multimorbid disease profiles and pain among this population.37
The findings from this study are a step toward identifying multimorbid disease categories that are related to pain experience in a CCD population and have several implications for research and health care. Within the research realm, information pertaining to the relationship between various multimorbid disease categories provides beneficial information to consider when understanding the patterns of multimorbidity and pain outcomes among a complex care population. The number and range of diseases experienced by CCD residents can make the assessment and management of this population rather complicated. A more detailed understanding of prominent disease patterns may be instrumental in alleviating some of the difficulties associated with this process. Given the complexity and continually changing health status of this population, additional information about disease patterns and outcomes is invaluable for organizing health care and creating care plans to meet the demands of an already challenging population. With information about the association between pain and multimorbidity, extra awareness can be given to the multimorbid diagnoses that may require further resources and attention. This may further assist with more specific and cost-effective treatment and intervention planning. Future research would be useful for more closely examining disease severity and progression as it related to the development from acute to chronic pain within the CCD population.
Acknowledgments
The present study was conducted in partial fulfillment of Meaghan Ferguson’s doctoral degree. Joel Katz is supported by the Canadian Institutes of Health Research Canada Research Chair in Health Psychology at York University.
Disclosure
Joel Katz reports being supported by a Canadian Institutes of Health Research Canada Research Chair in Health Psychology. The authors report no other potential conflicts of interest in this work.
References
1. Oeppen J, Vaupel JW. Broken Limits to Life Expectancy. American Association for the Advancement of Science; 2002.
2. Rijiken M, Van Kerkhof M, Dekker J, Schellevis FG. Comorbidity of chronic disease: effects of disease pairs on physical and mental functioning. Qual Life Res. 2005;14:45–55.
3. Bayliss EA, Bayliss MS, Ware JE, et al. Predicting declines in physical function in persons with multiple chronic medical conditions: what we can learn from the medical problem list. Health Qual Life Outcomes. 2004;2(1):47. doi:10.1186/1477-7525-2-47
4. Noël PH, Chris Frueh B, Larme AC, et al. Collaborative care needs and preferences of primary care patients with multimorbidity. Health Expect. 2005;8(1):54–63. doi:10.1111/j.1369-7625.2004.00312.x
5. Kuluski K, Bensimon CM, Alvaro C, et al. Life interrupted: the impact of complex chronic disease from the perspective of hospitalized patients. Illness Crisis Loss. 2014;22(2):127–144. doi:10.2190/IL.22.2.d
6. Fortin M, Bravo G, Hudon C, Lapointe L, Dubois MF, Almirall J. Psychological distress and multimorbidity in primary care. Ann Fam Med. 2006;4(5):417–422. doi:10.1370/afm.528
7. Kuluski K, Hoang SN, Schaink AK, et al. The care delivery experience of hospitalized patients with complex chronic disease. Health Expect. 2013;16(4):e111–23. doi:10.1111/hex.12085
8. Pefoyo AJK, Bronskill SE, Gruneir A, et al. The increasing burden and complexity of multimorbidity. BMC Public Health. 2015;15(1):415. doi:10.1186/s12889-015-1733-2
9. Piette JD, Kerr EA. The impact of comorbid chronic conditions on diabetes care. Diabetes Care. 2006;29(3):725–731. doi:10.2337/diacare.29.03.06.dc05-2078
10. Busse R, Blümel M. Tackling Chronic Disease in Europe: Strategies, Interventions and Challenges. WHO Regional Office Europe; 2010.
11. Hartmann J, Hehner S, Hemmrich K, Körs B, Möhlmann T. Providing better care at lower cost for multimorbid patients. Health Int. 2011;11:38–47.
12. Maaten S, Kephart G, Kirkland S, et al. Chronic disease risk factors associated with health service use in the elderly. BMC Health Serv Res. 2008;8(1):237. doi:10.1186/1472-6963-8-237
13. Salisbury C, Johnson L, Purdy S, et al. Epidemiology and impact of multimorbidity in primary care: a retrospective cohort study. Br J Gen Pract. 2011;61(582):e12–21. doi:10.3399/bjgp11X548929
14. Vogeli C, Shields AE, Lee TA, et al. Multiple chronic conditions: prevalence, health consequences, and implications for quality, care management, and costs. J Gen Intern Med. 2007;22(S3):391–395. doi:10.1007/s11606-007-0322-1
15. Scherer M, Hansen H, Gensichen J, et al. Association between multimorbidity patterns and chronic pain in elderly primary care patients: a cross-sectional observational study. BMC Fam Pract. 2016;17(1):68. doi:10.1186/s12875-016-0468-1
16. Wolff JL, Starfield B, Anderson G. Prevalence, expenditures, and complications of multiple chronic conditions in the elderly. Arch Intern Med. 2002;162(20):2269–2276. doi:10.1001/archinte.162.20.2269
17. Agborsangaya CB, Lau D, Lahtinen M, et al. Health-related quality of life and healthcare utilization in multimorbidity: results of a cross-sectional survey. Qual Life Res. 2013;22(4):791–799. doi:10.1007/s11136-012-0214-7
18. Mills S, Torrance N, Smith BH. Identification and management of chronic pain in primary care: a review. Curr Psychiatry Rep. 2016;18(2):22. doi:10.1007/s11920-015-0659-9
19. Campbell G, Darke S, Bruno R, et al. The prevalence and correlates of chronic pain and suicidality in a nationally representative sample. Aust N Z J Psychiatry. 2015;49(9):803–811. doi:10.1177/0004867415569795
20. Fries BE, Simon SE, Morris JN, et al. Pain in US nursing homes: validating a pain scale for the minimum data set. Gerontologist. 2001;41(2):173–179. doi:10.1093/geront/41.2.173
21. Hartmaier SL, Sloane PD, Guess HA, et al. Validation of the minimum data set cognitive performance scale: agreement with the mini-mental state examination. J Gerontol a Biol Sci Med Sci. 1995;50A(2):M128–33. doi:10.1093/gerona/50A.2.M128
22. Hawes C, Morris JN, Phillips CD, et al. Reliability estimates for the minimum data set for nursing home resident assessment and care screening (MDS). Gerontologist. 1995;35(2):172–178. doi:10.1093/geront/35.2.172
23. Mor V, Branco K, Fleishman J, et al. The structure of social engagement among nursing home residents. J Gerontol B Psychol Sci Soc Sci. 1995;50B(1):P1–P8. doi:10.1093/geronb/50B.1.P1
24. Snowden M, McCormick W, Russo J, et al. Validity and responsiveness of the minimum data set. J Am Geriatr Soc. 1999;47(8):1000–1004. doi:10.1111/j.1532-5415.1999.tb01297.x
25. Lawton MP, Casten R, Parmelee PA, et al. Psychometric characteristics of the minimum data set II: validity. J Am Geriatr Soc. 1998;46(6):736–744. doi:10.1111/j.1532-5415.1998.tb03809.x
26. Almirall J, Fortin M. The coexistence of terms to describe the presence of multiple concurrent diseases. J Comorbid. 2013;3(1):4–9. doi:10.15256/joc.2013.3.22
27. Stewart M, Fortin M, Britt HC, et al. Comparisons of multi-morbidity in family practice—issues and biases. Fam Pract. 2013;30(4):473–480. doi:10.1093/fampra/cmt012
28. Huntley AL, Johnson R, Purdy S, et al. Measures of multimorbidity and morbidity burden for use in primary care and community settings: a systematic review and guide. Ann Fam Med. 2012;10(2):134–141. doi:10.1370/afm.1363
29. Fortin M, Stewart M, Poitras M-E, et al. A systematic review of prevalence studies on multimorbidity: toward a more uniform methodology. Ann Fam Med. 2012;10(2):142–151. doi:10.1370/afm.1337
30. Violan C, Foguet-Boreu Q, Flores-Mateo G, et al. Prevalence, determinants and patterns of multimorbidity in primary care: a systematic review of observational studies. PLoS One. 2014;9(7):e102149. doi:10.1371/journal.pone.0102149
31. Fillingim RB. Sex, Gender, and Pain, in Principles of Gender-Specific Medicine. Elsevier; 2017:481–496.
32. Catuneanu A, Paylor JW, Winship I, et al. Sex differences in central nervous system plasticity and pain in experimental autoimmune encephalomyelitis. Pain. 2019;160(5):1037–1049. doi:10.1097/j.pain.0000000000001483
33. Mapplebeck JC, Beggs S, Salter MW. Sex differences in pain: a tale of two immune cells. Pain. 2016;157(Suppl 1):S2–6. doi:10.1097/j.pain.0000000000000389
34. Sorge RE, Totsch SK. Sex Differences in Pain. J Neurosci Res. 2017;95(6):1271–1281. doi:10.1002/jnr.23841
35. Marengoni A, Angleman S, Melis R, et al. Aging with multimorbidity: a systematic review of the literature. Ageing Res Rev. 2011;10(4):430–439. doi:10.1016/j.arr.2011.03.003
36. Melis R, Marengoni A, Angleman S, et al. Incidence and predictors of multimorbidity in the elderly: a population-based longitudinal study. PLoS One. 2014;9(7):e103120. doi:10.1371/journal.pone.0103120
37. Butchart A, Kerr EA, Heisler M, et al. Experience and management of chronic pain among patients with other complex chronic conditions. Clin J Pain. 2009;25(4):293. doi:10.1097/AJP.0b013e31818bf574
38. Gijsen R, Hoeymans N, Schellevis FG, et al. Causes and consequences of comorbidity: a review. J Clin Epidemiol. 2001;54(7):661–674. doi:10.1016/S0895-4356(00)00363-2
39. Sharpe L, McDonald S, Correia H, et al. Pain severity predicts depressive symptoms over and above individual illnesses and multimorbidity in older adults. BMC Psychiatr. 2017;17(1):166. doi:10.1186/s12888-017-1334-y
40. Blyth FM, Noguchi N. Chronic musculoskeletal pain and its impact on older people. Best Pract Res Clin Rheumatol. 2017;31(2):160–168. doi:10.1016/j.berh.2017.10.004
41. Murray CJ, Barber RM, Foreman KJ, et al. Global, regional, and national disability-adjusted life years (DALYs) for 306 diseases and injuries and healthy life expectancy (HALE) for 188 countries, 1990–2013: quantifying the epidemiological transition. Lancet. 2015;386(10009):2145–2191.
42. van den Beuken-van MH, Hochstenbach LMJ, Joosten EAJ, et al. Update on prevalence of pain in patients with cancer: systematic review and meta-analysis. J Pain Symptom Manage. 2016;51(6):1070–1090. e9. doi:10.1016/j.jpainsymman.2015.12.340
43. IsHak WW, Wen RY, Naghdechi L, et al. Pain and depression: a systematic review. Harv Rev Psychiatry. 2018;26(6):352–363. doi:10.1097/HRP.0000000000000198
44. Blyth FM, Briggs AM, Schneider CH, et al. The global burden of musculoskeletal pain—where to from here? Am J Public Health. 2019;109(1):35–40. doi:10.2105/AJPH.2018.304747
45. Fayaz A, Ayis S, Panesar SS, et al. Assessing the relationship between chronic pain and cardiovascular disease: a systematic review and meta-analysis. Scand J Pain. 2016;13:76–90. doi:10.1016/j.sjpain.2016.06.005
46. Gloth Iii FM. Pharmacological management of persistent pain in older persons: focus on opioids and nonopioids. J Pain. 2011;12(3):S14–S20. doi:10.1016/j.jpain.2010.11.006
47. Belletti D, Zacker C, Mullins CD. Perspectives on electronic medical records adoption: electronic medical records (EMR) in outcomes research. Patient Relat Outcome Meas. 2010;1:29. doi:10.2147/PROM.S8896
48. Mercer S, Salisbury C, Fortin M. ABC of Multimorbidity. John Wiley & Sons; 2014.
49. Onder G, Palmer K, Navickas R, et al. Time to face the challenge of multimorbidity. A European perspective from the joint action on chronic diseases and promoting healthy ageing across the life cycle (JA-CHRODIS). Eur J Intern Med. 2015;26(3):157–159. doi:10.1016/j.ejim.2015.02.020
 © 2020 The Author(s). This work is published and licensed by Dove Medical Press Limited. The
full terms of this license are available at https://www.dovepress.com/terms
and incorporate the Creative Commons Attribution
- Non Commercial (unported, 3.0) License.
By accessing the work you hereby accept the Terms. Non-commercial uses of the work are permitted
without any further permission from Dove Medical Press Limited, provided the work is properly
attributed. For permission for commercial use of this work, please see paragraphs 4.2 and 5 of our Terms.
© 2020 The Author(s). This work is published and licensed by Dove Medical Press Limited. The
full terms of this license are available at https://www.dovepress.com/terms
and incorporate the Creative Commons Attribution
- Non Commercial (unported, 3.0) License.
By accessing the work you hereby accept the Terms. Non-commercial uses of the work are permitted
without any further permission from Dove Medical Press Limited, provided the work is properly
attributed. For permission for commercial use of this work, please see paragraphs 4.2 and 5 of our Terms.