Back to Journals » International Journal of General Medicine » Volume 14
Association Between Left Atrial Volume Index and Ventricular Repolarization Heterogeneity: A Cross-Sectional Study of a Healthy Chinese Population
Authors Li Z, Bai X, Han L, Han W, Hu W
Received 10 March 2021
Accepted for publication 30 April 2021
Published 27 May 2021 Volume 2021:14 Pages 2117—2125
DOI https://doi.org/10.2147/IJGM.S310220
Checked for plagiarism Yes
Review by Single anonymous peer review
Peer reviewer comments 2
Editor who approved publication: Dr Scott Fraser
Zhidan Li,1 Xiaojuan Bai,2 Lulu Han,2 Wen Han,2 Weina Hu3
1Department of Ultrasound, The Fourth Affiliated Hospital of China Medical University, Shenyang, People’s Republic of China; 2Department of Gerontology and Geriatrics, Shengjing Hospital of China Medical University, Shenyang, People’s Republic of China; 3Department of Cardiology, The Fourth Affiliated Hospital of China Medical University, Shenyang, People’s Republic of China
Correspondence: Weina Hu
Department of Cardiology, The Fourth Affiliated Hospital of China Medical University, Shenyang, 110032, People’s Republic of China
Email [email protected]
Xiaojuan Bai
Department of Gerontology and Geriatrics, Shengjing Hospital of China Medical University, Shenyang, 110004, People’s Republic of China
Email [email protected]
Background: Electromechanical coupling may play a significant role in the association between abnormal myocardial mechanics and heterogeneity of repolarization. This study sought to assess the potential relationship between the left atrial volume index (LAVI), which is an important marker of cardiac diastolic function, and ventricular repolarization variables, such as the QT interval, Tpeak-to-Tend (Tpe) interval and Tpe/QT ratio, in an apparently healthy Chinese population.
Methods: This was a community-based cross-sectional study conducted in Shenyang, China. A total of 414 healthy subjects aged 35– 91 years, including 186 men (44.9%), were enrolled. In addition to performing clinical and laboratory measurements, all subjects underwent comprehensive echocardiography and standard 12-lead electrocardiography. Echocardiographic and electrocardiographic results were analysed separately and in a blinded fashion. Correlation and regression analyses were applied to determine associations.
Results: Subjects were divided into four groups according to quartile of LAVI levels (< 16.0, 16.0– 18.9, 19.0– 22.5 and > 22.5 mL/m2). Ventricular repolarization variables, such as QT interval and QTc interval, gradually increased with the progression from low to high LAVI levels (P< 0.05). LAVI was positively and significantly correlated with the QT interval, the QTc interval, and the Tpe interval (P< 0.01). After adjusting for age and other possible confounders, LAVI showed significant and independent associations with the QT interval and the QTc interval (P< 0.001; P=0.003).
Conclusion: Echocardiographic LAVI is linearly associated with ventricular repolarization variables even in healthy people.
Keywords: left atrial volume index, QT interval, Tpe interval, diastolic dysfunction, ventricular repolarization
Introduction
Left ventricular (LV) diastolic dysfunction (LVDD) is highly prevalent worldwide, and the prevalence of asymptomatic LVDD is increasing annually.1 The latency between dysfunction and symptoms may be the best time to use effective diagnosis and treatment.2 Therefore, the importance of accurate evaluation of LVDD is increasing in clinical practice.
The maximum left atrium volume (LAV) has recently emerged as an important marker of LVDD.3 LAV is adjusted to body surface area and expressed as the left atrial volume index (LAVI). The advantages of using LAVI to evaluate LVDD are its feasibility and reproducibility.4 LAVI is currently considered superior to other echocardiographic markers of LVDD and is being increasingly used in large clinical studies.5,6 Importantly, increased LAVI is considered an independent predictor of death, heart failure, atrial fibrillation (AF), and ischaemic stroke.6
Growing studies have reported that ventricular repolarization abnormalities are associated with LVDD, suggesting that electromechanical coupling may play a significant role in the relationship between abnormal cardiac diastolic function and heterogeneity of repolarization.7–9 However, few studies have explored the relationship between LAVI and ventricular repolarization heterogeneity. Therefore, the relationship between these factors needs to be more extensively studied.
Thus, the aim of this study was to assess the potential relationship between echocardiographic LAVI and electrocardiographic (ECG) ventricular repolarization variables, such as the QT interval, Tpeak-to-Tend (Tpe) interval, and Tpe/QT ratio, in an apparently healthy Chinese population.
Materials and Methods
Study Subjects
Subjects of the present community-based cross-sectional study were selected from a healthy Han Chinese population. Recruitment notices were posted in 15 community centres that were randomly selected in Shenyang in 2007. The criteria to register for the study were as follows: 1) being over 35 years old; 2) no self-reported history of disease (heart, brain, lung, kidney, liver disease, hypertension, diabetes, hyperthyroidism, tumor, rheumatoid disease, and chronic infection); 3) the ability to take care of oneself and to engage in daily life activities independently and without difficulty; and 4) the ability to provide informed consent and self-reported data. All subjects who met the register criteria were appointed and directed to the Geriatrics Laboratory of China Medical University. The selection process used for healthy subjects is shown in Figure 1. A total of 1500 participants were randomly selected between September 2007 and June 2008. There were 831 participants excluded from the study because they had conditions of the nervous system, respiratory system, endocrine system, gastrointestinal system, circulatory system, haematological system, immune system or urinary system or rheumatic disease, chronic infections or tumours. The remaining 669 healthy subjects who signed the informed consent form underwent the following blood biochemical examinations: triglycerides (TG), total cholesterol (TC), high-density lipoprotein cholesterol (HDL-C), low-density lipoprotein (LDL-C), fasting blood glucose (FBG), and serum creatinine (SCr) levels. Echocardiography and electrocardiography were also performed. After reviewing the examination results, an additional 255 subjects (156 subjects with abnormal blood biochemical values, 91 subjects with major ECG abnormalities, and 8 subjects with major Echocardiography abnormalities) were excluded. Finally, a total of 414 healthy subjects were selected for this study.
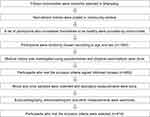 |
Figure 1 Selection process of healthy subjects. |
This study was approved by the Ethics Committee of China Medical University, and it was verified that all participants signed an informed consent form.
Echocardiography
All subjects underwent complete M-mode, two-dimensional, and pulsed-wave Doppler echocardiography using the Philips iE33 Ultrasound System, and all echocardiographic measurements were performed according to published guidelines.4,10 Pulsed-wave Doppler was performed in a four-chamber apical view to obtain data pertaining to mitral inflow velocities and time intervals. The main measurements included mitral early diastolic inflow velocity (E), late diastolic inflow velocity (A), the E/A ratio, and E-wave deceleration time (DT). We measured the left atrial anterior-posterior diameter (LA-AP-D), left atrial medial-lateral diameter (LA-ML-D), and left atrial superior-inferior diameter (LA-SI-D) using a four-compartment apical view. The left atrial volume (LAV) was computed by the equation 4π/3(LA-SI-D/2)(LA-AP-D/2)(LA-ML-D/2) according to the ellipsoid model. The left atrial volume index (LAVI) was calculated as the LAV in millilitres divided by the body surface area (BSA) in metres squared.
Electrocardiography
All subjects underwent a 12-lead ECG recorded using a standard ECG system at a paper speed of 25 mm/s and a voltage of 10 mm/mV. We excluded participants with some major ECG abnormalities (atrial arrhythmias, bundle branch blocks, second and third degree atrioventricular block, multiple premature complexes, and paced rhythms) due to their influence on dispersion of repolarization as well as difficulty measuring QT and Tpe intervals in these cases. For the ECG analysis, we used a computer programme (Digimizer 4.5.1) to measure the following values manually with a digital calliper. The QT interval was measured from the beginning of the QRS wave to the end of the T wave, and the Tpe interval was measured from the peak of the T wave to the end of the T wave. The QT interval and the Tpe interval were corrected according to heart rate by the Bazett formula.11 We also calculated the Tpe/QT and Tpe/QTc ratios. All measurements were performed in lead V5.12 Leads V4 and V6 (in that order) were utilized in cases where lead V5 was not available for analysis. ECG measurements were performed by a single trained reader who was unaware of the echocardiographic results.
Clinical Measurements and Laboratory Tests
All participants underwent a clinical examination and completed a detailed questionnaire upon enrolment. Subjects rested in a temperature-controlled environment for 10–15 minutes prior to examination. Physical parameters, including height and weight, were measured using a digital scale. Blood pressure was measured using a manual stethoscope and a sphygmomanometer with an adjustable cuff. Two measurements were made at an interval of 2 minutes, and the average of the two measurements was calculated. Hypertension was defined as systolic blood (SBP) ≥140 mmHg or diastolic blood pressure (DBP) ≥90 mmHg. Body mass index (BMI) was calculated as the mass in kilograms divided by height in metres squared, and body surface area (BSA) was calculated according to the following formula: BSA (m2) = 0.0061 × height (cm) + 0.0128 × weight (kg) - 0.1529.
Blood samples were collected between 8:00 and 9:00 am after the subjects had fasted for at least 10 hours overnight. Blood biochemical parameters, including TG, TC, HDL-C, LDL-C, FBG and SCr levels, were assayed (ARCHITECT cil 6200 Integrated system) on-site at the medical laboratory of the study centre.
Statistical Analysis
Data analysis was performed using SPSS 19.0. Normally distributed and continuous variables are expressed as the mean ± SD, and categorical variables are expressed as n (%). Subjects were categorized into quartiles of LAVI levels, and the differences in these variables by quartile of LAVI were examined using one-way analysis of variance (ANOVA). A Bonferroni analysis or Games–Howell analysis was used for further comparisons between pairs of groups. Data that accorded with homogeneity of variance were compared by a Bonferroni analysis or by Games–Howell analysis. Simple correlation analyses were performed by calculating Pearson’s coefficients for the relationships between two variables. Multiple linear regression analyses were performed to adjust for possible confounding variables. The following two models were used: a model adjusted only for age and a model adjusted for age, BMI, SBP, DBP, TGs, TC, HDL-C, LDL-C, FBG, and SCr. P < 0.05 was considered significant.
Results
A total of 414 subjects, including 186 men (44.9%) and 228 women (55.1%), were assessed in this study. The mean age of the subjects was 59.2 ± 14.2 years old. The clinical characteristics of the study population and the obtained echocardiographic and ECG variables are included in Table 1.
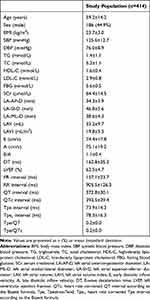 |
Table 1 Characteristics of the Study Population |
Overall Variables Based on Quartiles of LAVI Levels
The subject variables are shown by quartile of LAVI level in Table 2. Subjects were divided into four groups according to their LAVI levels (<16.0, 16.0–18.9, 19.0–22.5 and >22.5 mL/m2). The following clinical variables gradually increased with the progression from low to high LAVI levels (P <0.05): age, BMI, SBP, DBP, and TC. All echocardiographic variables except E and left ventricular ejection fraction (LVEF) were significantly different among the four groups (P <0.05). Furthermore, the following ECG variables were significantly different among the four groups (P <0.05): the PR, RR, QT and QTc intervals.
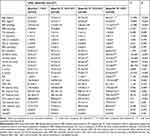 |
Table 2 Overall Variables of the Subjects Based on Quartiles of LAVI |
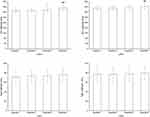
Figure 2 shows the mean values of the QT interval, QTc interval, Tpe interval, and Tpec interval with different LAVI quartile levels. The QT interval and QTc interval significantly increased with the progression from low to high LAVI levels (P <0.001).
Correlation Analysis Between LAVI and Other Variables
Table 3 shows the correlation coefficients for the relationships between LAVI and other variables. With regard to clinical and laboratory variables, LAVI was positively and significantly correlated with age (r=0.313, P<0.001), BMI (r=0.231, P<0.001), SBP (r=0.315, P<0.001), DBP (r=0.152, P=0.002) and LDL-C (r=0.105, P=0.033). Furthermore, LAVI was positively and significantly correlated with repolarization variables, such as the QT interval (r=0.354, P<0.001), QTc interval (r=0.255, P<0.001), and Tpe interval (r=0.148, P=0.003).
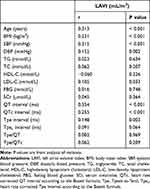 |
Table 3 Correlation Analysis Between LAVI and Other Variables |
Associations Between LAVI and Repolarization Variables
Table 4 shows the results of multiple linear regression analyses in which ECG repolarization variables served as the dependent variables and LAVI served as the independent variable. After adjusting for age and other possible confounders, LAVI showed significant and independent associations with the QT interval (P<0.001) and the QTc interval (P=0.003). However, after adjusting for all possible confounders, the significant association between LAVI and the Tpe interval was lost (P=0.081).
 |
Table 4 Relationship Between LAVI and Repolarization Variables Using a Stepwise Multiple Regression Model |
Discussion
In the present study, we investigated the relationship between echocardiographic LAVI and ventricular repolarization variables in a healthy adult population. We found a linear correlation between LAVI and ECG QT/QTc intervals, which are important ventricular repolarization variables. This finding is important because it supports the hypothesis that electromechanical coupling may represent a relationship between abnormal cardiac mechanics and repolarization heterogeneity.
Over the past 20 years, echocardiography has played a central role in the evaluation of LVDD. Increased LA size is associated with increased left ventricular filling pressure and LVDD.3 Since LA enlargement is not uniform, biplanar LAV is more accurate than previous descriptions of LA size (LA diameter and area) using either the total disc method or the area-length method. Moreover, LAV and LAVI are more reliable predictors of cardiovascular events.5,13 Feasibility and reproducibility are advantages of using LAV and LAVI to assess LVDD; therefore, LAV and LAVI have been suggested as good markers of LVDD. In a cross-sectional population-based study, the LAVI increased with worsening LVDD.14 However, when controlling for LVDD, LAVI was not an independent predictor of mortality.14 On the other hand, LAVI is considered a predictor of cardiovascular events, such as congestive heart failure and AF, in large clinical trials.15–17 Numerous studies have confirmed the relationship between increased LAVI and the development of adverse cardiovascular outcomes, such as heart failure, AF, and ischaemic stroke.6 A meta-analysis including 21 studies (3822 subjects with AF) showed that patients with recurrence following radiofrequency catheter ablation had a higher LAVI than those with no recurrence.17 Recently, an increased LAVI has been identified as an independent predictor of outcome in patients with acute coronary syndrome.18 In our study, we found that the Mitral A velocity gradually increased with the progression from low to high LAVI levels, whereas the E/A ratio gradually decreased. Both Mitral A velocity and E/A ratio are traditional echocardiographic markers of LVDD.
The ECG QT interval is one of the most important and common ventricular repolarization variables in clinical practice. The QT interval corrected for heart rate (QTc) has been established as a predictor of cardiac morbidity and mortality.19 Moreover, growing evidence has demonstrated that ventricular repolarization abnormalities are associated with LVDD. The study by Wilcox et al demonstrated that prolonged QTc was independently related to reduced E’ velocity in patients referred for clinical suspicion of heart failure.7 Another previous study of patients also found a modest relationship between the E/A ratio and the QTc interval in patients with hypertension and LV hypertrophy.20 One study of patients with diabetes mellitus showed that the QTc interval was significantly higher in the diabetic group with a subclinical LVDD interval than in the control group.21 These results support the conclusion that a prolonged QTc interval is associated with echocardiographic parameters representing LVDD in patients with cardiovascular diseases. In the present study, we used LAVI as the echocardiographic marker of LVDD instead of traditional Doppler markers. Moreover, the subjects selected in the present study were apparently healthy. It is well known that diseases affecting cardiac structure and function, such as heart failure, hypertension, and diabetes, are powerful potential confounders for electromechanical coupling measurements. We found an independent linear relationship between LAVI and the QT/QTc intervals after adjusting for other potential confounders. To our knowledge, this is the first reported association between LAVI and QT/QTc interval levels in a community-based healthy population.
Interestingly, QTc interval prolongation is associated with an increased risk of AF and stroke.22,23 As we have discussed earlier, LAVI is also an independent predictor of AF and stroke. There may be some common mechanisms for these associations. Ordög et al studied the mRNA expression of several representative groups of cardiac ion channels in the hearts of healthy people and found that some important channels involved in cardiac repolarization are commonly located between atrial and ventricular tissues.24 Clearly, repolarization disorder is not confined to the ventricular myocardium, as it also affects the atrial myocardium. On the other hand, since the left atrium is directly affected by increased left ventricular pressure, LVDD is likely to lead to increased wall tension in the atrial wall, producing a vulnerable substrate for AF.25 In the present study, we observed a relationship between LAVI and ventricular repolarization variables, and the potential mechanisms underlying this relationship need further investigation.
The ECG Tpe interval is another important indicator to measure ventricular repolarization heterogeneity. The Tpe interval is the interval between the peak and end of the T wave, and it is generally viewed as a reflection of transmural cardiac repolarization.26 Recent studies have shown that the Tpe interval is an important ECG biomarker in predicting the risk of arrhythmias and sudden death.27–29 In addition, several studies have suggested that prolongation of the Tpe interval is a potential mechanism leading to diastolic dysfunction in patients with overt or suspected heart failure.9,30 Sauer et al found that in 107 consecutive unselected patients, an increased Tpe interval was inversely associated with reduced tissue Doppler e’ velocity, which was a marker of LVDD.30 Additionally, another study showed a linear relationship between the Tpe interval and the standard deviation of time to peak radial strain, a measurement of heterogeneity in contraction.9 In the present study, we found a positive association between echocardiographic LAVI and the Tpe interval. After adjustment for several important potential confounders, we failed to find a significant association between echocardiographic LAVI and Tpe interval. However, P value approached statistical significant (P=0.081). Considering the low number of subjects (n=414) in the present study, the results need to be confirmed in larger groups.
The Tpe/QT ratio is a novel ventricular repolarization variable that can be used as an ECG index of ventricular arrhythmogenesis.31,32 However, there is little evidence of a relationship between the Tpe/QT ratio and LVDD. Only one study found a significant positive correlation between the Tpe/QTc ratio and echocardiographic E/e’ ratio in Fabry patients.33 In our study, we failed to find a significant association between echocardiographic LAVI and the Tpe/QT ratio. Further investigations are necessary to confirm and to improve the present findings.
This study had some limitations that need to be discussed. First, since this study was limited to being a cross-sectional study, it is difficult to prove a causal relationship between LAVI and ventricular repolarization heterogeneity. A longitudinally designed study is strongly recommended to confirm the present findings. Second, the number of subjects included in the study was relatively small, with a lower proportion of men (44.9%) than women (55.1%). Third, several important parameters, such as serum sodium, potassium, and magnesium, directly affect the QT interval. However, these valuable variables could not be evaluated because of measurement limitations. Fourth, in the present study, we chose to use the QT and Tpe intervals corrected for heart rate (QTc and Tpec) using the Bazett formula. However, normal values are not the same for the individual sexes. Furthermore, its accuracy at fast and slow heart rates has been challenged. However, to the best of our knowledge, the Bazett formula is still the most frequently used formula in research or clinical practice.34 The results of this study raised some questions that require further investigation.
Conclusion
This study shows that echocardiography LAVI is linearly associated with ventricular repolarization variables, even in healthy populations. Electromechanical coupling may represent the relationship between abnormal cardiac mechanics and repolarization heterogeneity. The findings of the current study need to be further evaluated with long-term follow-up and large prospective studies.
Ethics Approval and Consent to Participate
I confirm that I have read the Editorial Policy pages. This study was approved by the Ethics Committee of China Medical University. This study was conducted in accordance with the declaration of Helsinki. Written informed consent was obtained from all participants.
Disclosure
The authors report no conflicts of interest in this work.
References
1. Jeong EM, Dudley SC
2. Halley CM, Houghtaling PL, Khalil MK, Thomas JD, Jaber WA. Mortality rate in patients with diastolic dysfunction and normal systolic function. Arch Intern Med. 2011;171(12):1082–1087. doi:10.1001/archinternmed.2011.244
3. Thomas L, Marwick TH, Popescu BA, Donal E, Badano LP. Left atrial structure and function, and left ventricular diastolic dysfunction: JACC state-of-the-art review. J Am Coll Cardiol. 2019;73(15):1961–1977. doi:10.1016/j.jacc.2019.01.059
4. Nagueh SF, Smiseth OA, Appleton CP, et al. Recommendations for the evaluation of left ventricular diastolic function by echocardiography: an update from the American Society of Echocardiography and the European Association of Cardiovascular Imaging. J Am Soc Echocardiogr. 2016;29(4):277–314.
5. Tsang T, Abhayaratna W, Barnes M, et al. Prediction of cardiovascular outcomes with left atrial size: is volume superior to area or diameter? J Am Coll Cardiol. 2006;47(5):1018–1023. doi:10.1016/j.jacc.2005.08.077
6. Abhayaratna WP, Seward JB, Appleton CP, et al. Left atrial size: physiologic determinants and clinical applications. J Am Coll Cardiol. 2006;47(12):2357–2363. doi:10.1016/j.jacc.2006.02.048
7. Wilcox JE, Rosenberg J, Vallakati A, Gheorghiade M, Shah SJ. Usefulness of electrocardiographic QT interval to predict left ventricular diastolic dysfunction. Am J Cardiol. 2011;108(12):1760–1766. doi:10.1016/j.amjcard.2011.07.050
8. Zhu TG, Patel C, Martin S, et al. Ventricular transmural repolarization sequence: its relationship with ventricular relaxation and role in ventricular diastolic function. Eur Heart J. 2009;30(3):372–380. doi:10.1093/eurheartj/ehn585
9. Sauer AJ, Selvaraj S, Aguilar FG, et al. Relationship between repolarization heterogeneity and abnormal myocardial mechanics. Int J Cardiol. 2014;172(1):289–291. doi:10.1016/j.ijcard.2013.12.232
10. Nagueh SF, Appleton CP, Gillebert TC, et al. Recommendations for the evaluation of left ventricular diastolic function by echocardiography. J Am Soc Echocardiogr. 2009;22(2):107–133. doi:10.1016/j.echo.2008.11.023
11. Luo S, Michler K, Johnston P, Macfarlane PW. A comparison of commonly used QT correction formulae: the effect of heart rate on the QTc of normal ECGs. J Electrocardiol. 2004;37:
12. Castro-Torres Y, Carmona-Puerta R, Katholi RE. Ventricular repolarization markers for predicting malignant arrhythmias in clinical practice. World J Clin Cases. 2015;3(8):705–720. doi:10.12998/wjcc.v3.i8.705
13. Lang R, Badano L, Mor-Avi V, et al. Recommendations for cardiac chamber quantification by echocardiography in adults: an update from the American Society of Echocardiography and the European Association of Cardiovascular Imaging. Eur Heart J Cardiovasc Imaging. 2015;16(3):233–270. doi:10.1093/ehjci/jev014
14. Pritchett AM, Mahoney DW, Jacobsen SJ, Rodeheffer RJ, Karon BL, Redfield MM. Diastolic dysfunction and left atrial volume: a population-based study. J Am Coll Cardiol. 2005;45(1):87–92. doi:10.1016/j.jacc.2004.09.054
15. Shah A, Claggett B, Sweitzer N, et al. Prognostic importance of changes in cardiac structure and function in heart failure with preserved ejection fraction and the impact of spironolactone. Circ Heart Fail. 2015;8(6):1052–1058. doi:10.1161/CIRCHEARTFAILURE.115.002249
16. Solomon SD, Zile M, Pieske B, et al. The angiotensin receptor neprilysin inhibitor LCZ696 in heart failure with preserved ejection fraction: a phase II randomised-controlled trial. J Card Fail. 2012;18(11):883. doi:10.1016/j.cardfail.2012.10.006
17. Njoku A, Kannabhiran M, Arora R, et al. Left atrial volume predicts atrial fibrillation recurrence after radiofrequency ablation: a meta-analysis. Europace. 2018;20(1):33–42. doi:10.1093/europace/eux013
18. Ahmeti A, Bytyçi F, Bielecka-Dabrowa A, Bytyçi I, Henein M. Prognostic value of left atrial volume index in acute coronary syndrome: a systematic review and meta-analysis. Clin Physiol Funct Imaging. 2021;41(2):128–135. doi:10.1111/cpf.12689
19. Zhang Y, Post W, Blasco-Colmenares E, Dalal D, Tomaselli G, Guallar E. Electrocardiographic QT interval and mortality: a meta-analysis. Epidemiology. 2011;22(5):660–670. doi:10.1097/EDE.0b013e318225768b
20. Mayet J, Shahi M, McGrath K, et al. Left ventricular hypertrophy and QT dispersion in hypertension. Hypertension. 1996;28(5):791–796. doi:10.1161/01.HYP.28.5.791
21. Jani Y, Kamberi A, Xhunga S, et al. The influence of type 2 diabetes and gender on ventricular repolarization dispersion in patients with sub-clinic left ventricular diastolic dysfunction. Am J Cardiovasc Dis. 2015;5(4):155–166.
22. Soliman E, Howard G, Cushman M, et al. Prolongation of QTc and risk of stroke: the REGARDS (REasons for Geographic and Racial Differences in Stroke) study. J Am Coll Cardiol. 2012;59(16):1460–1467. doi:10.1016/j.jacc.2012.01.025
23. Zhang N, Gong M, Tse G, et al. Prolonged corrected QT interval in predicting atrial fibrillation: a systematic review and meta-analysis. Pacing Clin Electrophysiol. 2018;41(3):321–327. doi:10.1111/pace.13292
24. Ordög B, Brutyó E, Puskás L, et al. Gene expression profiling of human cardiac potassium and sodium channels. Int J Cardiol. 2006;111(3):386–393. doi:10.1016/j.ijcard.2005.07.063
25. Melduni R, Cullen M. Role of left ventricular diastolic dysfunction in predicting atrial fibrillation recurrence after successful electrical cardioversion. J Atr Fibrillation. 2012;5(4):654. doi:10.4022/jafib.654
26. Prenner SB, Shah SJ, Goldberger JJ, Sauer AJ. Repolarization Heterogeneity: beyond the QT Interval. J Am Heart Assoc. 2016;5(5). doi:10.1161/JAHA.116.003607
27. Bachmann TN, Skov MW, Rasmussen PV, et al. Electrocardiographic Tpeak-Tend interval and risk of cardiovascular morbidity and mortality: results from the Copenhagen ECG study. Heart Rhythm. 2016;13(4):915–924. doi:10.1016/j.hrthm.2015.12.027
28. Porthan K, Viitasalo M, Toivonen L, et al. Predictive value of electrocardiographic T-wave morphology parameters and T-wave peak to T-wave end interval for sudden cardiac death in the general population. Circ Arrhythm Electrophysiol. 2013;6(4):690–696. doi:10.1161/CIRCEP.113.000356
29. Rosenthal TM, Stahls PF, Abi Samra FM, et al. T-peak to T-end interval for prediction of ventricular tachyarrhythmia and mortality in a primary prevention population with systolic cardiomyopathy. Heart Rhythm. 2015;12(8):1789–1797. doi:10.1016/j.hrthm.2015.04.035
30. Sauer A, Wilcox JE, Andrei AC, Passman R, Goldberger JJ, Shah SJ. Diastolic electromechanical coupling: association of the ECG T-peak to T-end interval with echocardiographic markers of diastolic dysfunction. Circ Arrhythm Electrophysiol. 2012;5(3):537–543. doi:10.1161/CIRCEP.111.969717
31. Yamaguchi M, Shimizu M, Ino H, et al. T wave peak-to-end interval and QT dispersion in acquired long QT syndrome: a new index for arrhythmogenicity. Clin Sci (Lond). 2003;105(6):671–676. doi:10.1042/CS20030010
32. Gupta P, Patel C, Patel H, et al. T(p-e)/QT ratio as an index of arrhythmogenesis. J Electrocardiol. 2008;41(6):567–574. doi:10.1016/j.jelectrocard.2008.07.016
33. Yenerçağ M, Arslan U. Tp-e interval and Tp-e/QT ratio and their association with left ventricular diastolic dysfunction in Fabry disease without left ventricular hypertrophy. J Electrocardiol. 2020;59:20–24. doi:10.1016/j.jelectrocard.2019.12.007
34. Smulyan H. QT interval: bazett’s Correction corrected. J Electrocardiol. 2018;51(6):1009–1010. doi:10.1016/j.jelectrocard.2018.08.013
 © 2021 The Author(s). This work is published and licensed by Dove Medical Press Limited. The full terms of this license are available at https://www.dovepress.com/terms.php and incorporate the Creative Commons Attribution - Non Commercial (unported, v3.0) License.
By accessing the work you hereby accept the Terms. Non-commercial uses of the work are permitted without any further permission from Dove Medical Press Limited, provided the work is properly attributed. For permission for commercial use of this work, please see paragraphs 4.2 and 5 of our Terms.

