Back to Journals » Diabetes, Metabolic Syndrome and Obesity » Volume 13
Association Between Inflammatory Biomarkers and Cognitive Dysfunction Analyzed by MRI in Diabetes Patients
Authors Yang X, Chen Y, Zhang W, Zhang Z, Yang X, Wang P, Yuan H
Received 7 July 2020
Accepted for publication 2 October 2020
Published 29 October 2020 Volume 2020:13 Pages 4059—4065
DOI https://doi.org/10.2147/DMSO.S271160
Checked for plagiarism Yes
Review by Single anonymous peer review
Peer reviewer comments 2
Editor who approved publication: Prof. Dr. Juei-Tang Cheng
Xue Yang, 1,* Yiqi Chen, 2,* Wenshuo Zhang, 3 Zhen Zhang, 4 Xueli Yang, 2 Pengxu Wang, 2 Huijuan Yuan 2
1Department of Education and Training, Diabetes Research Center, Henan Province People’s Hospital, Zhengzhou, Henan Province, People’s Republic of China; 2Department of Endocrinology and Metabolism, Diabetes Research Center, Henan Province People’s Hospital, Zhengzhou, Henan Province, People’s Republic of China; 3Department of Health Examination, Henan Province People’s Hospital, Zhengzhou, Henan Province, People’s Republic of China; 4Department of Endocrinology, Zhoukou Central Hospital, Zhoukou, Henan Province, People’s Republic of China
*These authors contributed equally to this work
Correspondence: Huijuan Yuan
Department of Endocrinology and Metabolism, Diabetes Research Center, Zhengzhou, Henan Province 450003, People’s Republic of China
Email [email protected]
Aim: To explore the relationship between inflammatory biomarkers and cognitive dysfunction in patients with type 1 diabetes mellitus (T1DM) and type 2 diabetes mellitus (T2DM).
Methods: T1DM patients (n=32), T2DM patients (n=90) and age-matched controls (n=36 and 81, respectively) were included. The 72-hour dynamic blood glucose test and cognitive function, including visuoconstructive function, executive function, learning and memory, attention, language expression ability, and orientation, were analyzed. The head, body and tail grey matter of the hippocampus were analyzed by magnetic resonance spectroscopy. In addition, serum HMGB1, IL-1β, IL-6, and TNF-α concentrations were examined.
Results: HbA1C, MAGE and MODD were higher in T1DM patients than in T2DM patients (p< 0.05). MoCA scores and IL-1β and IL-6 levels in patients with T2DM were higher than T1DM patients. NAA/Cr and Cho/Cr of the hippocampus were higher in patients with T1DM than in those with T2DM. Levels of inflammatory factors in T1DM and T2DM patients were higher than in nondiabetic subjects (p< 0.05). Regression analysis showed that cognition was associated with MAGE, MODD, NAA/Cr of the left hippocampus and HMGB1 in T1DM patients, after adjustment for age, sex, BMI and other co-variables. In T2DM patients, cognitive impairment was associated with MAGE, NAA/Cr of the left hippocampus, HMGB1 and IL-6, after adjustment for co-variables such as sex, age and BMI.
Conclusion: T2DM patients have more cognitive impairment than T1DM patients. Changes in brain function connections and metabolites may be the structural basis of the differences in cognitive functional impairment. Inflammation is related to cognitive impairment in diabetes patients, especially in T2DM patients.
Keywords: cognitive impairment, diabetes, inflammation
Introduction
The prevalence of diabetes mellitus (DM) has increased dramatically worldwide, and most of the morbidity and mortality of diabetes is due to the development of complications.1 Dejong et al proposed that “diabetes encephalopathy” may be one of the diabetic complications.2 Indeed, the risk of dementia in DM patients is higher than in nondiabetic controls.3 If dementia symptoms occur, treatments are considered to be useless in reversing or delaying the development of dementia.4 Therefore, actively preventing and postponing the occurrence and progression of cognitive impairment is critical.
The type 1 diabetes mellitus (T1DM) and type 2 diabetes mellitus (T2DM) are two main forms of diabetes. Nunley et al demonstrated that childhood-onset T1DM is related to a change in visuoconstruction function.5 However, cognition is characterized by diminished memory and attention in T2DM patients.6–8 A systemic review revealed the association of T1DM and cognitive changes in youths and adults.9 In addition, a recent meta-analysis showed that adults with T2DM had significant deficits across multiple domains of cognitive function and their cognitive dysfunction was associated with poor glycemic control.10 In general, T1DM seems to be related to slow mental processing and executive/attentional functioning, while T2DM is related additionally to memory problems. However, the relationship between diabetes and non-vascular dementia is still controversial and needs further studies.
T2DM is mainly characterized by insulin resistance and hyperinsulinemia. The inflammatory factors secreted by fat cells directly or indirectly act on the pancreas to inhibit insulin secretion by islet β cells and cause damage to islet β cells. These factors can aggravate insulin resistance and inflammation, which can aggravate diabetes.11 Inflammation is involved in cognitive impairment.12 Animal studies have shown that the release of inflammatory cytokine high-mobility group box-1 (HMGB1) contributes to neurodegenerative diseases.13 Elevated brain levels of HMGB1 could induce memory abnormalities.14,15 However, no clinical study has reported the association between HMGB1 and cognitive impairment in diabetes patients.
Animal experiments have shown that neuroanatomical and neurochemical changes in brain occur in the preclinical stage of cognitive function disorders.16 Noninvasive MRI techniques, such as proton magnetic resonance spectroscopy (1H-MRS) and resting-state functional MRI (rs-fMRI), are used to detect hippocampal neurochemical changes and functional links between brain regions.11 We hypothesized that the changes in cognitive function and magnetic resonance neurography are different depending on different types of diabetes. Therefore, the major aim of this study is to investigate the association of inflammation with cognitive impairments and neuroanatomical changes in two types of diabetes patients.
Subjects and Methods
Participants
This study was approved by the Ethics Committee of Henan Province People’s Hospital and was performed complied with the Declaration of Helsinki. All enrolled subjects provided written informed consent. A total of 122 patients with T1DM (n=32) and T2DM (n=90) participated in this study between January 2015 and June 2016 based on the World Health Organization criteria for diabetes,17 and 117 nondiabetic control subjects were enrolled who matched T1DM and T2DM patients by age. Subjects meeting any of the following criteria were excluded: neurological diseases such as cerebrovascular diseases, brain trauma, anemia, thyroid dysfunction, alcoholism or the use of drugs affecting brain function, severe hypoglycemia, diabetic ketoacidosis, acute cardiovascular accident, pregnancy, severe vision or hearing loss, any contraindications for MR imaging, and left-handed subjects.
Measurements
Data were collected from each patient including sex, age, educational level, diabetes duration, smoking history and body mass index. Glycemic data were collected by continuous glucose monitoring (CGM) for at least 72 hours (24 hours overnight). The mean of the daily differences (MODD) was considered as the mean of the absolute differences between glucose values on day 2 and the corresponding values on day 1. The mean amplitude of glucose excursions (MAGE) was the mean of the absolute differences between peak and nadir values over 24 hours.
Blood samples were collected from subjects in fasting state to measure glycosylated hemoglobin (HbA1c), triglyceride (TG), total cholesterol (TC), low-density lipoprotein (LDL-C), and high-density lipoprotein (HDL-C). In addition, plasma HMGB1, interleukin-1β (IL-1β), interleukin-6 (IL-6) and tumor necrosis factor-α (TNF-α) levels were detected by using ELISA kit (R & D Systems, Minneapolis, USA).
Neuropsychological Assessment
Montreal Cognitive Assessment (MoCA) was used to evaluate cognitive function, including visuoconstructive function, executive function, learning and memory, attention, language expression ability, and orientation.
MRS Imaging
Brain imaging was performed using Siemens Trio 3T scanner. According to the long axis of the hippocampus, the head, body and tail grey matter of the hippocampus were determined as the region of interest. Hydrogen proton magnetic resonance spectroscopy was performed using multiple voxel acquisition methods, TR1700 ms, TE135 ms, FOV160 mm×160 mm, voxel size: 10×10×15 mm, layer thickness 1 mm, total time: 6:53. The peak height and the area under the peak of each of the three metabolites Cr, NAA and Cho were calculated.
fMRI
MRI scans were obtained on a Magnetom Trio 3.0T scanner (Siemens, Erlangen, Germany). Functional images were acquired using a gradient echo T2-weighted pulse sequence with TR = 2000 ms, TE = 30 ms, matrix = 64 × 64, field of view (FOV) = 240 mm × 240 mm, slice thickness = 4 mm, and flip angle (FA) = 90°. Each functional resting-state scan lasted 7 min, and 210 volumes were collected.
Functional connectivity analysis was performed with REST as described previously.12 The representative time series of each region was estimated by averaging the fMRI time series over all voxels in the region. The model goodness criteria were the Pearson’s correlation coefficient as well as the mean absolute error (MAE) between the real and estimated MoCA scores.
Statistical Analysis
Statistical analysis was performed with SPSS 19.0. Data with normal distribution were shown as mean ± standard deviation (±SD) and analyzed by t-test. For data without normal distribution, rank-sum test was used for analysis. For counting data, statistical composition description was carried out using a composition ratio, and a chi-square test was used for analysis. Pearson and Spearman correlation analyses and multiple regression analysis were used to assess associations. P<0.05 indicated a significant difference.
Results
Clinical, Cognitive, Serological and MRS Data of T1DM and T2DM Patients
We found no significant difference in sex, highest educational level, smoking history or duration of disease in T1DM and T2DM patients. In addition, we found differences in age, body mass index (BMI) values and blood lipid concentrations in T1DM and T2DM patients (p<0.05).
HbA1C, MAGE and MODD were higher in T1DM patients than in T2DM patients (p<0.05). We observed that MoCA scores and IL-1β and IL-6 levels in patients with T2DM were higher than in T1DM patients. NAA/Cr and Cho/Cr of the hippocampus were higher in patients with T1DM than in those with T2DM. Levels of inflammatory factors in T1DM and T2DM patients were higher than in nondiabetic subjects (Tables 1–3). The cognitive functional impairment in T1DM and T2DM patients are summarized in Tables 4 and 5.
 |
Table 1 Demographic, Clinical, Cognitive, Serological, and MRS Data of Patients with T1DM and T2DM |
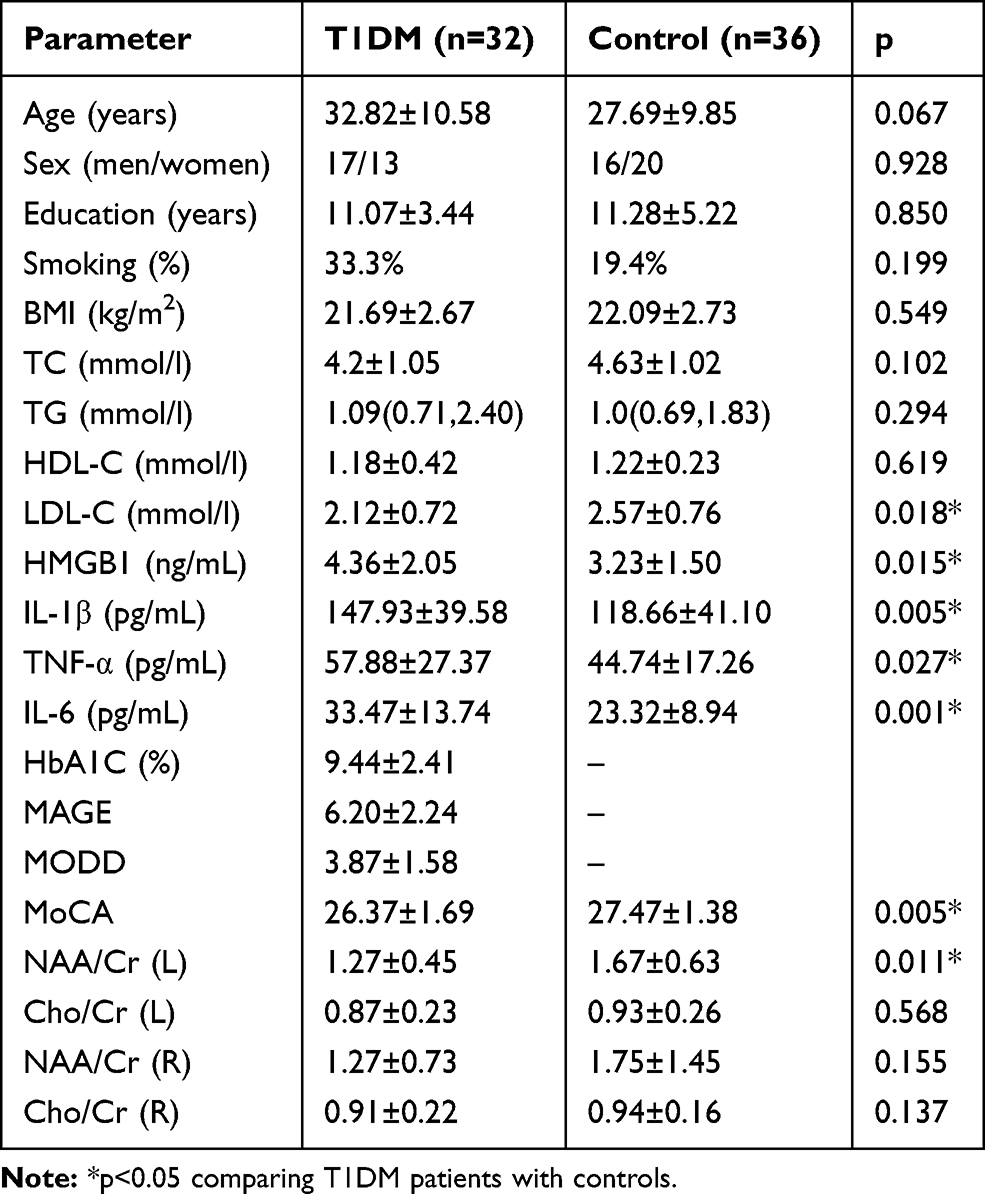 |
Table 2 Demographic, Clinical, Cognitive, Serological, and MRS Data of Patients with T1DM and Control |
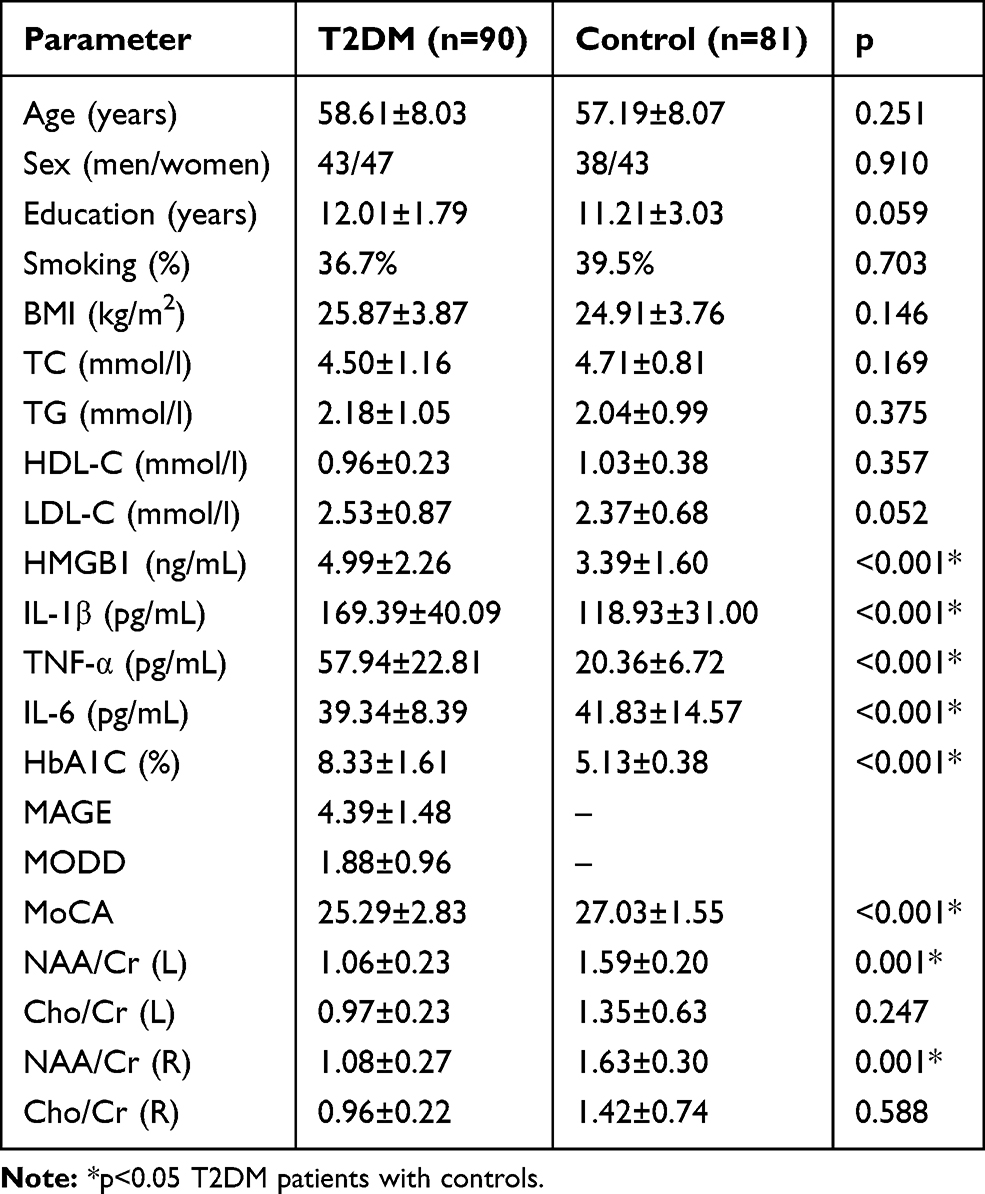 |
Table 3 Demographic, Clinical, Cognitive, Serological, and MRS Data of Patients with T2DM and Control |
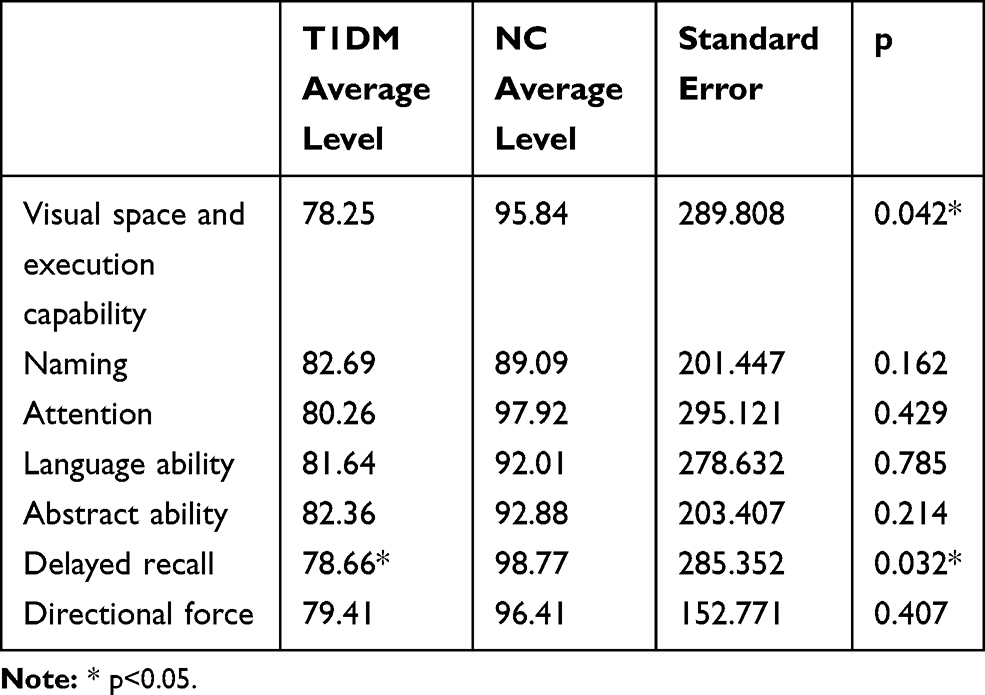 |
Table 4 Comparison of MoCA Scores in Patients with T1DM and NC |
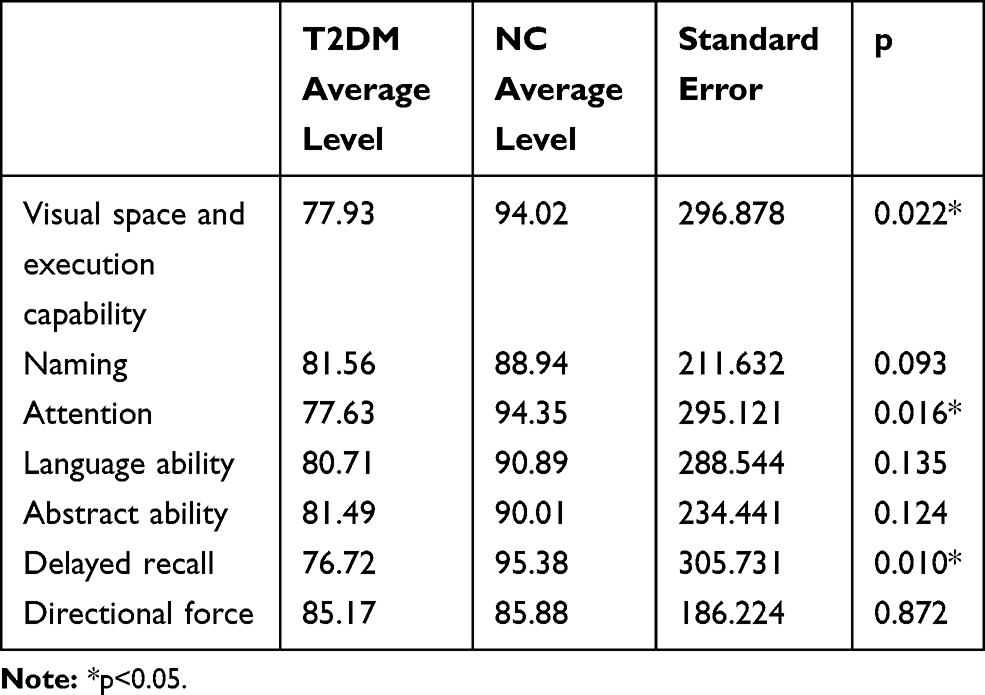 |
Table 5 Comparison of MoCA Scores in Patients with T2DM and NC |
Correlation of Cognitive Function with Clinical, Serological, and MRS Data
We found that lower MoCA was related to higher MAGE (p<0.05) and lower MoCA was related to lower NAA/Cr (L) (p<0.05) in T1DM and T2DM patients. In addition, NAA/Cr was negatively correlated with MAGE and HMGB1 in T2DM patients but not in T1DM patients. Furthermore, a negative association was found between MODD and NAA/Cr (L) in T1DM patients (p<0.05) (Tables 6 and 7). Moreover, MoCA scores were negatively correlated with HbA1c and positively correlated with education in T1DM and T2DM patients. MoCA scores of T2DM patients were negatively correlated with age and BMI.
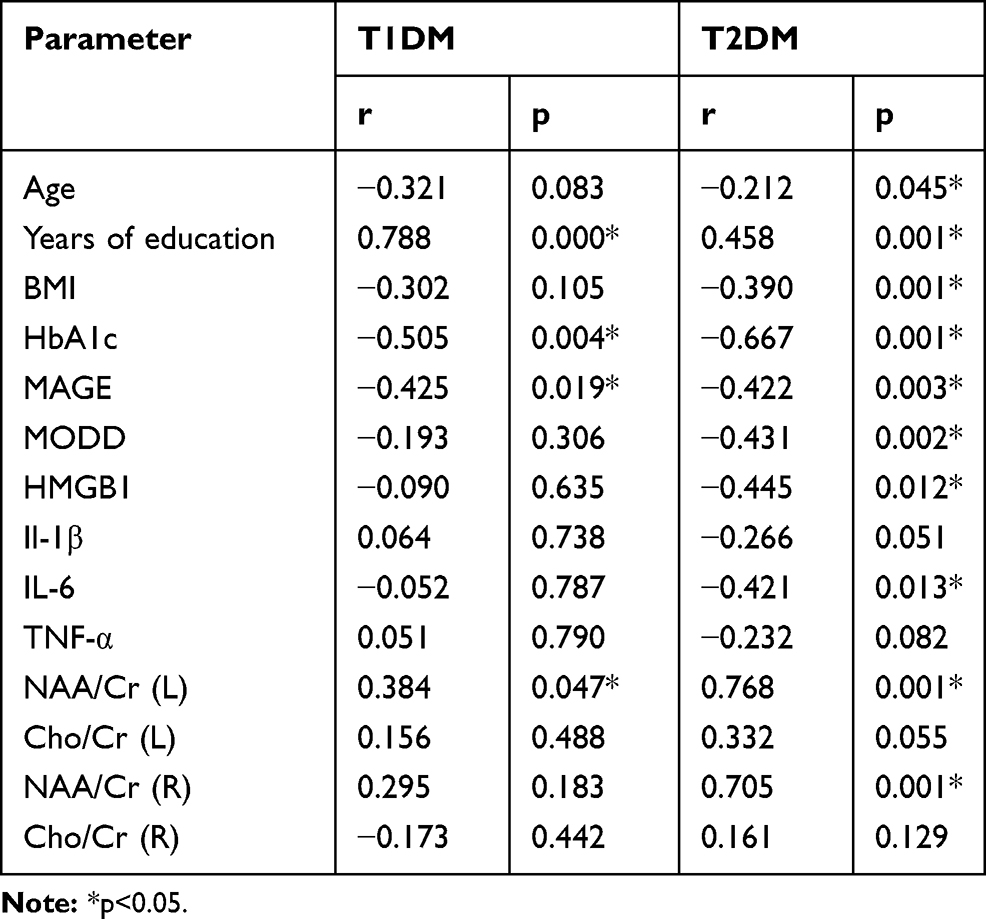 |
Table 6 The Association Between Cognition and Glucose Viability, Serological, and MRS Data |
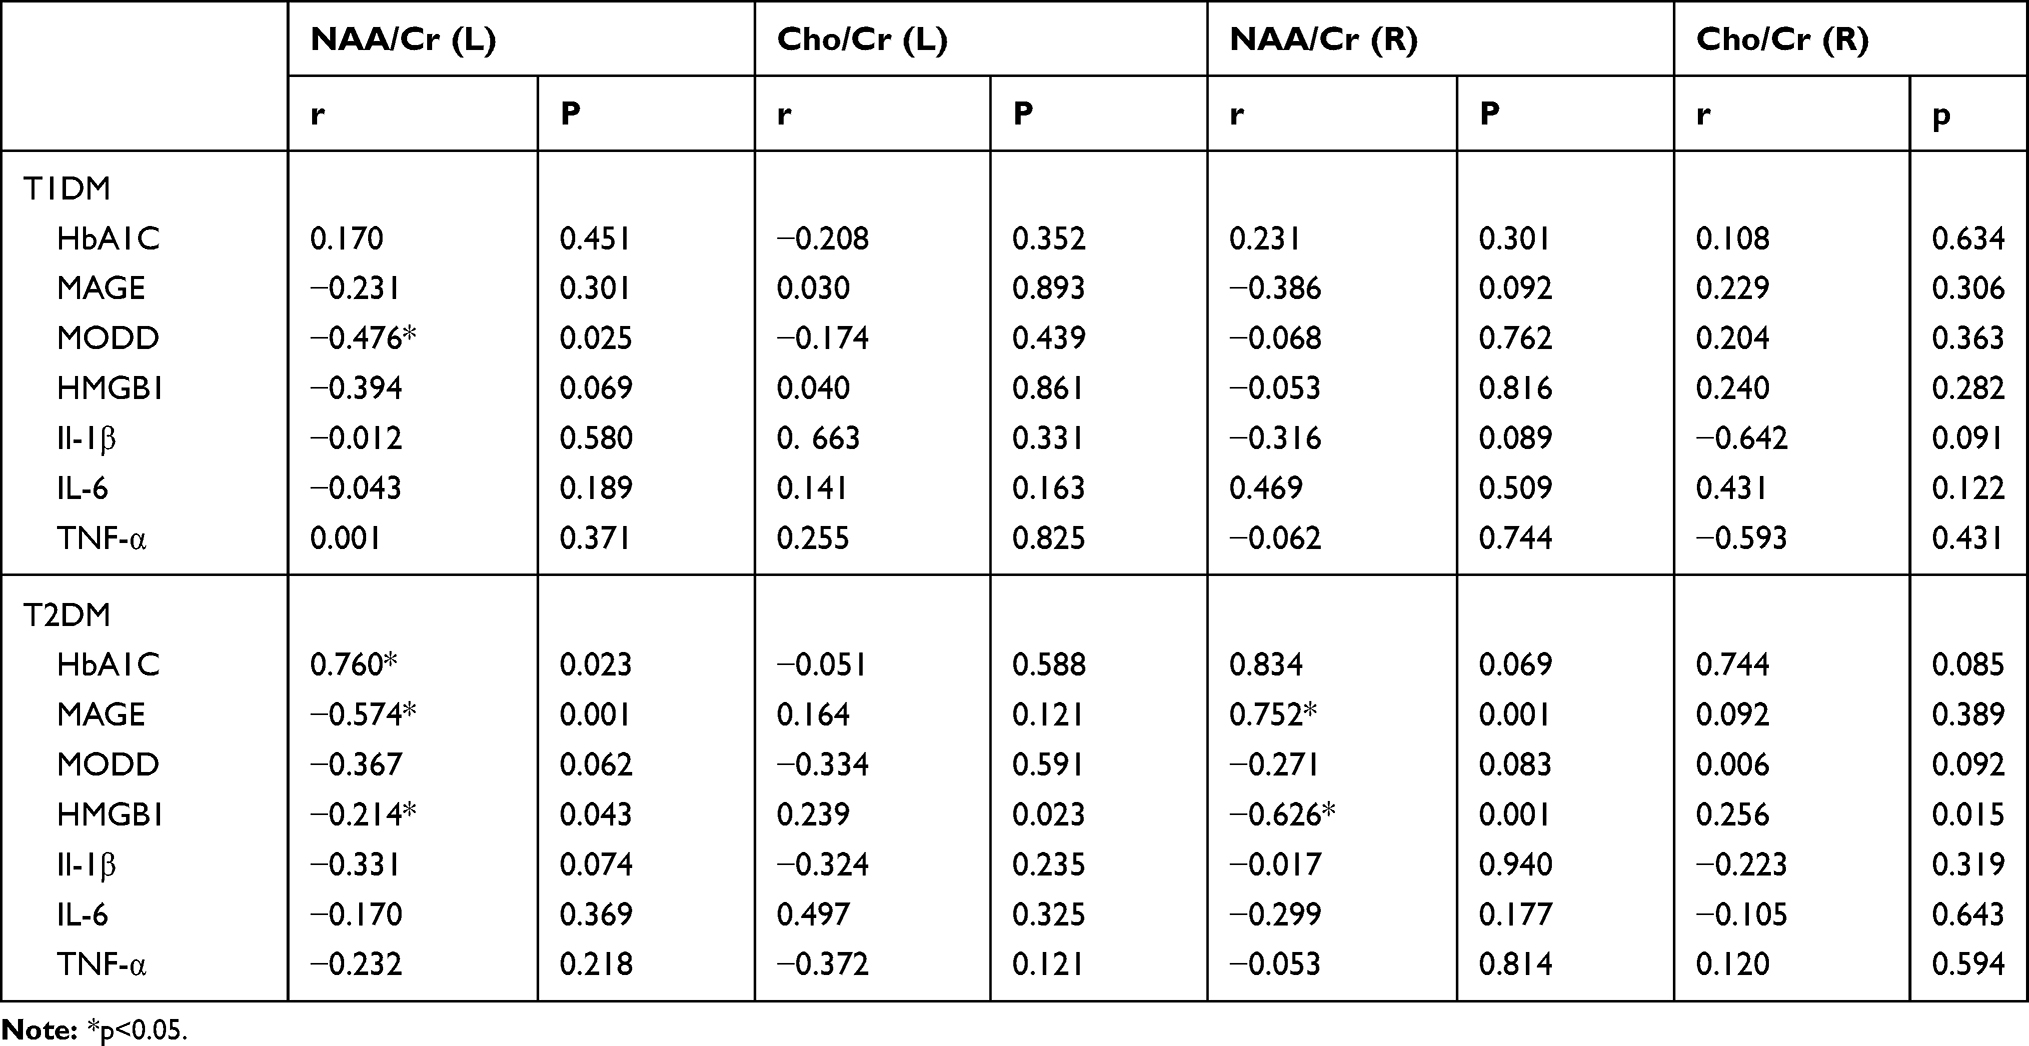 |
Table 7 The Association Between MRS Data and Glucose Viability and Serological Data |
Multiple Regression Analysis of Cognition and Risk Factors
Using the MoCA score as the dependent variable, nonlinear regression analysis showed that cognition was associated with MAGE, MODD, NAA/Cr of the left hippocampus and HMGB1 in T1DM patients, after adjustment for age, sex, BMI and other co-variables. In T2DM patients, cognitive impairment was related to MAGE, NAA/Cr of the left hippocampus, HMGB1 and IL-6, after adjustment for co-variables such as sex, age and BMI.
Discussion
In this study, we compared cognitive function impairment in patients with type 1 and type 2 diabetes. Cognitive functional impairment involves visual-spatial ability and delayed memory in T1DM patients, whereas cognitive functional impairment in T2DM patients involves visual-spatial ability, delayed memory, and decreased attention. Our results are different from previous findings that memory decrements are not commonly found in type 1 diabetes. However, a previous study showed that T1DM patients had cognitive functional impairment in the early stage of the disease,18 which was consistent with the present study. In T2DM patients, cognition is characterized by slow information processing and diminished memory, attention and executive function. In addition, by respective comparisons with nondiabetic control subjects, we found that cognitive impairment in T1DM patients and T2DM patients had clinical significance.
fMRI is widely used in investigating neuropsychiatric diseases including dementia.19 Patients with DM had reduced functional connectivity in the ventral attention network area, but there was no significant change in functional connectivity in DM patients without microvascular disease.20 The frontal lobe cortex is the structural basis of spatial and logical reasoning and contains extensive contact fibers in the anterior region, which are related to memory and judgment.21 The parietal cortex is involved in spatial attention, and the occipital lobe is related to visuospatial ability.22 The changes in connectivity between the hippocampus and multiple brain regions may be the structural basis for cognitive impairment. In this study, compared with T1DM patients, T2DM patients have decreased attention, and this may be related to decreased connectivity of the hippocampus to the parietal lobe, which is associated with attention.
The hippocampus is highly susceptible to IL-6, which can reduce synaptic plasticity by inhibiting learning and memory functions in the hippocampus. IL-6 can cause neuroinflammation and damage the myelin structure of the nerves. In the middle-aged population, subjects with high plasma IL-6 level had an increased risk of cognitive dysfunction.23 In people with a family history of AD, inflammatory factor levels began to rise before cognitive dysfunction in middle age.24 In this study, IL-6 and IL-1β levels were higher in patients with T2DM than in those with T1DM. Therefore, obesity may aggravate chronic inflammatory response in T2DM patients and accelerate cognitive dysfunction.
Our study has some limitations. First, the age of T2DM patients was older than that of T1DM patients, which may cause a potential bias. Second, we used MoCA, which is only a screener. Third, this study is a cross-sectional study that cannot determine the causality between cognition and inflammation factors in patients with diabetes. Therefore, age-matched cohort studies are required to confirm our results.
In conclusion, T1DM patients showed decreased visual-spatial and executive ability and delayed memory, while T2DM patients had decreased visual-spatial and executive ability, and reduced memory and attention. Furthermore, inflammation is closely related to cognitive impairment in diabetes patients and is more aggressive in T2DM patients.
Acknowledgments
This study was supported by the National Natural Science Foundation of China (No. 81970705) and Technology Benefit People Project of Zhengzhou (No. 189PKJHM0782). The abstract of this paper was presented at the 55th EASD Annual Meeting of the European Association for the Study of Diabetes.
Disclosure
All authors declare no conflicts of interest for this work.
References
1. Giraud-Billoud M, Fader CM, Agüero R, Ezquer F, Ezquer M. Diabetic nephropathy, autophagy and proximal tubule protein endocytic transport: a potentially harmful relationship. Biocell. 2018;42:35–40. doi:10.32604/biocell.2018.07010
2. Dejong R. The nervous system complications of diabetes mellitus, with special reference to cerebrovascular changes. J Nerv Ment Dis. 1950;111(3):181–206. doi:10.1097/00005053-195011130-00001
3. Cukierman T, Gerstein H, Williamson J. Cognitive decline and dementia in diabetes—systematic overview of prospective observational studies. Diabetologia. 2005;48(12):2460–2469. doi:10.1007/s00125-005-0023-4
4. Munoz EM. Microglia-precursor cell interactions in health and in pathology. Biocell. 2018;42(2):41–45. doi:10.32604/biocell.2018.07011
5. Nunley KA, Rosano C, Ryan CM, et al. Clinically relevant cognitive impairment in middle-aged adults with childhood-onset type 1 diabetes. Diabetes Care. 2015;38(9):1768–1776. doi:10.2337/dc15-0041
6. Awad N, Gagnon M, Messier C. The relationship between impaired glucose tolerance, type 2 diabetes, and cognitive function. J Clin Exp Neuropsychol. 2004;26(8):1044–1080. doi:10.1080/13803390490514875
7. Manschot SM, Brands AMA, Van der Grond J, et al. Brain magnetic resonance imaging correlates of impaired cognition in patients with type 2 diabetes. Diabetes. 2006;55(4):1106–1113. doi:10.2337/diabetes.55.04.06.db05-1323
8. Robinson JG, Watson KE. Identifying patients for nonstatin therapy. Rev Cardiovasc Med. 2018;19(S1):S1–S8.
9. Li W, Huang E, Gao SJ. Type 1 diabetes mellitus and cognitive impairments: a systematic review. Alzheimers Dis. 2017;57(1):29–36. doi:10.3233/JAD-161250
10. Mansur RB, Lee Y, Zhou AJ, et al. Determinants of cognitive function in individuals with type 2 diabetes mellitus: a meta-analysis. Ann Clin Psychiatry. 2018;30(1):38–50.
11. Sun D, Zhang J, Fan Y, et al. Abnormal levels of brain metabolites may mediate cognitive impairment instroke-free patients with cerebrovascular risk factors. Age Ageing. 2014;43(5):681–686. doi:10.1093/ageing/afu027
12. Bolo NR, Musen G, Simonson DC, et al. Functional connectivity of insula, basal ganglia, and prefrontal executive control networks during hypoglycemia in type 1 diabetes. J Neurosci. 2015;35(31):11012–11023. doi:10.1523/JNEUROSCI.0319-15.2015
13. Leslie RD, Palmer J, Schloot NC, Lernmark A. Diabetes at the crossroads: relevance of disease classification to pathophysiology and treatment. Diabetologia. 2016;59:13–20. doi:10.1007/s00125-015-3789-z
14. Skyler JS, Bakris GL, Bonifacio E, et al. Differentiation of diabetes by pathophysiology, natural history, and prognosis. Diabetes. 2017;66(2):241–255. doi:10.2337/db16-0806
15. Liu L, Chan C. IPAF inflammasome is involved in interleukin-1beta production from astrocytes, induced by palmitate; implications for alzheimer’s disease. Neurobiol Aging. 2014;35:309–321. doi:10.1016/j.neurobiolaging.2013.08.016
16. Czeh B, Lucassen PJ. What causes the hippocampal volume decrease in depression? Are neurogenesis, glial changes and apoptosis implicated? Eur Arch Psychiatry Clin Neurosci. 2007;257(5):250–260. doi:10.1007/s00406-007-0728-0
17. WHO. Definition and Diagnosis of Diabetes Mellitus and Intermediate Hyperglycemia. WHO. 2006:50.
18. Cameron FJ, Scratch SE, Nadebaum C, et al. Neurological consequences of diabetic ketoacidosis at initial presentation of type 1 diabetes in a Prospective Cohort Study of Children. Diabetes Care. 2014;37(6):1554–1562. doi:10.2337/dc13-1904
19. Zonis S, Ljubimov VA, Mahgerefteh M, et al. p21 Cip restrains hippocampal neurogenesis and protects neuronal progenitors from apoptosis during acute systemic inflammation. Hippocampus. 2013;23(12):1383–1394. doi:10.1002/hipo.22192
20. van Duinkerken E, Schoonheim MM, Sanz-Arigita EJ, et al. Resting-state brain networks in type 1 diabetic patients with and without microangiopathy and their relation to cognitive functions and disease variables. Diabetes. 2012;61(7):1814–1821. doi:10.2337/db11-1358
21. Mauras N, Mazaika P, Buckingham B, et al. Longitudinal assessment of neuroanatomical and cognitive differences in young children with type 1 diabetes: association with hyperglycemia. Diabetes. 2015;64(5):1770–1779. doi:10.2337/db14-1445
22. Zhou J, Li H, Ran X, et al. Establishment of normal reference ranges for glycemic variability in Chinese subjects using continuous glucose monitoring. Med Sci Monit. 2011;17(1):CR9–CR13. doi:10.12659/MSM.881318
23. Zou J, Crews FT. Inflammasome–IL-1β signaling mediates ethanol inhibition of hippocampal neurogenesis. Front Neurosci. 2012;30(6):77.
24. Rizzo MR, Barbieri M, Marfella R, et al. Reduction of oxidative stress and inflammation by blunting daily acute glucose fluctuations in patients with type 2 diabetes: role of dipeptidyl peptidase-IV inhibition. Diabetes Care. 2012;35(10):2076–2082. doi:10.2337/dc12-0199
 © 2020 The Author(s). This work is published and licensed by Dove Medical Press Limited. The
full terms of this license are available at https://www.dovepress.com/terms
and incorporate the Creative Commons Attribution
- Non Commercial (unported, 3.0) License.
By accessing the work you hereby accept the Terms. Non-commercial uses of the work are permitted
without any further permission from Dove Medical Press Limited, provided the work is properly
attributed. For permission for commercial use of this work, please see paragraphs 4.2 and 5 of our Terms.
© 2020 The Author(s). This work is published and licensed by Dove Medical Press Limited. The
full terms of this license are available at https://www.dovepress.com/terms
and incorporate the Creative Commons Attribution
- Non Commercial (unported, 3.0) License.
By accessing the work you hereby accept the Terms. Non-commercial uses of the work are permitted
without any further permission from Dove Medical Press Limited, provided the work is properly
attributed. For permission for commercial use of this work, please see paragraphs 4.2 and 5 of our Terms.