Back to Journals » International Journal of General Medicine » Volume 14
Association Between Hemoglobin and Growth Hormone Peak in Chinese Children and Adolescents with Short Stature: A Cross-Sectional Study
Authors Zhang T, Ban B ![]() , Zhang M, Ji B, Sun H, Sun B
, Zhang M, Ji B, Sun H, Sun B
Received 19 November 2020
Accepted for publication 25 January 2021
Published 16 February 2021 Volume 2021:14 Pages 497—504
DOI https://doi.org/10.2147/IJGM.S292920
Checked for plagiarism Yes
Review by Single anonymous peer review
Peer reviewer comments 2
Editor who approved publication: Dr Scott Fraser
Tian Zhang,1 Bo Ban,2,3 Mei Zhang,2,3 Baolan Ji,2,3 Hailing Sun,2,3 Bing Sun1
1Department of Clinical Medicine, Jining Medical University, Jining, Shandong, People’s Republic of China; 2Department of Endocrinology, Affiliated Hospital of Jining Medical University, Jining Medical University, Jining, Shandong, People’s Republic of China; 3Chinese Research Center for Behavior Medicine in Growth and Development, Jining, Shandong, People’s Republic of China
Correspondence: Bing Sun
Department of Clinical Medicine, Jining Medical University, 16 Hehua Road, Beihu New District, Jining, Shandong, People’s Republic of China
Email [email protected]
Hailing Sun
Department of Endocrinology, Affiliated Hospital of Jining Medical University, Jining Medical University, 89 Guhuai Road, Jining, 272029, Shandong, People’s Republic of China
Email [email protected]
Objective: This research aimed to investigate the relationship between hemoglobin (Hb) and growth hormone (GH) peak in children and adolescents with short stature.
Design: This cross-sectional study included a total of 787 children and adolescents with short stature. Anthropometric and biochemical indicators were measured at baseline. All patients underwent GH provocation tests with L-dopa and insulin to assess GH peak levels.
Results: The univariate analysis results showed that Hb was positively associated with GH peak (β 0.07, P=0.001). Furthermore, a non-linear relationship was detected between Hb and GH peaks through smooth curve fitting, and the inflection point was 123 g/L after multivariate piecewise linear regression analysis. GH peak increased with Hb elevation when the Hb level was greater than 123 g/L (β 0.08, 95% CI 0.01, 0.14; P=0.0207).
Conclusion: In children and adolescents with short stature, we found GH peak was positively associated with the Hb level when the Hb level reached the inflection point.
Keywords: hemoglobin, growth hormone peak, short stature
Introduction
Short stature refers to individuals in a similar living environment and of the same race, same sex and age who are 2 standard deviations lower than the average height of the normal population.1 Children and adolescents with short stature are usually suffered from low GH levels. The GH/Insulin-like growth factor-1 (IGF-1) axis plays an important role during critical periods of child growth and development.2,3 Previous studies have shown that GH/IGF-1 axis disorder is more common in children with short stature.4
Therefore, it is important to explore the factors that influenced by GH for understanding the pathogenesis of short stature. Many studies have shown that GH level in children is closely related to the nutritional status of the body.5,6 Nutrition plays a critical role in programming and shaping linear growth through influencing the neuroendocrine somatotropic (GH/IGF-1) axis.7 Hb is an indicator of the nutritional status of the human body, and Hb levels are largely affected by diet.8,9
In recent years, Hb has been found to be associated with linear growth and low Hb level has adverse effects on the growth and development of early childhood.10–12 In 40 Children with iron deficiency anemia who were significantly shorter than age-matched counterparts treated for 6 months, growth velocity and BMI increased significantly.13 Previous studies have also shown that low Hb levels are associated with growth hormone deficiency (GHD).14 Ciresi et al conducted a retrospective cohort study and found that the percentage of anemic patients in GHD children treated with GH decreased significantly at 3-year follow-up, and Hb levels increased significantly in both anemic and non-anemic children.15 A potential mechanism could be that anemia causes hypoxia in hepatocytes, thereby inhibiting protein synthesis,16,17 and a low level of Hb can also reduce the sensitivity of GH.18 GH promotes the clonogenicity of peripheral blood erythroid progenitor cells and enhances the cell cycle progression of hematopoietic progenitor cells mediated by IGF-I.19,20 Indeed, IGF-I has erythropoietin like activity, which can act directly through erythropoietin independent pathway or by enhancing erythropoietin production.21,22
GH is secreted in pulses, with obvious fluctuations occurring during day and night. Thus, GH levels at a single time point cannot accurately reflect GH secretion status in the body, and peak-stimulated GH after provocation testing is therefore used to determine GH status. However, the specific correlation between Hb and GH peaks is not clear and there is little literature about the relationship between Hb and GH peaks in Chinese children and adolescents with short stature. Thus, we conduct this study and retrospectively explored the relationship between Hb and GH peaks in children and adolescents with short stature.
Materials and Methods
Study Population
Participant data were collected from cohort GDDSD study (Growth and Development Diseases in Shandong Province: a cohort follow-up study, http://www.chictr.org.cn,ChiCTR1900026510). All procedures were performed in accordance with the ethical standards laid out in the Declaration of Helsinki. Written informed consent was obtained from each participant before data collection.
This cross-sectional study analysed data collected from a total of 871 participants between March 1, 2013 and February 28, 2019. Inclusion criteria were as follows: each participant was completely in accordance with short stature; body weight and length at birth were in the normal range; and all patients agreed to undergo two GH provocation tests with L-dopa and insulin. All subjects who underwent growth hormone testing were included in the analysis regardless of their peak-stimulated growth hormone values. Exclusion criteria included patients with any of the following: thyroid dysfunction, brain tumour, Turner syndrome, congenital heart disease, chronic liver or kidney disease, malnutrition, congenital metabolic disease, chromosome abnormalities, anaemia and other hematological disorders that could affect erythropoiesis. All tests were performed in a short-stay ward by experienced nurses according to established criteria.23 This study eventually enrolled 787 children and adolescents according to the above criteria.
Anthropomorphic Measurements
All participants were measured with the same height-measuring instrument (Nantong Best Industrial Co. Ltd. Jiangsu, China), with an allowable error range of 0.1 cm. Participant height was measured after participants removed their hat and shoes. Height SDS was calculated based on the normal range for Chinese children.24 The weight of all participants was measured with the same weighing scale (Xiangshan Weighing Apparatus Co. Ltd. Guangdong, China) and was accurate within ± 0.1 kg. Participant weight was measured in a fasting state. Body mass index (BMI) was calculated as weight (kilograms)/height (metres squared). The stage of puberty was assessed by physical examination according to the Tanner stages.25 The following criteria were used to define prepuberty: for boys, a testicular volume of less than 4 mL and no pubic hair; for girls, no breast development and no pubic hair.26–28
Laboratory Measurements
To measure GH peak, two types of GH provocation tests were performed in sequence. On the first day, a provocation test with L-dopa was administered; participants with a body weight <30 kg received 0.25 g orally and those with a body weight ≥30 kg received 0.5 g orally. Blood was collected at 0, 30, 60, 90, 120 min, and GH level was measured by radioimmunoassay. On the second day, a second GH provocation test was performed with an intravenous bolus of ordinary insulin. The insulin dose was 0.1–0.15 U/kg, and both blood glucose and GH levels were monitored at 0, 15, 30, 60, 90, and 120 min. The success rate of the test was determined by the minimum value of blood glucose lowered by 50% or ≤2.8 mmol/L. Before the trial, all participants and their guardians received health education, in which they were informed that the participant would undergo the tests while ensured adequate sleep. All participants fasted for 8 hours before the test. Both tests were performed while the participant was in a quiet state.
GH concentration was determined by a chemiluminescence method (ACCESS2, Beckman Coulter; USA) with an analytical sensitivity of 0.010 ug/L. We obtained Hb through an automatic blood analyser (XN-20,125 (Al), SYSMEX; Japan). Date of renal function measurements, including creatinine (Cr) and uric acid (UA), liver function measurements, including alanine aminotransferase (ALT) and aspartate aminotransferase (AST), lipid profiles, including total cholesterol (TC), triglyceride (TG), high-density lipoprotein cholesterol (HDL-C), low-density lipoprotein cholesterol (LDL-C) and fasting plasma glucose (FPG) were extracted from hospital laboratory, and the values were assessed using a biochemical autoanalyser (Cobas c 702, Roche; Shanghai, China).
Statistical Analysis
All analyses were performed with the statistical software packages R (http://www.R-project.org, The R Foundation) and EmpowerStats (http://www.empowerstats.com, X&Y Solutions, Inc, Boston, MA). The continuous variables were expressed by mean ± SD and categorical variables by a percentage (%). A univariate analysis model (Table 3) was used to determine the relationship between GH peak and Hb, as well as any association with other independent variables. We then investigated the relationship between Hb and GH peaks using smooth curve fitting after adjustment for potential confounders (Figure 1). P values <0.05 (two-sided) were regarded as statistically significant.
 |
Figure 1 Association between Hb and GH peak. Solid line represents the smooth curve fit between variables. Dotted line represents the 95% of confidence interval from the fit. All adjusted for age, sex, BMI SDS, UA, TC, TG, Cr, E2, T, Tanner stage. |
Results
Baseline Characteristics
Data of 787 participants were selected for the final analysis. Table 1 shows baseline characteristics of participant anthropometric measurements and biomarkers. The mean age of participants was 10.3 ± 3.5 years old. A total of 558 (70.90%) males and 229 (29.10%) females were included. The mean height SDS of participants was −2.66 ± 0.58. GH peak value was defined as the highest level of GH, regardless of time point or provocation test. We divided GH peak levels into three groups: GH < 5 ng/mL; GH 5 ng/mL-10 ng/mL; and GH ≥ 10 ng/mL (Table 2). BMI and TC decreased across the tertiles (P < 0.001), but E2, T, IGF-1 and Hb increased in the three groups (all P < 0.05). However, there were no obvious significant differences in age, Cr, UA, or TG (all P > 0.05).
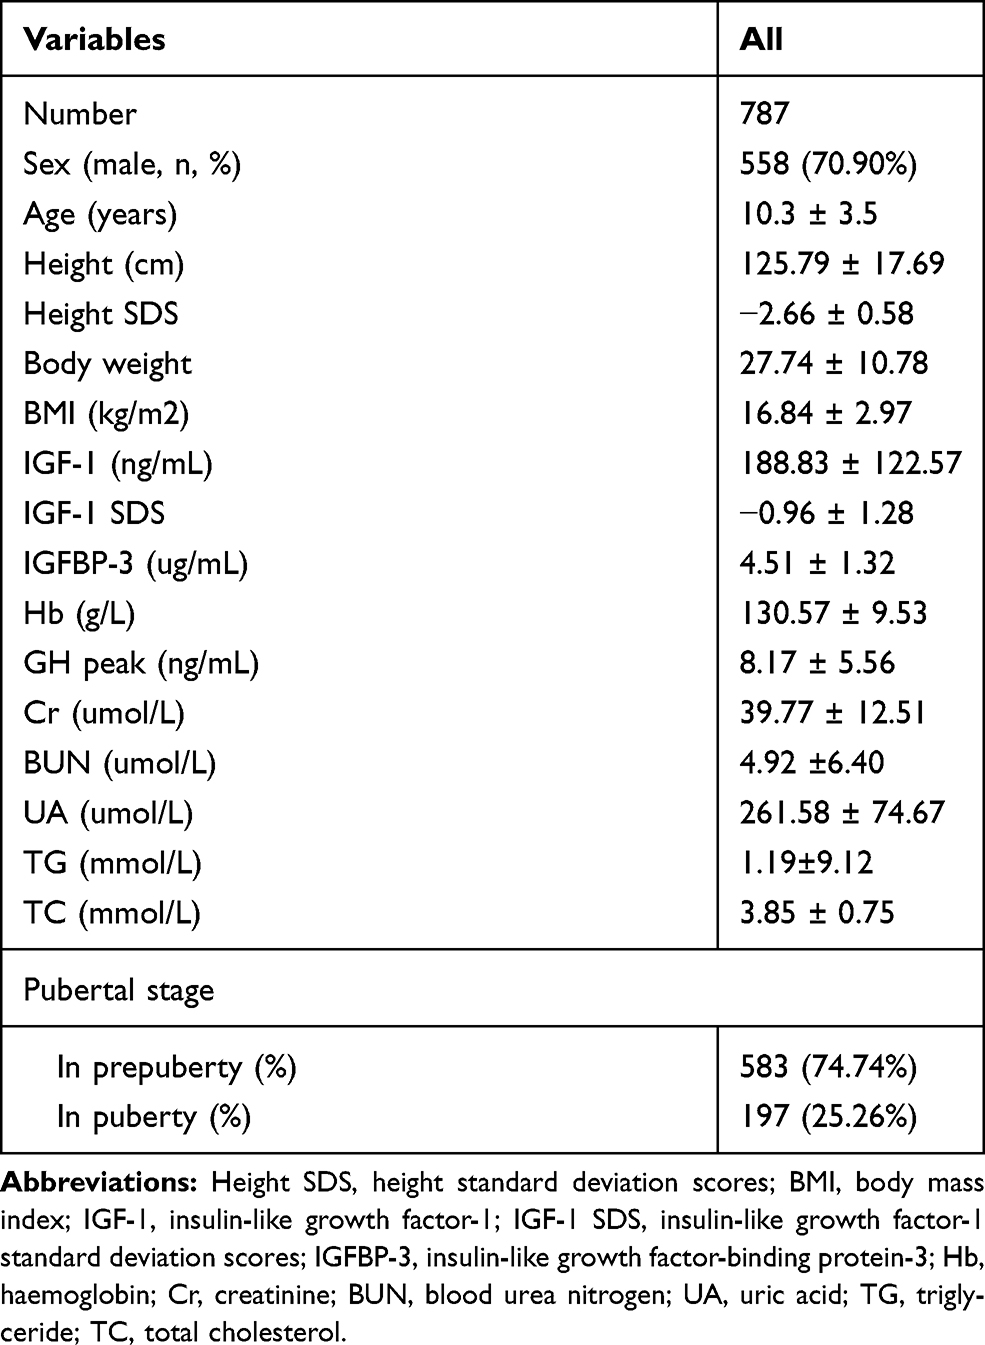 |
Table 1 Clinical and Biochemical Characteristics |
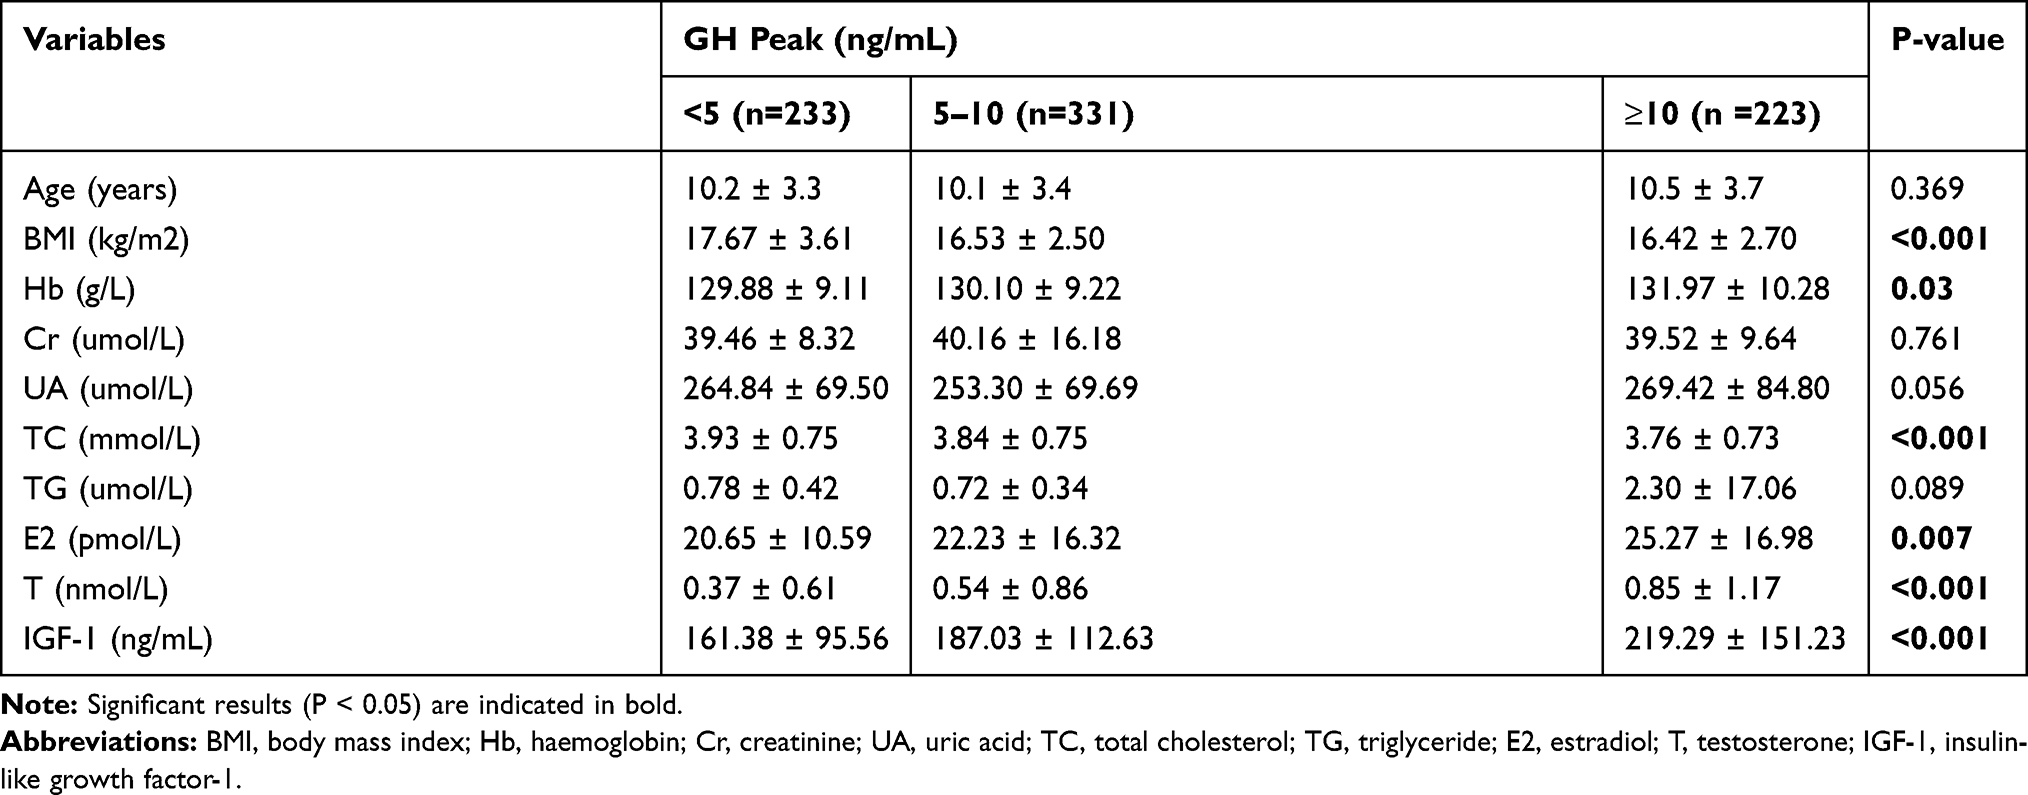 |
Table 2 Baseline Characteristics of Participants |
Correlations Between GH Peak and Anthropometrical and Biochemical Variables
The univariate analysis results of GH peak and all tested variables are shown in Table 3. BMI SDS (β −0.94; 95% CI −1.28, −0.61; P<0.001) and TC (β −0.69; 95% CI −1.22, −0.16; P=0.011) were negatively associated with GH peak. In contrast, univariate analysis showed that Hb (β 0.07; 95% CI 0.03, 0.11; P=0.001), TG (β 0.05; 95% CI 0.01, 0.10; P=0.019), E2 (β 0.06; 95% CI 0.03, 0.08; P<0.001), and T (β 1.59; 95% CI 1.16, 2.03; P<0.001) were positively correlated with GH peak, which means when Hb increased by 1 g/L, GH peak increased by 0.07 ng/mL. There was no significant correlation between GH peak and sex, or BUN.
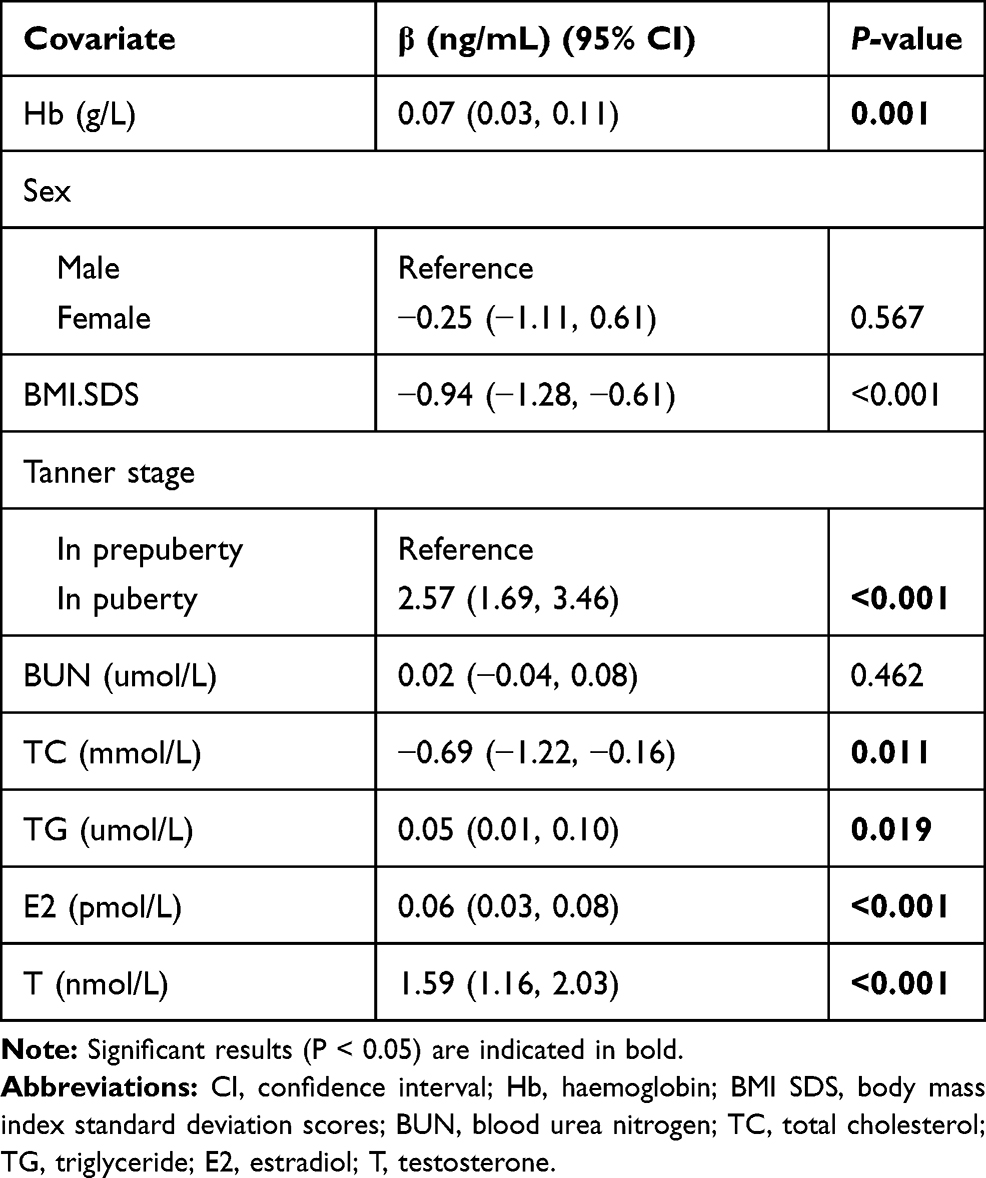 |
Table 3 Correlation Between GH Peak Level and Different Variables |
Non-Linear Relationship Between Hb and GH Peak
In the present study, smooth curve fitting showed a non-linear relationship between Hb and GH peaks after adjusting for age, sex, height SDS, BMI SDS, UA, TC, TG, Cr, E2, T, and Tanner stage (Figure 1). There were a two-stage change and one inflection point in this curve. When the Hb level was greater than the breakpoint, there was a positive relationship between Hb and GH peaks; however, if the value was less than the breakpoint, there was a negative relationship between Hb and GH peaks. Next, threshold saturation based on the curve fitting was analysed (Table 4), and we calculated the inflection point as 123 g/L. On the left side of the inflection point, the curve appeared to have a downward trend (β −0.12; 95% CI −0.30, 0.06; P=0.1867); however, there was no statistical significance. On the right side of the inflection point, GH peak increased with Hb elevation (β 0.08; 95% CI 0.01, 0.14; P=0.0207), which means when Hb was more than 123g/L, GH peak increased by 0.08 ng/mL for each increased unit of Hb.
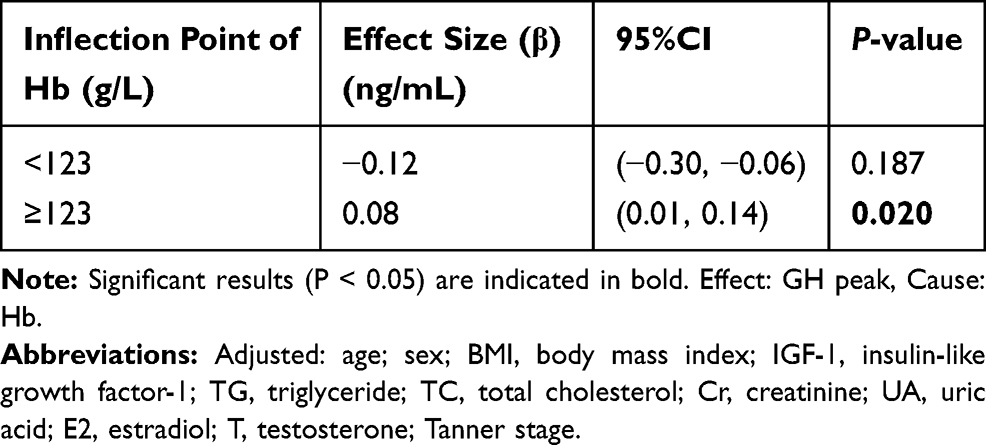 |
Table 4 The Independent Correlation Between Hb and GH Peak by Multivariate Piecewise Linear Regression |
Discussion
This cross-sectional study included a total of 787 children and adolescents with short stature. The univariate analysis results showed that Hb was positively associated with GH peak (β 0.07, P=0.001). Other variables which are significant associated with GH peak were BMI SDS (β −0.94; 95% CI −1.28, −0.61; P<0.001), TC (β −0.69; 95% CI −1.22, −0.16; P=0.011), TG (β 0.05; 95% CI 0.01, 0.10; P=0.019), E2 (β 0.06; 95% CI 0.03, 0.08; P<0.001), and T (β 1.59; 95% CI 1.16, 2.03; P<0.001), which means when TG increased by 1 umol/L, GH peak increased by 0.05 ng/mL, when E2 increased by 1 pmol/L, GH peak increased by 0.06 ng/mL, when T increased by 1 nmol/L, GH peak increased by 1.59 ng/mL; and when BMI SDS increased by 1 unit, GH peak decreased by 0.94 ng/mL, when TC increased by 1 mmol/L, GH peak decreased by 0.69 ng/mL; Furthermore, a non-linear relationship was detected between Hb and GH peaks through smooth curve fitting, and the breakpoint was 123 g/L after multivariate piecewise linear regression analysis. A positive relationship between Hb and GH peaks was significant only when Hb levels reached this point.
GH regulates human growth and development through the GH/IGF axis, and GH levels reflect the nutritional status of the human body. GH stimulates the production of IGF-1,29 and IGF-1 concentration is sensitive to short-term and long-term changes in nutritional status. Nutritional status can interact with multiple points on the GH/IGF-1 axis, including hormone secretion and GH signaling.30 A few studies showed that low IGF-1 concentrations exist in children with malnutrition or transient nutritional restriction.31–33 Besides the effect of IGF-1 on erythropoiesis mentioned in the introduction, the stimulating effect of GH can also be explained by anabolism. In fact, GH increases oxygen transportation and Hb levels by promoting oxygen transport to peripheral tissues.34
Our study found Hb levels are associated with GH peak. Previous literature has explored the Hb levels both in GHD children and adults after GH treatment. Ardizzi et al showed that Hb increased significantly in eight patients with GHD after GH treatment for 9 months and they speculated that GH would also seem to stimulate erythropoiesis in vivo.35 More recently, Eugster et al, with a sample size of 100 participants, suggested that low Hb levels are associated with idiopathic GHD in children.14 Similar findings were also reported in another study, which reported that GH treatment can increase Hb levels in children with GHD after 5 years of follow-up.36 Further, Ciresi et al showed that Hb level in 255 children with GHD was significantly correlated with the GH peak after stimulation test at baseline.15 A similar conclusion was also drawn in adults with GHD. Ten Have et al demonstrated a significant increase in Hb levels after 120 weeks of GH replacement therapy in 17 adults with GHD.37 These conclusions are consistent with our findings.
Interestingly, unlike previous studies, we found a non-linear relationship between Hb and GH peaks. Through the threshold effect analysis, we found the inflection point of Hb to be 123 g/L, and if the Hb value was less than this inflection point, the correlation between Hb and GH peaks was not statistically significant. This study found that, after the inflection point of 123 g/L, GH peak increased as Hb levels rose. As for why we came to a different conclusion from previous literature, we speculate that racial heterogeneity and different adjustment confounding factors may also contribute to this difference. Our study was based on children and adolescents with short stature, so we should extend our conclusions carefully to other groups with different characteristics. Further studies are needed to confirm the underlying mechanism of the nonlinear relationship between Hb and GH peak levels in children and adolescents with short stature and provide clinical evidence for the importance of the Hb levels in the diagnosis and treatment of short stature.
There are some limitations of this study. First, we could not determine causality due to the cross-sectional study design. Second, the study was conducted in a homogeneous population of Chinese children and adolescents with short stature, so our results could not be extrapolated to other groups. Third, there are many factors that affect the level of Hb, such as diet and nutritional status. In the future, we intend to use dietary and exercise questionnaires to better assess the nutritional status of children and adolescents with short stature.
Conclusion
In children and adolescents with short stature, we found GH peak was positively associated with the rise of Hb level when the Hb level reached the inflection point. Further studies are needed to confirm the underlying mechanism of the nonlinear relationship between Hb and GH peak levels in children and adolescents with short stature.
Abbreviations
Hb, hemoglobin; GH, growth hormone; Height SDS, height standard deviation scores; BMI, body mass index; BMI SDS, body mass index standard deviation scores; IGF-1, insulin-like growth factor-1; IGF-1 SDS, insulin-like growth factor-1 standard deviation scores; IGFBP-3, insulin-like growth factor-binding protein-3; GHD, growth hormone deficiency; ALT, alanine aminotransferase; AST, aspartate transaminase; Cr, creatinine; BUN, blood urea nitrogen; UA, uric acid; TG, triglyceride; TC, total cholesterol; HDL-C, high-density lipoprotein cholesterol; LDL-C, low-density lipoprotein cholesterol; E2, Estradiol; T, Testosterone; FBG, fasting blood glucose.
Data Sharing Statement
The datasets used and/or analysed in the current study are available from the corresponding authors upon reasonable request.
Ethics Approval and Consent to Participate
Human Research Committee Affiliated Hospital of Jining Medical University approved the study (No.2019-JYFY-10). All procedures were performed in accordance with ethical standards laid out in the Declaration of Helsinki. All of the families of the patients were informed of the aims of the study, and written informed consent was obtained from the parents of the patients.
Consent for Publication
All authors have read and approved the content, and they agree to submit it for consideration for publication in the journal.
Acknowledgments
The authors thank all the staff members in our institution. This manuscript has been made available as a preprint (https://www.researchsquare.com/article/rs-10727/v1) DOI:10.21203/rs.2.20115/v1.
Funding
This research was supported by the Jining Science and Technology Bureau (NO. 2017SMNS007).
Disclosure
The authors declare that they have no conflicts of interest.
References
1. Quitmann JH, Bullinger M, Sommer R, et al. Associations between psychological problems and quality of life in pediatric short stature from patients’ and parents’ perspectives. PLoS One. 2016;11(4):e153953. doi:10.1371/journal.pone.0153953.
2. Shapiro L, Chatterjee S, Ramadan DG, et al. Whole-exome sequencing gives additional benefits compared to candidate gene sequencing in the molecular diagnosis of children with growth hormone or IGF-1 insensitivity. Eur J Endocrinol. 2017;177(6):485–501. doi:10.1530/EJE-17-0453
3. Batey L, Moon JE, Yu Y, et al. A novel deletion of IGF1 in a patient with idiopathic short stature provides insight into IGF1 haploinsufficiency. J Clin Endocrinol Metab. 2014;99(1):E153–E159. doi:10.1210/jc.2013-3106
4. Blair JC, Savage MO. The GH-IGF-I axis in children with idiopathic short stature. Trends Endocrinol Metab. 2002;13(8):325–330. doi:10.1016/s1043-2760(02)00631-8
5. Niemczyk S, Sikorska H, Wiecek A, et al. A super-agonist of growth hormone-releasing hormone causes rapid improvement of nutritional status in patients with chronic kidney disease. Kidney Int. 2010;77(5):450–458. doi:10.1038/ki.2009.480.
6. Dinleyici EC, Kilic Z, Buyukkaragoz B, et al. Serum IGF-1, IGFBP-3 and growth hormone levels in children with congenital heart disease: relationship with nutritional status, cyanosis and left ventricular functions. Neuro Endocrinol Lett. 2007;28(3):279–283.
7. Decourtye L, Clemessy M, Mire E, et al. Impact of insulin on primary arcuate neurons culture is dependent on early-postnatal nutritional status and neuronal subpopulation. PLoS One. 2018;13(2):e193196. doi:10.1371/journal.pone.0193196
8. Javed MT, Nagra ZM, Bhatti N, et al. Effects of diet on body weight, haemoglobin, serum proteins and trace elements in burned children. J Coll Physicians Surg Pak. 2003;13(10):592–595. doi:10.2003/JCPSP.592595
9. Cowin I, Emond A, Emmett P. Association between composition of the diet and haemoglobin and ferritin levels in 18-month-old children. Eur J Clin Nutr. 2001;55(4):278–286. doi:10.1038/sj.ejcn.1601155
10. Mohammed SH, Esmaillzadeh A. The relationships among iron supplement use, Hb concentration and linear growth in young children: Ethiopian demographic and health survey. Br J Nutr. 2017;118(9):730–736. doi:10.1017/S0007114517002677
11. Choy CC, Desai MM, Park JJ, et al. Child, maternal and household-level correlates of nutritional status: a cross-sectional study among young Samoan children. Public Health Nutr. 2017;20(7):1235–1247. doi:10.1017/S1368980016003499
12. Allali S, Brousse V, Sacri AS, et al. Anemia in children: prevalence, causes, diagnostic work-up, and long-term consequences. Expert Rev Hematol. 2017;10(11):1023–1028. doi:10.1080/17474086.2017.1354696
13. Soliman AT, Al Dabbagh MM, Habboub AH, et al. Linear growth in children with iron deficiency anemia before and after treatment. J Trop Pediatr. 2009;55(5):324–327. doi:10.1093/tropej/fmp011
14. Eugster EA, Fisch M, Walvoord EC, et al. Low hemoglobin levels in children with in idiopathic growth hormone deficiency. Endocrine. 2002;18(2):135–136. doi:10.1385/ENDO:18:2:135
15. Ciresi A, Piazza G, Radellini S, et al. Growth hormone and hematopoiesis: a retrospective analysis on a large cohort of children with growth hormone deficiency. Growth Horm IGF Res. 2018;42–43:8–13. doi:10.1016/j.ghir.2018.07.005
16. Tsunawaki T, Sakai K, Momomura M, et al. Hypoxia alters phosphorylation status of insulin-like growth factor (IGF)-binding protein-1 and attenuates biological activities of IGF-I in HepG2 cell culturesJ]. J Obstet Gynaecol Res. 2013;39(9):1367–1373. doi:10.1111/jog.12078
17. Kajimura S, Aida K, Duan C. Insulin-like growth factor-binding protein-1 (IGFBP-1) mediates hypoxia-induced embryonic growth and developmental retardation. Proc Natl Acad Sci U S A. 2005;102(4):1240–1245. doi:10.1073/pnas.0407443102
18. Ceppi A, Blum JW. Effects of growth hormone on growth performance, haematology, metabolites and hormones in iron-deficient veal calves. Zentralbl Veterinarmed A. 1994;41(6):443–458. doi:10.1111/j.1439-0442.1994.tb00111.x
19. Merchav S, Tatarsky I, Hochberg Z. Enhancement of erythropoiesis in vitro by human growth hormone is mediated by insulin-like growth factor I. Br J Haematol. 1988;70(3):267–271. doi:10.1111/j.1365-2141.1988.tb02480.x
20. MP K, Stecewicz I, Piecyk K, et al. Effects of growth hormone therapeutic supplementation on hematopoietic stem/progenitor cells in children with growth hormone deficiency: focus on proliferation and differentiation capabilities. Endocrine. 2015;50(1):162–175. doi:10.1007/s12020-015-0591-0
21. Polychronakos C, Guyda HJ, Posner BI. Receptors for the insulin-like growth factors on human erythrocytes. J Clin Endocrinol Metab. 1983;57(2):436–438. doi:10.1210/jcem-57-2-436
22. Correa PN, Axelrad AA. Production of erythropoietic bursts by progenitor cells from adult human peripheral blood in an improved serum-free medium: role of insulinlike growth factor 1. Blood. 1991;78(11):2823–2833. doi:10.1182/blood.V78.11.2823.2823
23. van Vught AJ, Nieuwenhuizen AG, Gerver WJ, et al. Pharmacological and physiological growth hormone stimulation tests to predict successful GH therapy in children. J Pediatr Endocrinol Metab. 2009;22(8):679–694. doi:10.1515/jpem.2009.22.8.679
24. Li H, Ji CY, Zong XN, et al. [Height and weight standardized growth charts for Chinese children and adolescents aged 0 to 18 years]. Zhonghua Er Ke Za Zhi. 2009;47(7):487–492. Chinese.
25. Tanner JM, Whitehouse RH. Clinical longitudinal standards for height, weight, height velocity, weight velocity, and stages of puberty. Arch Dis Child. 1976;51(3):170–179. doi:10.1136/adc.51.3.170
26. Marshall WA, Tanner JM. Variations in the pattern of pubertal changes in boys. Arch Dis Child. 1970;45(239):13–23. doi:10.1136/adc.45.239.13
27. Marshall WA, Tanner JM. Variations in pattern of pubertal changes in girls. Arch Dis Child. 1969;44(235):291–303. doi:10.1136/adc.44.235.291
28. Marshall WA, Tanner JM. Growth and physiological development during adolescence. Annu Rev Med. 1968;19:283–300. doi:10.1146/annurev.me.19.020168.001435
29. Grimberg A, DiVall SA, Polychronakos C, et al. Guidelines for growth hormone and insulin-like growth factor-i treatment in children and adolescents: growth hormone deficiency, idiopathic short stature, and primary insulin-like growth factor-I deficiency. Horm Res Paediatr. 2016;86(6):361–397. doi:10.1159/000452150
30. Bergan-Roller HE, Sheridan MA. The growth hormone signaling system: insights into coordinating the anabolic and catabolic actions of growth hormone. Gen Comp Endocrinol. 2018;258:119–133. doi:10.1016/j.ygcen.2017.07.028
31. Lu Y, Bradley JS, McCoski SR, et al. Reduced skeletal muscle fiber size following caloric restriction is associated with calpain-mediated proteolysis and attenuation of IGF-1 signaling. Am J Physiol Regul Integr Comp Physiol. 2017;312(5):R806–R815. doi:10.1152/ajpregu.00400.2016
32. Adiyaman P, Ocal G, Berberoglu M, et al. Alterations in serum growth hormone (GH)/GH dependent ternary complex components (IGF-I, IGFBP-3, ALS, IGF-I/IGFBP-3 molar ratio) and the influence of these alterations on growth pattern in female rhythmic gymnasts. J Pediatr Endocrinol Metab. 2004;17(6):895–903. doi:10.1515/jpem.2004.17.6.895
33. Smith WJ, Underwood LE, Clemmons DR. Effects of caloric or protein restriction on insulin-like growth factor-I (IGF-I) and IGF-binding proteins in children and adults. J Clin Endocrinol Metab. 1995;80(2):443–449. doi:10.1210/jcem.80.2.7531712
34. Jepson JH, McGarry EE. Hemopoiesis in pituitary dwarfs treated with human growth hormone and testosterone. Blood. 1972;39(2):229–248. doi:10.1182/blood.V39.2.238.238
35. Ardizzi A, Guzzaloni G, Grugni G, et al. [The effect of GH on erythropoiesis in vivo]. Minerva Endocrinol. 1993;18(2):83–85. Italian.
36. Esposito A, Capalbo D, De Martino L, et al. Long-term effects of growth hormone (GH) replacement therapy on hematopoiesis in a large cohort of children with GH deficiency. Endocrine. 2016;53(1):192–198. doi:10.1007/s12020-015-0781-9
37. Ten HS, van der Lely AJ, Lamberts SW. Increase in haemoglobin concentrations in growth hormone deficient adults during human recombinant growth hormone replacement therapy. Clin Endocrinol (Oxf). 1997;47(5):565–570. doi:10.1046/j.1365-2265.1997.3241124.x
 © 2021 The Author(s). This work is published and licensed by Dove Medical Press Limited. The
full terms of this license are available at https://www.dovepress.com/terms
and incorporate the Creative Commons Attribution
- Non Commercial (unported, 3.0) License.
By accessing the work you hereby accept the Terms. Non-commercial uses of the work are permitted
without any further permission from Dove Medical Press Limited, provided the work is properly
attributed. For permission for commercial use of this work, please see paragraphs 4.2 and 5 of our Terms.
© 2021 The Author(s). This work is published and licensed by Dove Medical Press Limited. The
full terms of this license are available at https://www.dovepress.com/terms
and incorporate the Creative Commons Attribution
- Non Commercial (unported, 3.0) License.
By accessing the work you hereby accept the Terms. Non-commercial uses of the work are permitted
without any further permission from Dove Medical Press Limited, provided the work is properly
attributed. For permission for commercial use of this work, please see paragraphs 4.2 and 5 of our Terms.