Back to Journals » International Journal of General Medicine » Volume 14
Association Between HDL-C and Bone Mineral Density: An Cross-Sectional Analysis
Authors Niu P, Li H, Liu D, Zhang YF, Liu Y, Liang C
Received 19 August 2021
Accepted for publication 20 October 2021
Published 26 November 2021 Volume 2021:14 Pages 8863—8872
DOI https://doi.org/10.2147/IJGM.S334972
Checked for plagiarism Yes
Review by Single anonymous peer review
Peer reviewer comments 3
Editor who approved publication: Dr Scott Fraser
Peng Niu,1 Haibo Li,2 Dejun Liu,2 Yan Feng Zhang,1 YongXi Liu,1 Cheng Liang3
1Department of Spine and Joint Surgery, Second General Hospital of Nanyang, Nanyang City, 473009, Henan Province, People’s Republic of China; 2China Department of Orthopaedics, People’s Hospital of Xuecheng, Zaozhuang City, 277000, Shandong Province, People’s Republic of China; 3The Orthopaedic Center of Joint and Trauma Surgery, The Affiliated Hiser Hospital of Qingdao University, Qingdao City, Shandong Province, 266000, People’s Republic of China
Correspondence: Cheng Liang Tel +86 15589897463
Email [email protected]
Background: Dyslipidemia has been found to contribute to increased risk of osteoporosis and its association with bone mineral density (BMD) remains controversial. We determined whether blood lipid levels are linked with change of BMD.
Methods: In a large sample from the MIDUS II study, we sought to evaluate the relationship between blood lipid levels and BMD. Multivariate linear regression models and smooth curve analysis were constructed by controlling a great range of confounding factors.
Results: The median age of them was 52.5 years, and the number of males was 176 (40%). Univariate analysis showed that blood high-density lipoprotein-cholesterol (HDL-C) level was negatively related to lunar total femur (r = − 0.266, P < 0.001), lunar radius ultradistal (UD) (r = − 0.297, P < 0.001), lunar radius 1/3 (r = − 0.307, P = 0.001) and femoral neck (r = − 0.172, P = 0.001). In multivariate linear analysis, except for blood triglyceride, total cholesterol and low-density lipoprotein cholesterol (LDL-C), we found that blood HDL-C level was still negatively related to lunar total femur [B = − 0.002, B 95% CI (− 0.002, − 0.001), P < 0.001], lunar radius UD [B = − 0.001, 95% CI (− 0.001, 0), P = 0.002], lunar radius 1/3 [B = − 0.001, 95% CI (− 0.001, 0), P = 0.003] and femoral neck [B = − 0.001, 95% CI (− 0.002, 0), P = 0.039] after adjustments of demographic characteristics, lifestyle, disease history were made. Furthermore, we found that age, sex, and body mass index (BMI) had modifying effects on this negative association.
Conclusion: This study confirmed the negative association between HDL-C and BMD in the observational analysis from (MIDUS) study and provides high-quality evidence that age, sex and BMI had modifying effects on this negative association.
Keywords: blood lipid, bone mineral density, osteoporosis, MIDUS II study
Introduction
Atherosclerosis and osteoporosis are important causes of cardiovascular death and complications.1,2 Emerging studies have shown a positive association of coronary artery disease with osteoporosis. Importantly, abnormal lipid metabolism is involved in the pathological progression of these two diseases.3 Low-density lipoprotein cholesterol (LDL-C) is an important and known factor for promoting atherosclerosis-related diseases. Several recent studies reported a negative causal association between LDL-C level and bone mineral density (BMD).4–7 Lipid-lowering agents increase BMD, showing a protective action on bone.4
Interestingly, many previous studies have investigated the association between LDL-C and BMD, but their results are inconsistent. The associations between LDL-C and BMD were positive,5 inverse6,7 and null.8 Inconsistent results were also confirmed on the relationship between coronary artery disease and BMD. A previous meta-analysis has also suggested that decreased BMD in the general population contributed to higher risk of developing coronary artery disease.10 Yet, another study demonstrated that one standard deviation (SD) increase of BMD contributed to an increased risk of 5% for developing coronary artery disease.11 Moreover, the subset analyses of the NHANES database showed that high-density lipoprotein cholesterol (HDL-C) is negatively correlated with BMD, suggesting that HDL-C may have potential predictive for bone loss.9 In addition, the causal relationship blood lipid and BMD is still largely unknown. These inconsistent findings may come from the inclusion for population with different age, gender, physiological state and accompanying diseases, laboratory measurements and questionnaires, and different correction method of confounding factors such as body mass index (BMI) and lifestyles.
Given the previous inconsistent results, in this study we further evaluated the association between blood lipid, including LDL-C, high-density lipoprotein cholesterol (HDL-C), total cholesterol and triglyceride, and BMD in an independent observational cohort from the Midlife in the United States (MIDUS) study. Then, we further evaluated whether the age, gender, BMI have a modifying effect on these associations between blood lipid and BMD.
Materials and Methods
Our data were obtained from MIDUS study that had already begun to implement in 1995 with more than seven thousands of non-hospitalized adults aged 25 to 75 years.12 The MIDUS 2 is first follow-up between 2004 and 2006 with about four thousands of participants13 and 1255 participants of them participated in a biomarker study.14 Each included subject in the Biomarker Project was invited and then volunteered to attend clinical research centers (University of Wisconsin, University of California-Los Angeles and Georgetown University). The traveling expenses were covered, and participation was remunerated $200 for each participant. Trained medical staff in the clinical research centers collected biological specimens, conducted a thorough physical exam and recorded medical history.14 Therefore, we have sufficient sample size including biochemical markers and BMD to analyze. For research purposes, we selected the BMD of femur (lunar total femur, lunar radius UD, lunar radius 1/3 and femoral neck) to evaluate the bone condition of each participant. Blood samples were collected and tested for many biochemical indicators, including blood lipid levels (triglycerides, total cholesterol, HDL-C and LDL-C). Except for the participants with missing data including blood lipid, BMD and other important covariates, remaining 440 participants were included in our study. Other details of the MIDUS study biomarker protocol are available elsewhere.15,16 According to the Declaration of Helsinki, this study was granted full ethical approval as part of the biomarker study of MIDUS 2. The data used within this study are publicly available through the Inter-University Consortium for Political and Social Research (ICPSR). All analyses were conducted in accordance with the preregistration.
Confounding Variables
These variables in our study were considered as covariates that were measured at clinic visit of biomarkers: age, sex (male, female), smoking (current smoker versus non-current smoker), drinking (regular drinking versus non-regular drinking), exercise (regular exercise versus non-regular exercise) and history of chronic diseases [heart disease, hypertension, transient ischemic attack (TIA) or stroke, anemia or blood disease, diabetes, emphysema/chronic obstructive pulmonary disease (COPD) and cancer].
Statistical Analysis
All statistical analyses in our study were conducted using EmpowerStats 3.0 and SPSS 26.0. Linear regression model was performed to estimate the association of blood levels of triglycerides, total cholesterol, HDL-C and LDL-C with BMD of femur [lunar total femur, lunar radius ultradistal (UD), lunar radius 1/3 and femoral neck], respectively. All confidence intervals (CI) are reporting 95% thresholds. A base-10 logarithm transformation was performed on the 4 blood lipid variables to reduce skewed distributions. Each independent variable was defined as a predictor of risk of BMD reduction. Model 1 tested the effects of age and gender collectively for BMD reduction. Model 2 included sociodemographic factors and lifestyle (age, gender, status of smoke, drink and exercise). Model 3 further included health-related confounders (disease history of heart disease, hypertension, TIA/stroke, anemia/other blood disease, diabetes, emphysema/COPD and cancer).
To further evaluate the independent association between blood lipid levels and BMD, we excluded the effect of “age”, “gender” and “BMI” by stratified analysis. Additionally, we also analyzed the association between blood lipid levels and T-score (lunar total femur, lunar femur neck and lunar radius 1/3).
Results
Epidemiological Characteristics in All Included Participants
The epidemiological characteristics of these included participants are shown in Table 1. The median age of them was 52.5 years, and the number of males was 176 (40%). The blood median levels of triglycerides, total cholesterol, HDL-C and LDL-C were 104 mg/dl, 181.5 mg/dl, 53 mg/dl and 100 mg/dl, respectively. The median BMD of lunar total femur, lunar radius UD, lunar radius 1/3 and femoral neck were 1.02 g/cm2, 0.51 g/cm2, 0.92 g/cm2 and 0.99 g/cm2, respectively. Additionally, the median T-score of lunar total femur, lunar femur neck and lunar radius 1/3 were −0.3, −0.6 and −0.1, respectively. Other information was also described in detail in Table 1.
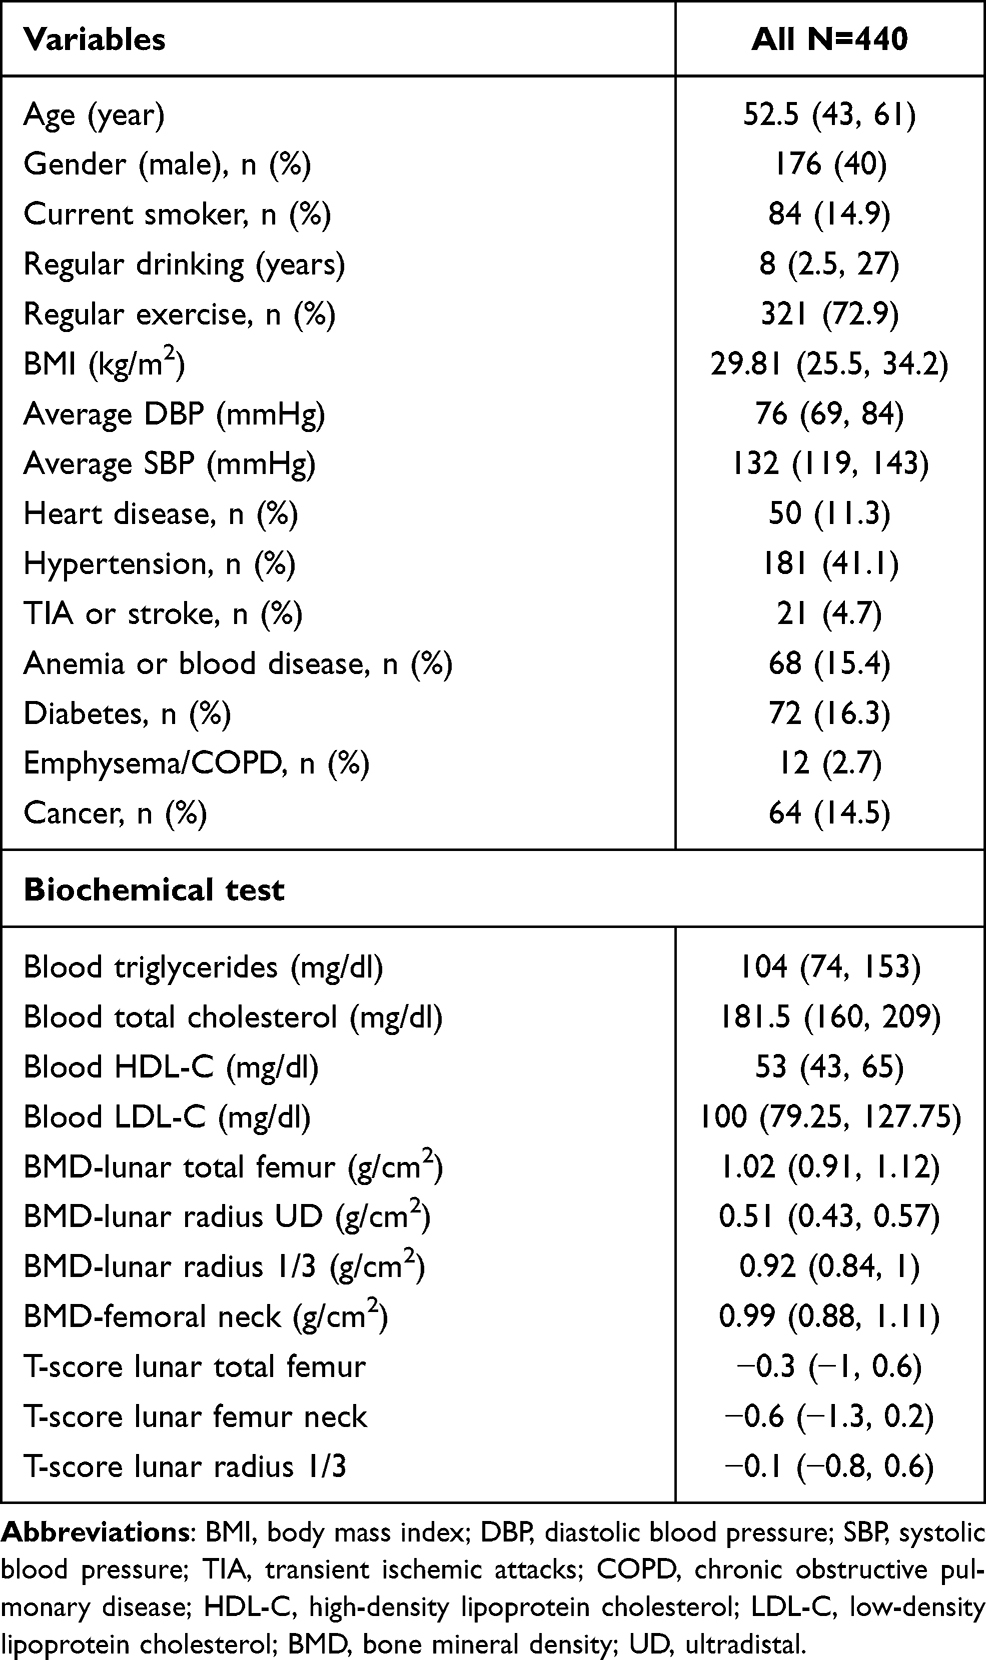 |
Table 1 Characteristics of Participants (N = 440) |
Univariate Analysis for Correlations Between Blood Lipid Levels and BMD and T-Score
In our study, blood triglyceride level was positively related to lunar total femur (r = 0.167, P < 0.001), lunar radius UD (r = 0.182, P < 0.001) and lunar radius 1/3 (r = 0.156, P = 0.001) in Table 2. Moreover, blood HDL-C level was negatively related to lunar total femur (r = −0.266, P < 0.001), lunar radius UD (r = −0.297, P < 0.001), lunar radius 1/3 (r = −0.307, P = 0.001) and femoral neck (r = −0.172, P = 0.001). Interestingly, blood total cholesterol and LDL-C levels did not have significant associations with these 4 indicators of BMD. Similarly, blood triglyceride level was also positively related to T-score for lunar total femur (r = 0.127, P = 0.008) and T-score for lunar radius 1/3 (r = 0.103, P = 0.031) in Table 3. Blood HDL-C level was also negatively related to T-score for lunar total femur (r=−0.192, P < 0.001), T-score for lunar femur neck (r = −0.135, P = 0.005) and T-score for lunar radius 1/3 (r = −0.209, P < 0.001). Blood total cholesterol and LDL-C levels did not also have significant associations with these 3 indicators of T-score.
 |
Table 2 Bivariate Correlations Using Standardized Variables (BMD, N = 440) |
 |
Table 3 Bivariate Correlations Using Standardized Variables (T-Score, N = 440) |
Multivariate Linear Regression Analysis for Correlations Between Blood Lipid Levels and BMD and T-Score
To further analyse associations between blood lipid levels and BMD and T-score, linear correction models were established. We found that blood HDL-C level was still negatively related to lunar total femur [B=−0.002, B 95% CI (−0.002, −0.001), P < 0.001], lunar radius UD [B = −0.001, 95% CI (−0.001, 0), P = 0.002], lunar radius 1/3 [B = −0.001, 95% CI (−0.001, 0), P = 0.003] and femoral neck [B = −0.001, 95% CI (−0.002, 0), P = 0.039] in Model 3 after adjustments of age, gender, status of smoke, drink and exercise, disease history of heart disease, hypertension, TIA/stroke, anemia/other blood disease, diabetes, emphysema/COPD and cancer were made (Table 4 and Figure 1). However, blood triglycerides, total cholesterol and LDL-C levels did not have significant associations with these 4 indicators of BMD in Model 3 after these same covariates were adjusted.
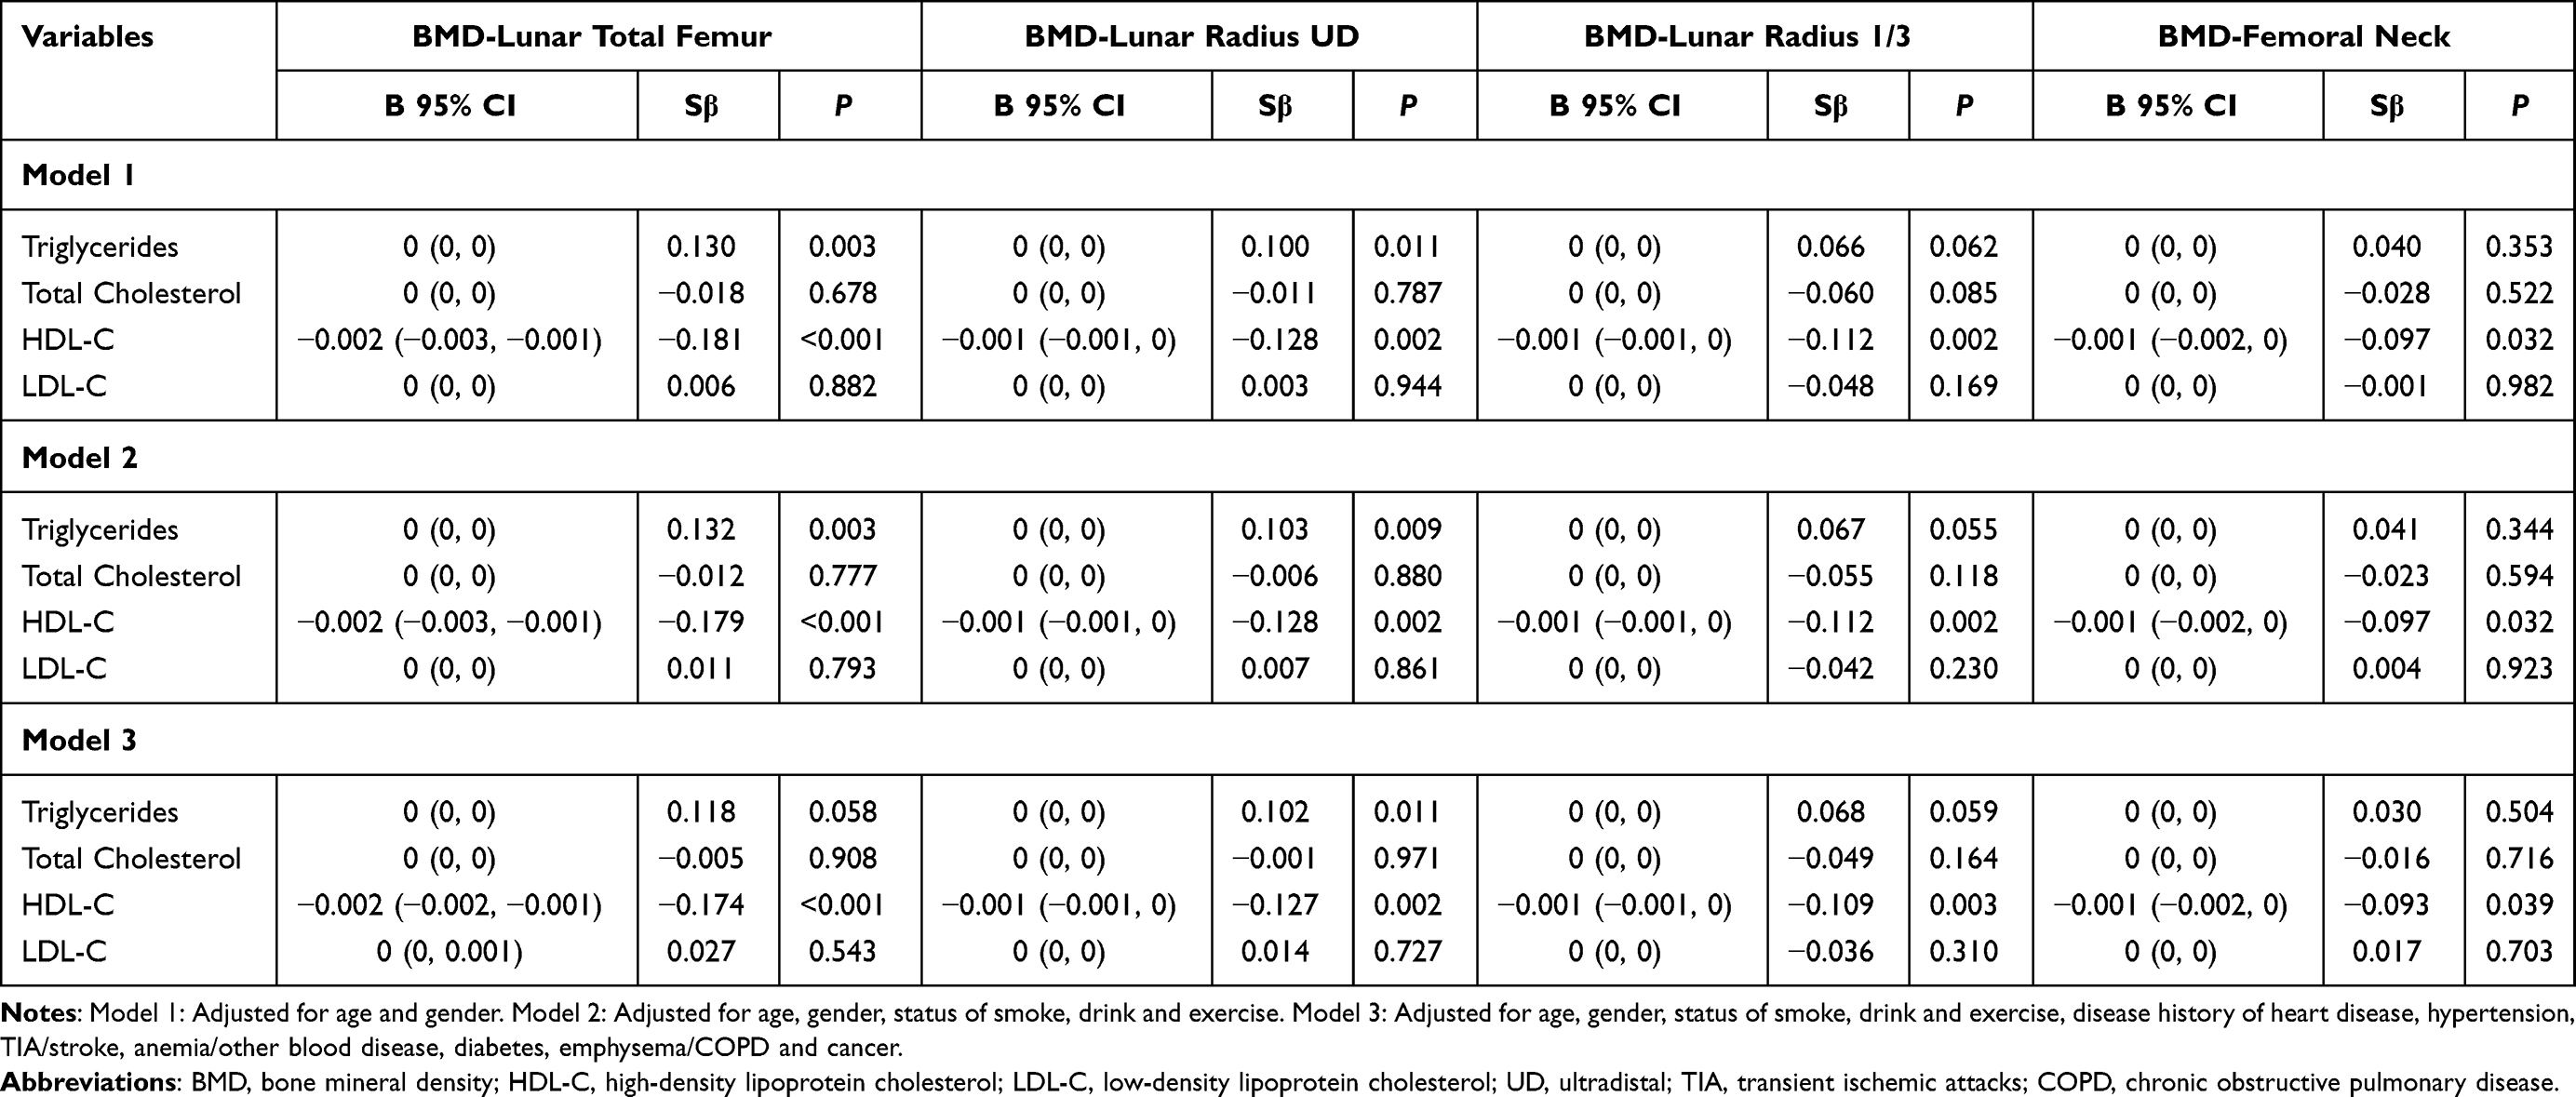 |
Table 4 Multiple Linear Regression Analysis for Relationship Between Blood Lipid Level and BMD (N = 440) |
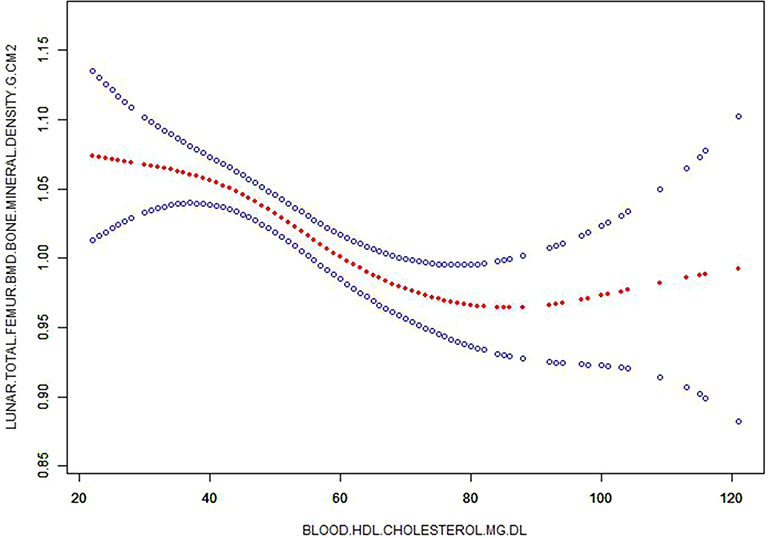 |
Figure 1 Corrected smooth curve for high density lipoprotein-cholesterol (HDL-C) and bone mineral density (BMD). |
Additionally, blood HDL-C level was still negatively associated with T-score for lunar total femur [B=−0.013, 95% CI (−0.019, −0.006), P < 0.001], T-score for lunar femur neck [B=−0.006, 95% CI (−0.012, −0.001), P = 0.032] and T-score for lunar radius 1/3 [B=−0.009, 95% CI (−0.015, −0.003), P = 0.002] in Model 3 after these similar covariates were adjusted (Table 5 and Figure 2). However, blood triglycerides, total cholesterol and LDL-C levels still had no significant associations with these 3 indicators of T-score in Model 3.
 |
Table 5 Multiple Linear Regression Analysis for Relationship Between Blood Lipid Level and T-Score (N = 440) |
 |
Figure 2 Corrected smooth curve for high density lipoprotein-cholesterol (HDL-C) and T-score. |
Analysis for Correlations Between Blood Lipid Levels and BMD and T-Score Stratified by Age, Gender and BMI
Stratified analysis, by adding “age”, “gender” and “BMI” as the covariate, was performed. Importantly, our results showed that age (≤53 years and >53 years) had a modification effect on associations between blood lipid levels and BMD and T-score (Table 6). The associations did only exist in participants with ≤53 years (all P < 0.05). Then, gender (male and female) also had a modification effect on associations, and the associations did only exist in female participants (all P < 0.05). Additionally, BMI (<28 years and ≥28) also had a modification effect on associations, and the associations did only exist in participants with BMI ≥28 (all P < 0.05).
 |
Table 6 Analysis for Correlations Between Blood HDL-C and BMD and T-Score Stratified by Age, Gender and BMI (N = 440) |
Discussion
This study confirmed the negative association between HDL-C and BMD in the observational analysis from (MIDUS) study and provides high-quality evidence that increased blood level of HDL-C was associated with decreased BMD. Total cholesterol, triglycerides and LDL-C did not have significant associations with BMD levels, respectively. Our results were not in line with previous results from epidemiological observations.5–9 Furthermore, we found that age, sex, and BMI had modifying effects on this negative association.
A large number of studies on populations with different ethnic backgrounds have suggested a close association between serum lipid profile, such as LDL-C and triglyceride, and BMD in alcoholic population or general population.5 The observation of significant associations between LDL-C and triglyceride and BMD may be accounted for several underlying mechanisms. One of possible mechanisms might be associated with metabolism of endogenous steroid hormones. Triglyceride is a major part of membrane structure and involved in the biosynthesis of various steroids such as androsterone sulfate (ATS) and dehydroi-soandrosterone sulfate (DHEA-S).17 Another possible mechanism is well-known that steroid hormones play an important role in promoting pathological development of osteoporosis. Recently, a significant relationship between lipid metabolism metabolites and hip and spine BMD was investigated.18 They found that blood levels of total cholesterol and triglyceride, as well as BMD, may be affected by serum ATS levels. However, the causal relationship between these lipid metabolism (total cholesterol and triglyceride) and BMD was not convincingly confirmed. To prove the causality, another study observed that lower triglyceride and LDL levels in postmenopausal women treated with hormone replacement therapy have higher BMD levels compared to those who did not receive the treatment.19 This suggests that there is a common cause, such as estrogen levels, causing changed level of blood lipid and BMD. Importantly, although some seemingly reasonable pathological mechanisms support this conclusion, our results were not in line with these previous results from epidemiological observations that blood levels of total cholesterol, triglycerides and LDL-C were related to BMD levels, respectively. This inconsistent result may be explained by different population selection, different research designs and the inherent shortcomings of epidemiological research. Additionally, the difference in results of blood lipid may also come from the analysis methods of different researchers. For instance, univariate analysis showed that blood triglycerides level was positively related to BMD but the significant association did not exist after correcting several mixed factors (age, gender, status of smoke, drink and exercise, disease history of heart disease, hypertension, TIA/stroke, anemia/other blood disease, diabetes, emphysema/COPD and cancer).
Many previous studies have already found the significant relationship between blood HDL levels and BMD. However, their conclusions are inconsistent that positive or negative correlations did exist.20 For example, one animal experiment showed genes predispose to both HDL-C and BMD, suggesting close association between HDL-C and BMD.20 A basic study also found a significant genetic correlation between HDL-C and BMD. Interestingly, one study from same large public datasets showed no significant genetic correlation between HDL levels and BMD levels.21 Another study also show similar results that there was no statistically significant for genetic correlation between HDL-C and lumbar spine.22 Consistent with some previous studies, however, we observed a negative association between HDL-C and BMD in data set from (MIDUS) study and provides high-quality evidence that increased blood level of HDL-C was associated with decreased BMD levels. These inconsistent conclusions may be related to the role of HDL-C in bone metabolism.23 In the future, we still need high-quality basic research to clarify the relationship between HDL-C and BMD. In addition, the difference in inconsistent association between HDL-C and BMD maybe due to that unmeasured confounding was not analyzed and/or known confounding factors are corrected differently. For example, our results showed that several important confounding factors including age, sex, and BMI had modifying effects on this negative association.
Our results have several obvious strengths. On the one hand, this is a multi-center and large-sample analysis from (MIDUS) study. Professional researchers ensure the reliability and standardization of the data. On the other hand, our study firstly confirmed HDL-C, rather than total cholesterol, triglycerides and LDL-C, has a significant association with BMD levels in the observational study and provides higher-value reference to lipid metabolism BMD for readers. Furthermore, we did observe that this negative association was modified by age, sex, and BMI. Certainly, this study also has several limitations. First, although many various confounding factors were adjusted in our study, which may be the most important factor of influencing blood lipids and BMD levels, some unknown confoundings cannot be fully eliminated because other determinants of blood lipids or BMD are known currently. Second, the blood lipid level changes dynamically and is affected by the physiological state of the human body. Our blood lipid levels were measured only one time in each participant, which may lead to the deviation of the participant’s actual values of blood lipid. Third, using many various covariates in our multivariate analysis may cause overfitting the model, leading bias of results. Fourth, we did not carry a mechanism research to further investigate the mechanisms on negative association of blood LDL-C with BMD. Fifth, we did not analyze spinal BMD, which can further support the reliability of our results. Sixth, our study mainly included the white race, which limited the generalizability of our results into other races such as yellow and black. Finally, this is a cross-sectional study with no clear causality between blood LDL-C and BMD.
Conclusions
We identified that blood LDL-C levels are significantly and negatively associated with BMD in the general middle-aged population. Our study further confirmed previous findings on the association between blood lipid levels and BMD and provides high-quality evidence that age, sex and BMI had modifying effects on this association.
Funding
There is no funding to report.
Disclosure
The authors report no conflicts of interest in this work.
References
1. Cui R, Sun SQ, Zhong N, et al. The relationship between atherosclerosis and bone mineral density in patients with type 2 diabetes depends on vascular calcifications and sex. Osteoporos Int. 2020;31(6):1135–1143. doi:10.1007/s00198-020-05374-4
2. Szekanecz Z, Raterman HG, Pethő Z, Lems WF. Common mechanisms and holistic care in atherosclerosis and osteoporosis. Arthritis Res Ther. 2019;21(1):15. doi:10.1186/s13075-018-1805-7
3. Ference BA, Ginsberg HN, Graham I, et al. Low-density lipoproteins cause atherosclerotic cardiovascular disease. 1. Evidence from genetic, epidemiologic, and clinical studies. A consensus statement from the European atherosclerosis society consensus panel. Eur Heart J. 2017;38(32):2459–2472. doi:10.1093/eurheartj/ehx144
4. Crepaldi G, Maggi S. Epidemiologic link between osteoporosis and cardiovascular disease. J Endocrinol Invest. 2009;32(4 Suppl):2–5.
5. Martín-González C, González-Reimers E, Quintero-Platt G, et al. Lipid profile and bone mineral density in heavy alcoholics. Clin Nutr. 2018;37(6Pt A):2137–2143. doi:10.1016/j.clnu.2017.10.008
6. Chen YY, Wang WW, Yang L, Chen WW, Zhang HX. Association between lipid profiles and osteoporosis in postmenopausal women: a meta-analysis. Eur Rev Med Pharmacol Sci. 2018;22(1):1–9.
7. Andersen L, Ibarra J, Andersen R. Current familial hypercholesterolemia diagnostic criteria underdiagnose APOB mutations: lessons from the Amish community. J Clin Lipidol. 2016;10(2):443–444. doi:10.1016/j.jacl.2015.11.013
8. Jeong IK, Cho SW, Kim SW, et al. Lipid profiles and bone mineral density in pre- and postmenopausal women in Korea. Calcif Tissue Int. 2010;87(6):507–512. doi:10.1007/s00223-010-9427-3
9. Tang Y, Wang S, Yi Q, Xia Y, Geng B. High-density lipoprotein cholesterol is negatively correlated with bone mineral density and has potential predictive value for bone loss. Lipids Health Dis. 2021;20(1):75. doi:10.1186/s12944-021-01497-7
10. Veronese N, Stubbs B, Crepaldi G, et al. Relationship between low bone mineral density and fractures with incident cardiovascular disease: a systematic review and meta-analysis. J Bone Miner Res. 2017;32(5):1126–1135. doi:10.1002/jbmr.3089
11. Leong A, Rehman W, Dastani Z, et al. The causal effect of vitamin D binding protein (DBP) levels on calcemic and cardiometabolic diseases: a Mendelian randomization study. PLoS Med. 2014;11(10):e1001751. doi:10.1371/journal.pmed.1001751
12. Brim OG, Baltes PB, Bumpass LL, et al. Midlife in the United States (MIDUS 1), 1995–1996 (ICPSR 2760; Version V18) [Data set]. ICPSR. 2019. doi:10.3886/ICPSR02760.v18
13. Ryff C, Almeida DM, Ayanian J, et al. Midlife in the United States (MIDUS 2), 2004–2006 (ICPSR 4652; Version V7) [Data set]. ICPSR. 2017. doi:10.3886/ICPSR04652.v7
14. Ryff CD, Seeman T, Weinstein M. Midlife in the United States (MIDUS 2): biomarker Project, 2004–2009 (ICPSR 29282; Version V9) [Data set]. ICPSR. 2019. doi:10.3886/ICPSR29282.v9
15. Dienberg Love G, Seeman TE, Weinstein M, et al. Bioindicators in the MIDUS National Study: protocol, measures, sample, and comparative context. J Aging Health. 2010;22(8):1059–1080. doi:10.1177/0898264310374355
16. Gruenewald TL, Karlamangla AS, Hu P, et al. History of socioeconomic disadvantage and allostatic load in later life. Soc Sci Med. 2012;74(1):75–83. doi:10.1016/j.socscimed.2011.09.037
17. Gelzo M, Sica C, Elce A, et al. Reduced absorption and enhanced synthesis of cholesterol in patients with cystic fibrosis: a preliminary study of plasma sterols. Clin Chem Lab Med. 2016;54(9):1461–1466. doi:10.1515/cclm-2015-1151
18. Moayyeri A, Cheung CL, Tan KC, et al. Metabolomic pathways to osteoporosis in middle-aged women: a genome-metabolome-wide Mendelian randomization study. J Bone Miner Res. 2018;33(4):643–650. doi:10.1002/jbmr.3358
19. Makovey J, Chen JS, Hayward C, Williams FM, Sambrook PN. Association between serum cholesterol and bone mineral density. Bone. 2009;44(2):208–213. doi:10.1016/j.bone.2008.09.020
20. Ackert-Bicknell CL. HDL cholesterol and bone mineral density: is there a genetic link? Bone. 2012;50(2):525–533. doi:10.1016/j.bone.2011.07.002
21. Zheng J, Erzurumluoglu AM, Elsworth BL, et al. LD Hub: a centralized database and web interface to perform LD score regression that maximizes the potential of summary level GWAS data for SNP heritability and genetic correlation analysis. Bioinformatics. 2017;33(2):272–279. doi:10.1093/bioinformatics/btw613
22. Zhang Q, Zhou J, Wang Q, et al. Association between bone mineral density and lipid profile in Chinese women. Clin Interv Aging. 2020;15(15):1649–1664. doi:10.2147/CIA.S266722
23. Hernández JL, Olmos JM, Ramos C, et al. Serum lipids and bone metabolism in Spanish men: the Camargo cohort study. Endocr J. 2010;57(1):51–60. doi:10.1507/endocrj.K09E-228
 © 2021 The Author(s). This work is published and licensed by Dove Medical Press Limited. The
full terms of this license are available at https://www.dovepress.com/terms
and incorporate the Creative Commons Attribution
- Non Commercial (unported, 3.0) License.
By accessing the work you hereby accept the Terms. Non-commercial uses of the work are permitted
without any further permission from Dove Medical Press Limited, provided the work is properly
attributed. For permission for commercial use of this work, please see paragraphs 4.2 and 5 of our Terms.
© 2021 The Author(s). This work is published and licensed by Dove Medical Press Limited. The
full terms of this license are available at https://www.dovepress.com/terms
and incorporate the Creative Commons Attribution
- Non Commercial (unported, 3.0) License.
By accessing the work you hereby accept the Terms. Non-commercial uses of the work are permitted
without any further permission from Dove Medical Press Limited, provided the work is properly
attributed. For permission for commercial use of this work, please see paragraphs 4.2 and 5 of our Terms.