Back to Journals » Diabetes, Metabolic Syndrome and Obesity » Volume 16
Association Between Different Parameters of Adipose Distribution and Transient Elastography-Assessed Hepatic Steatosis in American Adults with Diabetes, Prediabetes and Normal Glucose Tolerance
Authors Liu Y ![]() , Chai S
, Chai S ![]() , Zhang X
, Zhang X
Received 23 October 2022
Accepted for publication 22 December 2022
Published 1 February 2023 Volume 2023:16 Pages 299—308
DOI https://doi.org/10.2147/DMSO.S394564
Checked for plagiarism Yes
Review by Single anonymous peer review
Peer reviewer comments 2
Editor who approved publication: Prof. Dr. Juei-Tang Cheng
Yufang Liu, Sanbao Chai, Xiaomei Zhang
Department of Endocrinology, Peking University International Hospital, Beijing, 102206, People’s Republic of China
Correspondence: Xiaomei Zhang, Email [email protected]
Objective: To investigate the association between adipose distribution and hepatic steatosis in American adults and to assess whether this association varies among different blood glucose states.
Methods: Data from the American National Health and Nutrition Examination Survey (NHANES) 2017– 2018 were analyzed. The subjects were divided into three groups: diabetes, prediabetes and normal glucose tolerance (NGT). Hepatic steatosis was quantified by median controlled attenuation parameter (CAP), which was measured by ultrasound transient elastography. Total abdominal fat volume, visceral adipose tissue (VAT) volume, total percent fat, trunk percent fat, android percent fat and android to gynoid ratio (AGR) was measured by dual-energy X-ray absorptiometry (DXA).
Results: Data pertaining to 2986 participants (1581 with hepatic steatosis) were included in the analysis. In the NGT group, the proportion of S0 (< 5% of the hepatocytes with fatty infiltration) was 58.9%, and 25.2% for S3 (≥ 66% of the hepatocytes with fatty infiltration). In contrast, the proportion of S0 was 11.1%, while S3 accounts for as high as 68.7% in the diabetes group. In the NGT group, all parameters of fat distribution revealed a positive relation with the occurrence of hepatic steatosis (p< 0.05) except total percent fat (p=0.872) after adjusting for confounding factors. In the prediabetes group, VAT volume, trunk percent fat, android percent fat and AGR had significant influence on hepatic steatosis (p< 0.05). As for diabetes, only AGR remained significantly correlated with hepatic steatosis (p=0.004).
Conclusion: For NGT individuals, high level of total abdominal fat volume, VAT volume, trunk percent fat, android percent fat and AGR all can be used to predict hepatic steatosis. For diabetes, only AGR can predict hepatic steatosis among the surveyed parameters of adipose distribution.
Keywords: adipose distribution, hepatic steatosis, diabetes
Introduction
Obesity is one of the major contemporary public health issues. The accumulation of body adipose tissue is closely related to a number of chronic diseases, including type 2 diabetes, hypertension, and other cardiovascular diseases. Type 2 diabetes is a major worldwide health concern. An estimated 346,000,000 people are affected by type 2 diabetes across the world and the number is projected to double by 2030.1 Chronic liver disease and cirrhosis account for a significant proportion of morbidity and mortality in America.2,3 With the epidemic of obesity, non-alcoholic associated fatty liver disease (NAFLD) has become the main cause of chronic liver disease in US adults and children. Diabetes is a strong predictor for NAFLD progression, including liver cirrhosis and hepatocellular carcinoma,4 and hepatic fat accumulation has been reported to be associated with incident CVD in patients with type 2 diabetes,5 so it is important to estimate the risk of fatty liver disease among diabetes.
Total adipose tissue in human body can be classified into two types: subcutaneous adipose tissue (SAT) and internal adipose tissue. SAT consists of abdominal SAT and peripheral SAT. Internal adipose tissue is categorized as intra-abdominal adipose tissue (ie, VAT) and non-abdominal internal adipose tissue (eg, cardiac adipose tissue).6 Total adipose tissue includes both SAT and internal adipose tissue. Liver fat is a type of VAT which is categorized as internal adipose tissue.
The conventional methods for assessment of body fat distribution include anthropometric measurements [eg, body mass index (BMI), waist circumference (WC) and waist-to-hip ratio] and/or clinical tools (eg, measurement of bioelectric impedance).7 Parameters that can be detected by DXA to reflect the distribution characteristics of human body fat include, but are not limited to, total abdominal fat volume, VAT volume, total percent fat, trunk percent fat, android percent fat and AGR. Total abdominal fat volume, VAT volume and total percent fat have been confirmed to be closely related to the occurrence of metabolic diseases.
Hepatic steatosis is also essentially an accumulation of visceral fat. Several cross-sectional studies have consistently demonstrated the association between VAT area and NAFLD.8–10 There are many parameters for assessing fat distribution, and we aim to pick the most valuable one for predicting hepatic steatosis in a diabetes-specific group.
Methods
Population
Data pertaining to individuals who participated in the American NHANES 2017–2018 survey were analyzed. NHANES 2017–2018 data are publicly available and can be accessed online (https://www.cdc.gov).
Participants with missing relevant data and those who did not undergo relevant examinations were excluded from the analyses. The present analyses were limited to individuals aged ≥18 years. Participants who qualified any of the following conditions were classified as diabetic patients in this study: 1) confirmed history of diabetes based on the questionnaire data; 2) glycosylated hemoglobin (HbA1c) level ≥6.5%;11 3) fasting glucose level ≥7.0 mmol/L.11 Participants who qualified all of the following conditions were classified as NGT in this study: 1) denied history of diabetes or prediabetes based on the questionnaire data; 2) HbA1c level <5.7%;11 3) fasting glucose level <5.6 mmol/L. The remaining individuals were defined as prediabetes. Excessive drinking was defined as drinking three or more times a week. The NHANES database includes multiple races and there may be ethnic variation in body composition and fat distribution.12,13 Therefore we recorded racial information and adjusted for it in multivariate analysis.
CAP
Hepatic steatosis was quantified by CAP, which was measured by ultrasound transient elastography. CAP is measured in dB/m. The device measures the ultrasound attenuation, which reflects the presence of hepatic steatosis, and records the CAP as an indicator for fat accumulation in the liver. Elastography has been shown to be a valid method for assessment of hepatic steatosis.14–16 According to histologic findings, liver fat accumulation can be classified as absent/normal-S0 (<5% of the hepatocytes have fatty infiltration); mild-S1 (5%~33% of the hepatocytes present fatty infiltration); moderate-S2 (33–66% of the hepatocytes with fatty infiltration); severe-S3 (≥66% of the hepatocytes with fatty infiltration). In the present study, cut-off values of 248 dB/m, 268 dB/m and 280 dB/m for CAP were taken to diagnose S≥1, S≥2 and S3.17 In this study, hepatic steatosis was defined as CAP ≥248, that is S≥1.
Parameters of Adipose Distribution
In this study, total abdominal fat volume, VAT volume, total percent fat, trunk percent fat, android percent fat and AGR was measured by DXA.
The Hologic APEX software was used in the scan analysis to define the android and gynoid region. The android area, that is the lower trunk area, was bounded by two lines: the pelvic horizontal cut line as its lower side, and a line placed above the pelvic line automatically as its upper side. The upper side of the gynoid area was placed 1.5 times the height of the android region below the pelvic line and the bottom line of the gynoid was placed to make the height of the gynoid twice the height of the android (Figure 1). All above lines were automatically placed by Hologic software.
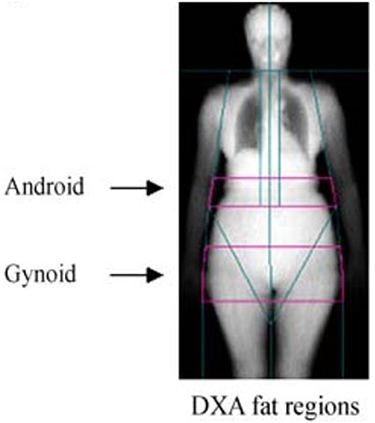 |
Figure 1 Regional body composition measurement and regions of interest (ROI) in the android and gynoid by dual-energy X-ray absorptiometry (DXA). |
Hologic APEX software was also used in the scan analysis to define VAT and SAT. Area, mass and volume of VAT inside abdominal cavity were measured at the approximate interspace location of L4 and L5 vertebra.
Statistical Analysis
The Kolmogorov–Smirnov method was used to assess the data distribution. Continuous variables are presented as mean±standard deviation for normally distributed data or median (Q1, Q3) for abnormally distributed data. To compare the differences between two groups, the Chi-square test, Mann–Whitney U-test or independent t-test was employed when appropriate. Categorical variables are presented as frequency (percentage) and between-group differences were assessed using the Chi-squared test. Where appropriate, logistic regression were performed to adjust for potential confounding variables. ORs and 95% CIs of hepatic steatosis in response to different parameters of adipose distribution across three glycemic status were estimated, and their interactions were tested. P values <0.05 were considered indicative of statistical significance. Given the high number of hypotheses being tested, we used Bonferroni correction to account for inflation of alpha error. After Bonferroni correction, p values <0.0083 were considered study-wide significant. All statistical analyses were performed using STATA 12.0.
Results
Characteristics of Study Population Disaggregated by Study Arm
Baseline characteristics of the study population are summarized in Table 1. Data pertaining to 2986 participants (1581 with hepatic steatosis) were included in the analysis. Individuals in the hepatic steatosis group were significantly older and had higher BMI, WC, systolic blood pressure (SBP), HbA1c, alanine aminotransferase (ALT), aspartate aminotransferase (AST), total triglyceride (TG), total cholesterol (TC), VAT area, VAT mass, VAT volume, total abdominal fat volume, trunk percent fat, total percent fat, android percent fat and android AGR than individuals without hepatic steatosis (p<0.001 for all). In the hepatic steatosis group, the proportion of males was higher (p<0.001), so was excessive drinking (p=0.033). There was no significant difference in serum creatinine (Scr) levels between the two groups (p=0.791).
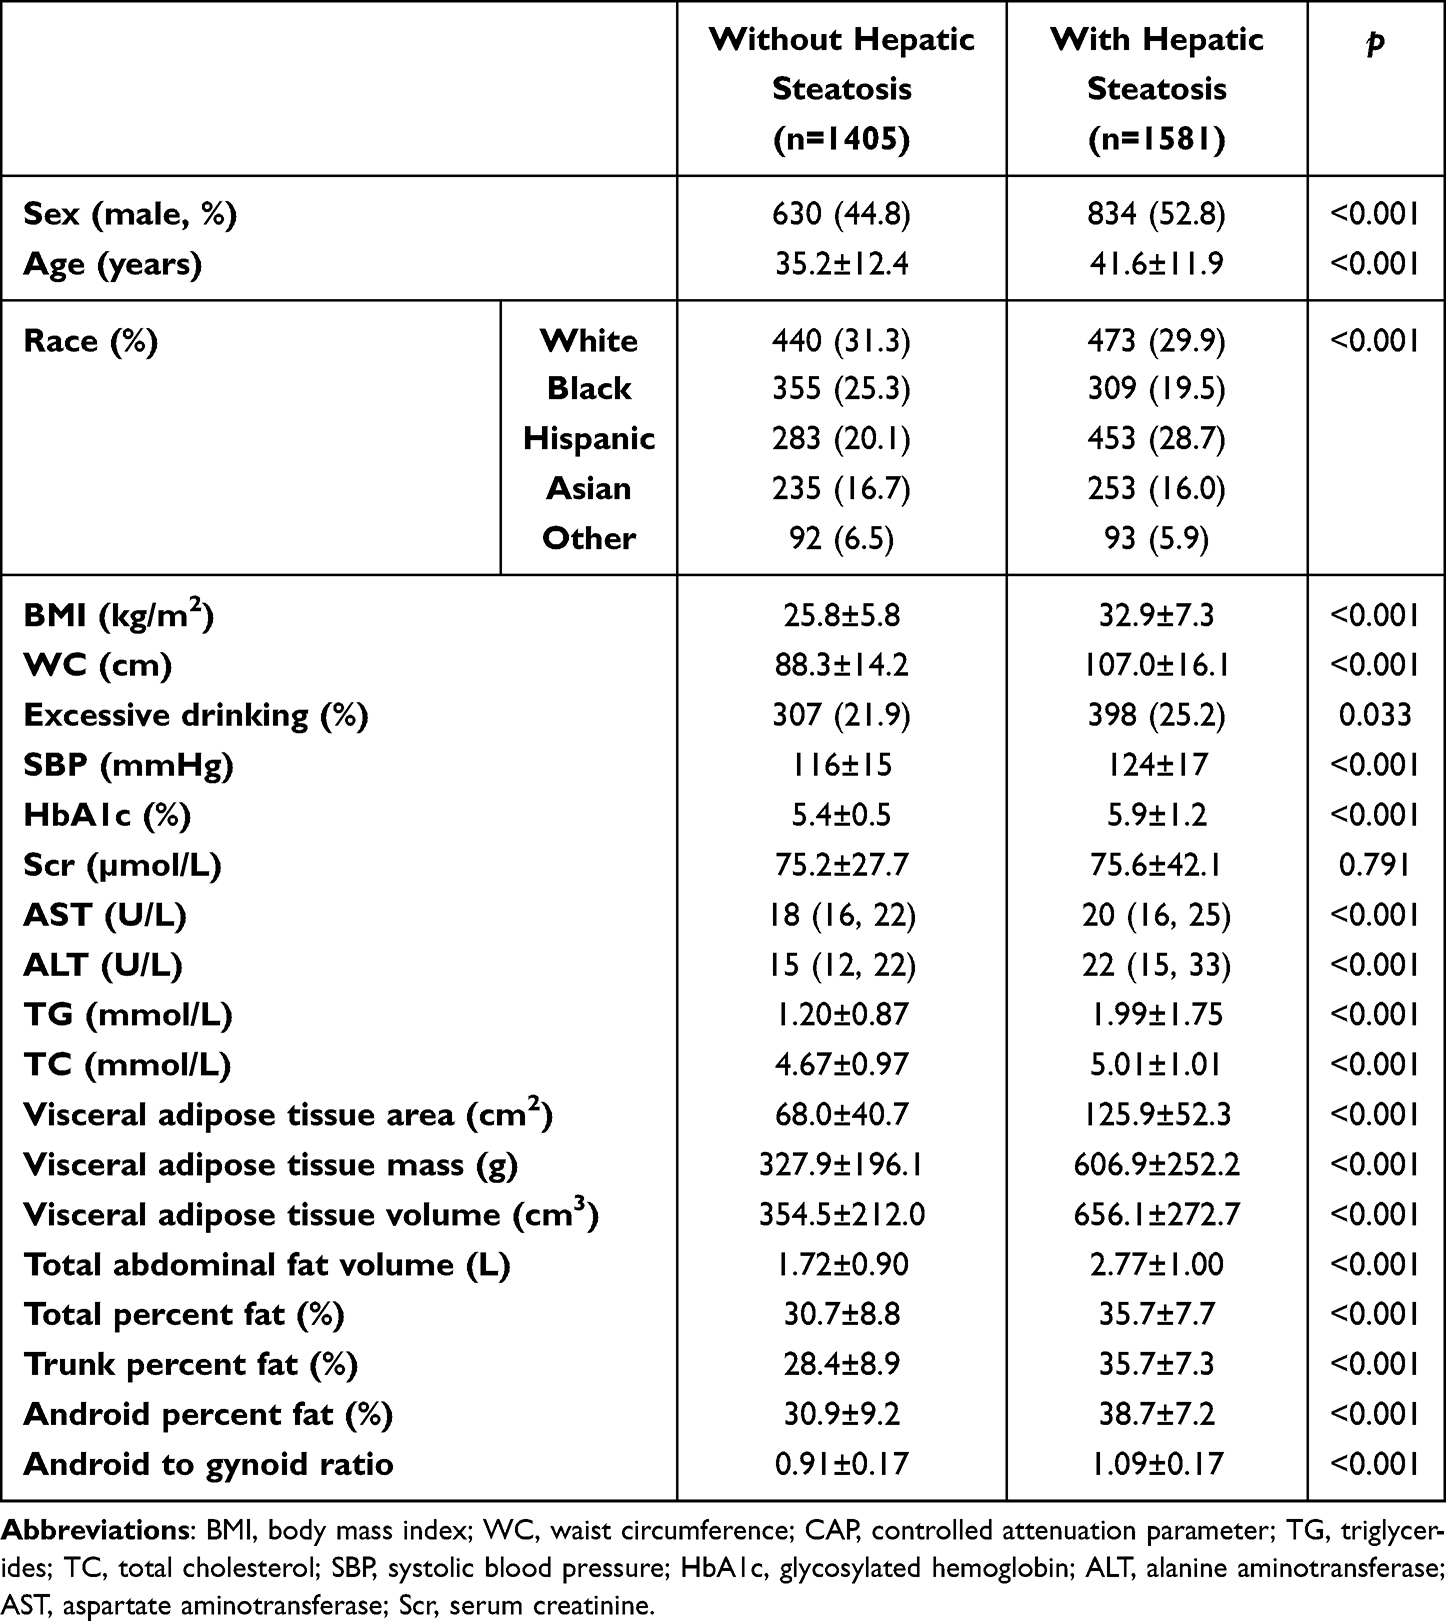 |
Table 1 Characteristics of the Study Population by CAP |
There were significant differences in the proportion of different grades of liver fat accumulation among the three groups. In the NGT group, the proportion of S0 was 58.9%, and 25.2% for S3. In contrast, the proportion of S0 was 11.1%, while S3 accounts for as high as 68.7% in diabetes group (Figure 2).
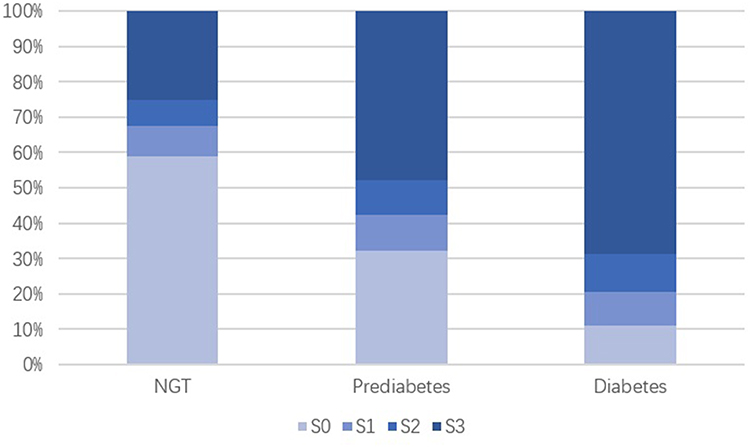 |
Figure 2 Proportion of different grades of hepatic steatosis in diabetes-specific groups. S0: normal, fatty infiltration<5%; S1: mild, 5%~33%; S2: moderate, 33%~66%; S3: severe, ≥66%. |
The CAP trends along the content of adipose tissue in NGT, prediabetes and diabetes are presented in Figure 3. The figure shows that diabetics had higher levels of CAP than their non-diabetic counterparts throughout the range of adipose content. Irrespective of the group, CAP increased with the increase in adipose content, no matter by total abdominal fat volume, VAT volume, total percent fat, trunk percent fat, android percent fat or AGR.
 |
Figure 3 Association between different parameters of adipose distribution and CAP, stratified by NGT, prediabetes and diabetes, with LOWESS smooth for trend. |
Interaction Analysis and Logistic Regression
In the test for interaction between adiposity measures and glycemic status on presence of hepatic steatosis (Table 2), there was a significant interactive effect of visceral adipose tissue volume and glycemic status on hepatic steatosis (p<0.05), which was supported by following findings (Table 3). While there was no multiplicative interaction between other parameters and glycemic status on hepatic steatosis (Table 2).
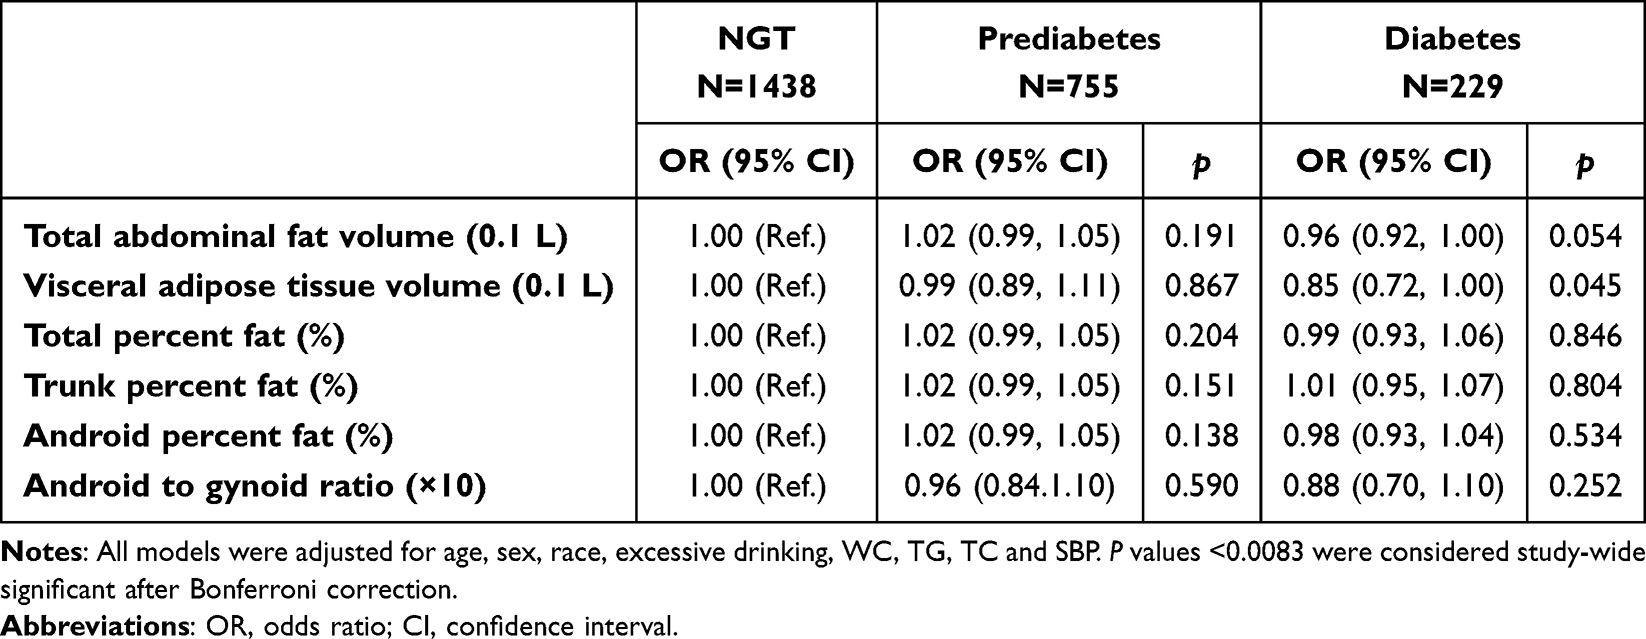 |
Table 2 Interaction Between Adiposity Measures and Glycemic Status on Presence of Hepatic Steatosis in the Overall Group |
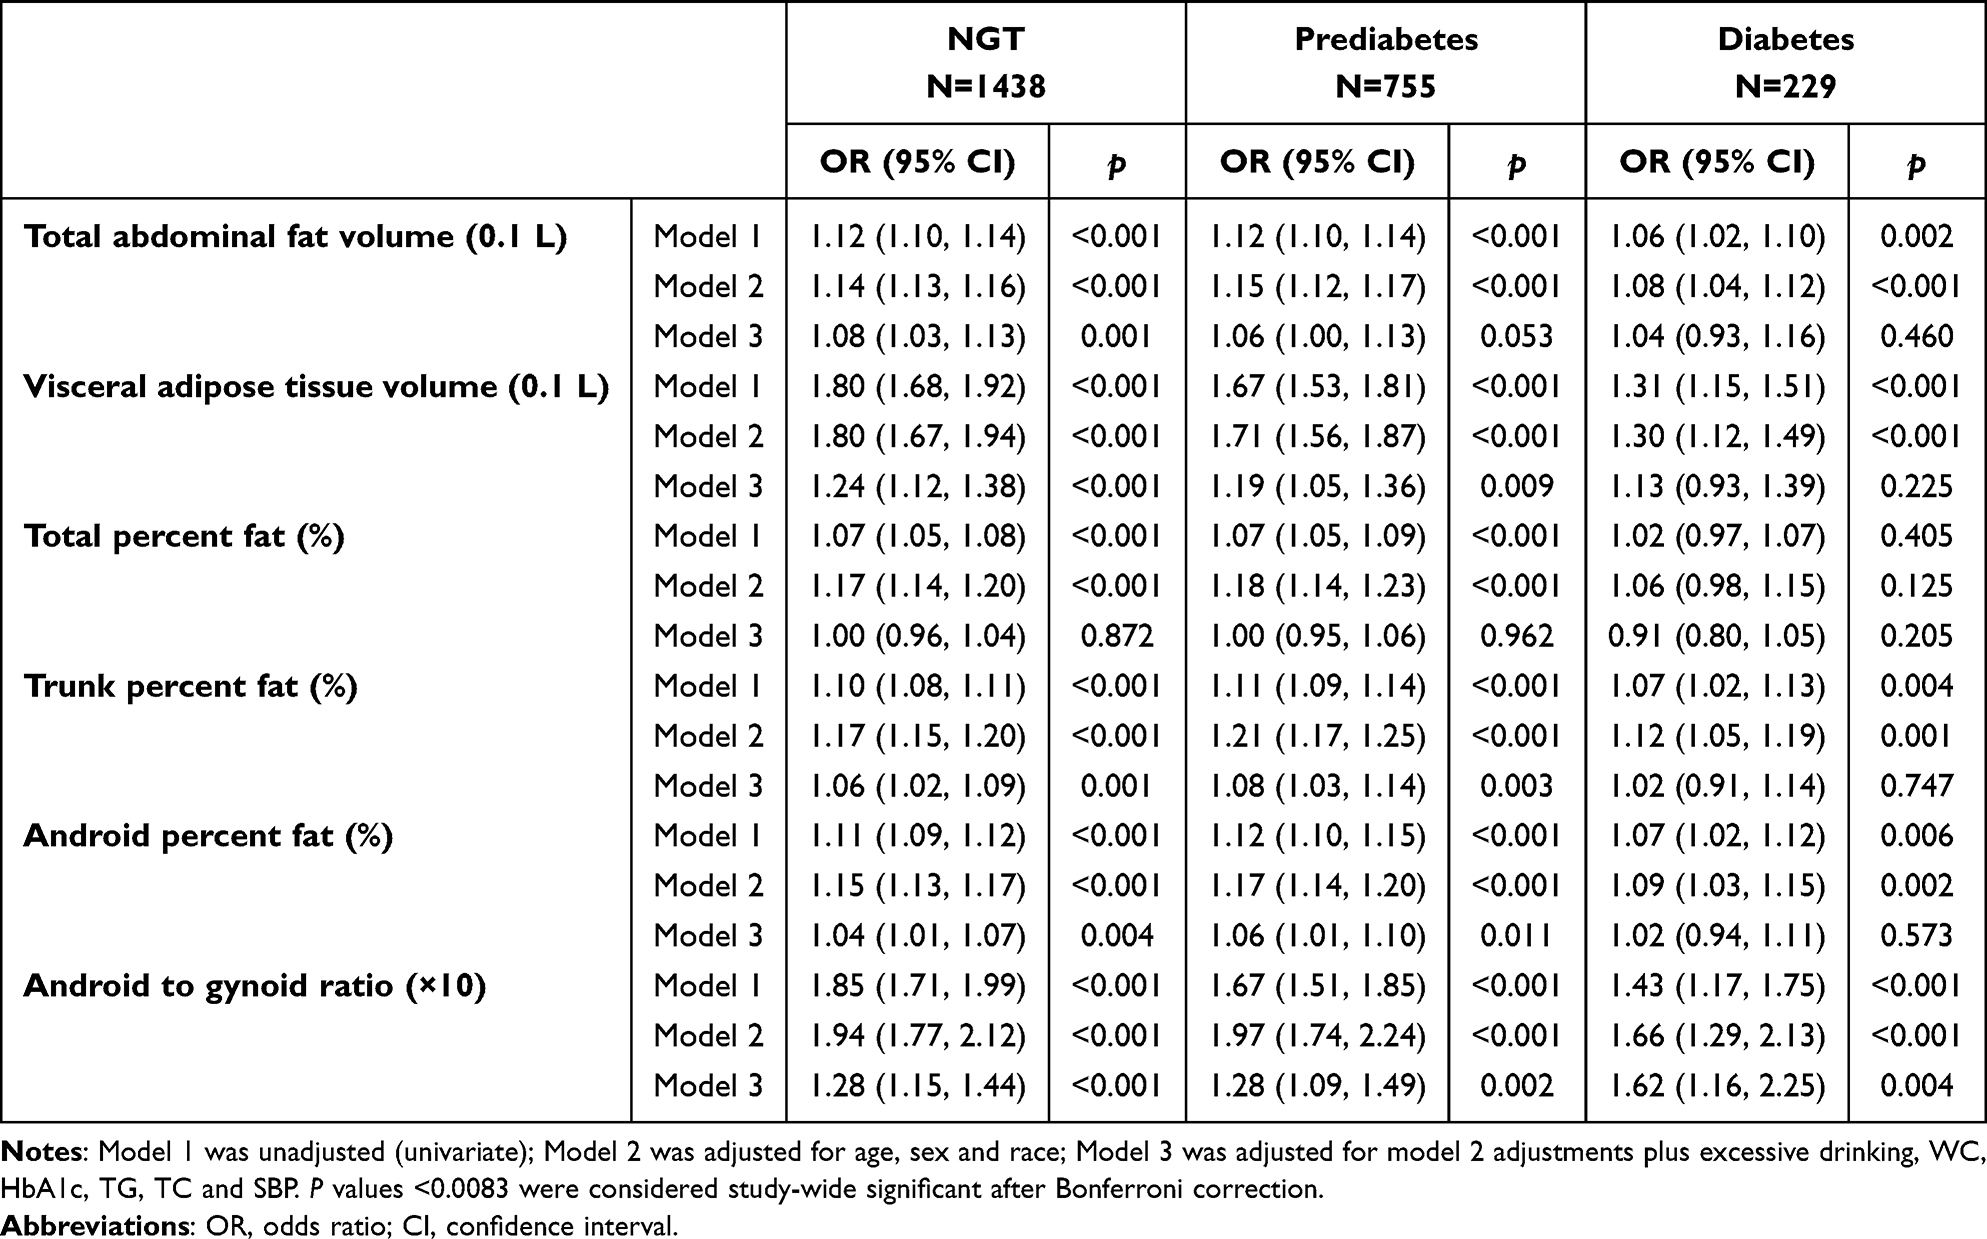 |
Table 3 Association of Prevalence of Fatty Liver Disease with Different Parameters of Adipose Distribution, Sorted by Glycemic Status |
In the NGT group, all parameters revealed a positive relation with the occurrence of hepatic steatosis (p<0.05) except total percent fat (p=0.872) after adjusting for sex, age, race, excessive drinking, WC, TG, TC, SBP and HbA1c (Table 3 and Figure 4). In the prediabetes group, after adjusting for confounding factors, VAT volume, trunk percent fat, android percent fat and AGR had significant influence on hepatic steatosis (p<0.05), while total abdominal fat volume or total percent fat were not risk factor for hepatic steatosis. As for diabetes, only AGR remained significantly correlated with hepatic steatosis (p=0.004). High AGR was a risk factor for hepatic steatosis in all three groups. After Bonferroni correction, VAT volume and android percent fat no longer had significant influence on hepatic steatosis in the prediabetes group (p>0.0083), and other results remained the same.
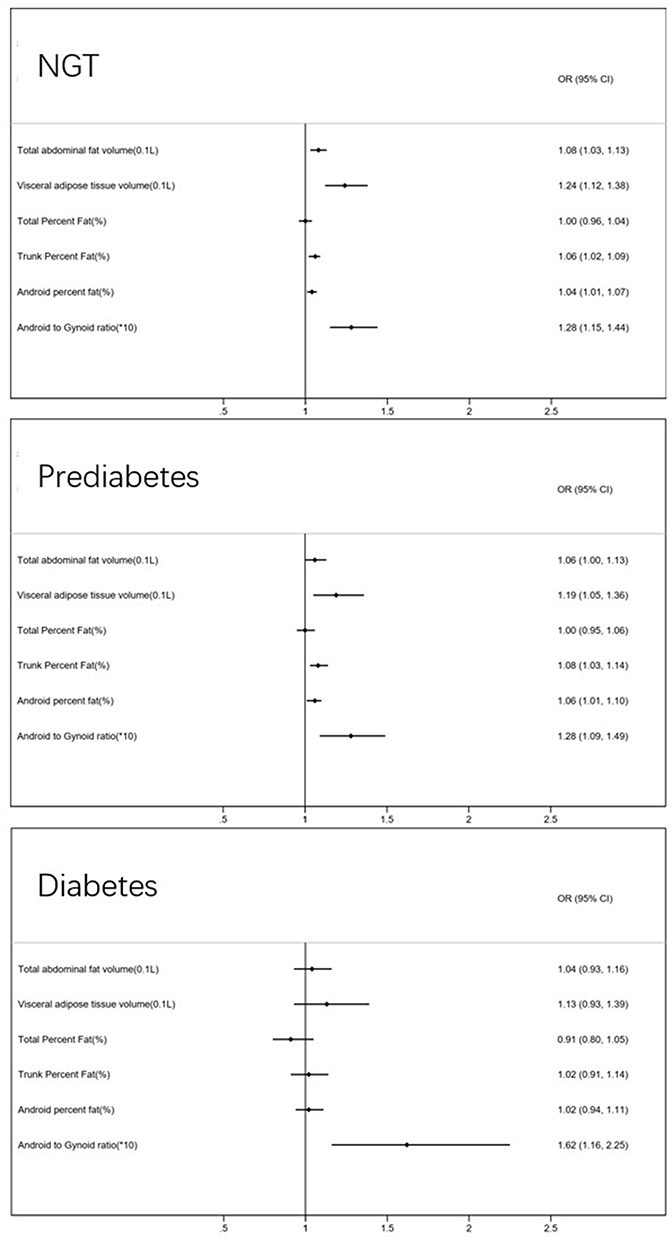 |
Figure 4 Forest plots of OR and 95% CI of different parameters on hepatic steatosis, stratified by NGT, prediabetes and diabetes. |
Discussion
In the NGT group, the degree of hepatic steatosis showed a positive correlation with adipose content (total abdominal fat volume, VAT volume, trunk percent fat, android percent fat and AGR). Increase in adipose content was associated with worsening of hepatic steatosis, which is consistent with our previous cognition. However, these relationships vanished in diabetics, except for AGR, which is consistent with previous studies.18 Even VAT volume was not associated with the occurrence of hepatic steatosis for diabetes in the present study. In fact, on the prediction of hepatic steatosis, VAT was most effected by glycemic status among all the parameters, as we can see in the interaction analysis. That means, if we use VAT to predict the presence of hepatic steatosis, we need to pay extra attention to glycemic status, to avoid inaccurate interpretation.
Diabetes and NAFLD are closely related. They not only share the same risk factors, but also are common complications to each other. Previous epidemiological studies have shown that the prevalence of NAFLD in the general population is 25.2%, while more than 50% of type 2 diabetes patients have NAFLD, and the prevalence of NAFLD in type 2 diabetes patients with obesity can be as high as 70%.
Accumulation of visceral fat induces release of a large amount of proinflammatory factors and a decrease in anti-inflammatory factors, eventually leading to inflammation.19 An inflammatory milieu induces activation of multiple pathways, leading to insulin resistance in peripheral cells; progression of insulin resistance contributes to the genesis of metabolic syndrome, cardiovascular disease and type 2 diabetes. This is the main mechanism by which visceral fat (which includes liver fat) causes harm.20,21 This is a potential explanation of the greater severity of hepatic steatosis in diabetics as compared to non-diabetics.
Conversely, it has also been suggested that insulin resistance plays a key role in hepatic steatosis and may also contribute to the development of steatohepatitis.22–26 Insulin resistance leads to major changes in lipid metabolism, including enhanced decomposition of peripheral fat, increased synthesis of triglycerides and increased uptake of fatty acids by the liver. All these changes may promote the accumulation of triglycerides in liver cells.22 Insulin resistance is also a key factor in the development of type 2 diabetes. Insulin resistance is involved in the development of hepatic steatosis as well as type 2 diabetes. This is another explanation of the greater severity of hepatic steatosis in diabetics as compared to non-diabetics with the same adipose content. Therefore, the distribution of adipose in diabetic patients is different from that in non-diabetic people. The main difference is that body fat in diabetics tends to be distributed in visceral fat, which is represented by the liver, compared with non-diabetics.
Android obesity is also known as the “apple” shape since the increased fat is mostly distributed in the trunk. Gynoid obesity is referred to as the “pear” shape with most increased fat placed in the area of the hip and thigh. Android adipose deposition in the android area is associated with increased risk of cardiovascular disease, hypertension, hyperlipidemia, insulin resistance and type 2 diabetes,27,28 while adipose deposition in the gynoid region is associated with decreased risk of metabolic and cardiovascular diseases.28 A previous study among people aged 45 years or older in the Netherlands found that AGR could best predict NAFLD prevalence.29 Other studies have shown that high AGR is the independent risk factor for NASH in females, and the optimal cutoff value of AGR was 0.92 in females for predicting NASH.30 Moreover, the present study found that AGR, compared with other fat distribution parameters, has irreplaceable value in predicting hepatic steatosis in diabetic patients.
The novelty value of this study is that we explored the correlation between hepatic steatosis and different parameters of adipose distribution. We did not only compare the degree of hepatic steatosis among NGT, prediabetes and diabetes, but also explored the relationship between hepatic steatosis and adipose distribution in different groups.
Limitations
Some limitations of this study should be considered while interpreting the results. First, there was no information about postprandial blood glucose in NHANES 2017–2018; therefore, some subjects with diabetes may have been excluded from the diabetic group. Second, we could not distinguish between type 1 and type 2 diabetes in this study. Lastly, adipose visceral fat was estimated by DXA. Computed tomography (CT) and magnetic resonance imaging (MRI) are the gold standard method to measure visceral fat. However, DXA has minimal bias from CT or MRI to estimate adipose visceral fat.31,32 Although we mainly focused on the hepatic steatosis, the fibrosis of fatty liver deserves further investigation in the future.
Conclusion
For NGT individuals, high level of total abdominal fat volume, VAT volume, trunk percent fat, android percent fat or AGR all can be used to predict hepatic steatosis. For diabetes, only AGR can predict hepatic steatosis among the surveyed parameters of adipose distribution. Therefore, to prevent hepatic steatosis in diabetes patients, we need to give AGR more concern.
Ethics Statement
All authors declare that this study on human subjects were conducted in accordance with the Declaration of Helsinki. The original survey was approved by the National Center for Health Statistics (NCHS) Research Ethics Review Board (ERB) and all participants provided written informed consent.
Funding
These investigators received no specific grant from any funding agency in the public, commercial or not-for-profit sectors.
Disclosure
None of the authors have any conflicts of interest for this work.
References
1. Scully T. Diabetes in numbers. Nature. 2012;485(7398):S2–3. doi:10.1038/485S2a
2. Singh GK, Siahpush M, Altekruse SF. Time trends in liver cancer mortality, incidence, and risk factors by unemployment level and race/ethnicity, United States, 1969–2011. J Commun Health. 2013;38(5):926–940. doi:10.1007/s10900-013-9703-z
3. Tapper EB, Parikh ND. Mortality due to cirrhosis and liver cancer in the United States, 1999–2016: observational study. BMJ. 2018;362:k2817. doi:10.1136/bmj.k2817
4. El-Serag HB, Tran T, Everhart JE. Diabetes increases the risk of chronic liver disease and hepatocellular carcinoma. Gastroenterology. 2004;126(2):460–468. doi:10.1053/j.gastro.2003.10.065
5. Targher G, Bertolini L, Rodella S, et al. Nonalcoholic fatty liver disease is independently associated with an increased incidence of cardiovascular events in type 2 diabetic patients. Diabetes Care. 2007;30(8):2119–2121. doi:10.2337/dc07-0349
6. Thomas EL, Fitzpatrick JA, Malik SJ, Taylor-Robinson SD, Bell JD. Whole body fat: content and distribution. Prog Nucl Magn Reson Spectrosc. 2013;73:56–80. doi:10.1016/j.pnmrs.2013.04.001
7. Tchernof A, Després JP. Pathophysiology of human visceral obesity: an update. Physiol Rev. 2013;93(1):359–404. doi:10.1152/physrev.00033.2011
8. van der Poorten D, Milner KL, Hui J, et al. Visceral fat: a key mediator of steatohepatitis in metabolic liver disease. Hepatology. 2008;48(2):449–457. doi:10.1002/hep.22350
9. Park BJ, Kim YJ, Kim DH, et al. Visceral adipose tissue area is an independent risk factor for hepatic steatosis. J Gastroenterol Hepatol. 2008;23(6):900–907. doi:10.1111/j.1440-1746.2007.05212.x
10. Yu SJ, Kim W, Kim D, et al. Visceral obesity predicts significant fibrosis in patients with nonalcoholic fatty liver disease. Medicine. 2015;94(48):e2159. doi:10.1097/MD.0000000000002159
11. American Diabetes Association. 2. Classification and diagnosis of diabetes: standards of medical care in diabetes-2019. Diabetes Care. 2019;42(Suppl 1):S13–S28. doi:10.2337/dc19-S002
12. Shah AD, Kandula NR, Lin F, et al. Less favorable body composition and adipokines in South Asians compared with other US ethnic groups: results from the MASALA and Mesa studies. Int J Obes. 2016;40(4):639–645. doi:10.1038/ijo.2015.219
13. Alenaini W, Parkinson J, McCarthy JP, et al. Ethnic differences in body fat deposition and liver fat content in two UK-based cohorts. Obesity. 2020;28:2142–2152. doi:10.1002/oby.22948
14. Zhang E, Wartelle-Bladou C, Lepanto L, Lachaine J, Cloutier G, Tang A. Cost-utility analysis of nonalcoholic steatohepatitis screening. Eur Radiol. 2015;25(11):3282–3294. doi:10.1007/s00330-015-3731-2
15. Castéra L, Vergniol J, Foucher J, et al. Prospective comparison of transient elastography, Fibrotest, APRI, and liver biopsy for the assessment of fibrosis in chronic hepatitis C. Gastroenterology. 2005;128(2):343–350. doi:10.1053/j.gastro.2004.11.018
16. Barr RG, Ferraioli G, Palmeri ML, et al. Elastography assessment of liver fibrosis: society of radiologists in ultrasound consensus conference statement. Radiology. 2015;276(3):845–861. doi:10.1148/radiol.2015150619
17. Sirli R, Sporea I. Controlled attenuation parameter for quantification of steatosis: which cut-offs to use. Can J Gastroenterol Hepatol. 2021;2021:6662760. doi:10.1155/2021/6662760
18. Bouchi R, Nakano Y, Ohara N, et al. Clinical relevance of dual-energy X-ray absorptiometry (DXA) as a simultaneous evaluation of fatty liver disease and atherosclerosis in patients with type 2 diabetes. Cardiovasc Diabetol. 2016;15:64. doi:10.1186/s12933-016-0384-7
19. Janochova K, Haluzik M, Buzga M. Visceral fat and insulin resistance - what we know. Biomed Pap Med Fac Univ Palacky Olomouc Czech Repub. 2019;163(1):19–27. doi:10.5507/bp.2018.062
20. Pahlavani M, Ramalho T, Koboziev I, et al. Adipose tissue inflammation in insulin resistance: review of mechanisms mediating anti-inflammatory effects of omega-3 polyunsaturated fatty acids. J Investig Med. 2017;65(7):1021–1027. doi:10.1136/jim-2017-000535
21. Reddy KJ, Singh M, Bangit JR, Batsell RR. The role of insulin resistance in the pathogenesis of atherosclerotic cardiovascular disease: an updated review. J Cardiovasc Med. 2010;11(9):633–647. doi:10.2459/JCM.0b013e328333645a
22. Sanyal AJ, Campbell-Sargent C, Mirshahi F, et al. Nonalcoholic steatohepatitis: association of insulin resistance and mitochondrial abnormalities. Gastroenterology. 2001;120(5):1183–1192. doi:10.1053/gast.2001.23256
23. Chitturi S, Abeygunasekera S, Farrell GC, et al. NASH and insulin resistance: insulin hypersecretion and specific association with the insulin resistance syndrome. Hepatology. 2002;35(2):373–379. doi:10.1053/jhep.2002.30692
24. Willner IR, Waters B, Patil SR, Reuben A, Morelli J, Riely CA. Ninety patients with nonalcoholic steatohepatitis: insulin resistance, familial tendency, and severity of disease. Am J Gastroenterol. 2001;96(10):2957–2961. doi:10.1111/j.1572-0241.2001.04667.x
25. Pagano G, Pacini G, Musso G, et al. Nonalcoholic steatohepatitis, insulin resistance, and metabolic syndrome: further evidence for an etiologic association. Hepatology. 2002;35(2):367–372. doi:10.1053/jhep.2002.30690
26. Hamaguchi M, Kojima T, Takeda N, et al. The metabolic syndrome as a predictor of nonalcoholic fatty liver disease. Ann Intern Med. 2005;143(10):722–728. doi:10.7326/0003-4819-143-10-200511150-00009
27. Kissebah AH, Krakower GR. Regional adiposity and morbidity. Physiol Rev. 1994;74(4):761–811. doi:10.1152/physrev.1994.74.4.761
28. Folsom AR, Kushi LH, Anderson KE, et al. Associations of general and abdominal obesity with multiple health outcomes in older women: the Iowa Women’s Health Study. Arch Intern Med. 2000;160(14):2117–2128. doi:10.1001/archinte.160.14.2117
29. Alferink L, Trajanoska K, Erler NS, et al. Nonalcoholic fatty liver disease in the Rotterdam study: about muscle mass, sarcopenia, fat mass, and fat distribution. J Bone Miner Res. 2019;34(7):1254–1263. doi:10.1002/jbmr.3713
30. Fang D, Tang W, Zhao X, Sun H, Gu T, Bi Y. Gender differences in the association of body composition and biopsy-proved nonalcoholic steatohepatitis. Hepatol Int. 2022;16(2):337–347. doi:10.1007/s12072-021-10265-9
31. Kaul S, Rothney MP, Peters DM, et al. Dual-energy X-ray absorptiometry for quantification of visceral fat. Obesity. 2012;20(6):1313–1318. doi:10.1038/oby.2011.393
32. Murphy J, Bacon SL, Morais JA, Tsoukas MA, Santosa S. Intra-abdominal adipose tissue quantification by alternative versus reference methods: a systematic review and meta-analysis. Obesity. 2019;27(7):1115–1122. doi:10.1002/oby.22494
 © 2023 The Author(s). This work is published and licensed by Dove Medical Press Limited. The
full terms of this license are available at https://www.dovepress.com/terms
and incorporate the Creative Commons Attribution
- Non Commercial (unported, 3.0) License.
By accessing the work you hereby accept the Terms. Non-commercial uses of the work are permitted
without any further permission from Dove Medical Press Limited, provided the work is properly
attributed. For permission for commercial use of this work, please see paragraphs 4.2 and 5 of our Terms.
© 2023 The Author(s). This work is published and licensed by Dove Medical Press Limited. The
full terms of this license are available at https://www.dovepress.com/terms
and incorporate the Creative Commons Attribution
- Non Commercial (unported, 3.0) License.
By accessing the work you hereby accept the Terms. Non-commercial uses of the work are permitted
without any further permission from Dove Medical Press Limited, provided the work is properly
attributed. For permission for commercial use of this work, please see paragraphs 4.2 and 5 of our Terms.