Back to Journals » Cancer Management and Research » Volume 12
Association Between Contrast-Enhanced Ultrasound Indicators and Prostate Cancer Biochemical Recurrence After Treatment
Authors Mei J ![]() , Zhao Y, Jiang Y, Wang J, Yu J
, Zhao Y, Jiang Y, Wang J, Yu J
Received 22 February 2020
Accepted for publication 1 June 2020
Published 25 June 2020 Volume 2020:12 Pages 4959—4968
DOI https://doi.org/10.2147/CMAR.S250907
Checked for plagiarism Yes
Review by Single anonymous peer review
Peer reviewer comments 2
Editor who approved publication: Dr Xueqiong Zhu
Jiang-jun Mei,1 Yun-xin Zhao,1 Yi Jiang,1 Jian Wang,2 Jia-shun Yu2
1Department of Ultrasound, Shanghai Punan Hospital of Pudong New District, Shanghai, People’s Republic of China; 2Department of Urology, Shanghai Punan Hospital of Pudong New District, Shanghai, People’s Republic of China
Correspondence: Yun-xin Zhao
Department of Ultrasound, Shanghai Punan Hospital of Pudong New District, Room 1602, No. 15, Lane 910, Dingxiang Road, Pudong New District, Shanghai 200135, People’s Republic of China
Tel +86-21-20302000
Email [email protected]
Background: Some patients with prostate cancer (PCa) will experience biochemical recurrence (BCR) after treatment. Current researches have identified the influencing factors of BCR, but these factors are difficult to quantify and hence unable to accurately predict the BCR in PCa patients.
Objective: To explore the value of contrast-enhanced ultrasound (CEUS) indicators in predicting the BCR after treatment by evaluating the association between them.
Patients and Methods: In a retrospective cohort study, 157 PCa patients were recruited and received prostate specific antigen (PSA) measurement, CEUS, pathological classification, and immunohistochemistry after puncture biopsy. PCa patients with BCR were included in the recurrence group, while the remaining patients were included in the non-recurrence group after a 5-year follow-up. The clinical characteristics and CEUS indicators were compared between the two groups, and the multivariable COX regression was used for screening the influencing factors of BCR. Receiver operating characteristic (ROC) curves were used to analyze the value of potential factors in predicting BCR. The effect of the combined prediction model was explored to improve the accuracy of the prediction.
Results: Twelve patients are lost during the follow-up period and the final analysis included 145 patients. The 5-year BCR rate of PCa patients was 27%, with 43 patients in the recurrence group and 102 patients in the non-recurrence group. Multivariate analysis showed that lymph node metastasis (P< 0.001), distant metastasis (P< 0.001), Gleason score (P< 0.001), pretreatment PSA (P< 0.001), treatment method (P< 0.001), peak intensity (PI) (P=0.001), and time to peak (TTP) (P=0.003) were independent influencing factors for BCR after treatment. ROC analysis showed that the AUCs of all indicators in predicting BCR were not high (all < 0.9). The combination of lymph node metastasis, Gleason score, pretreatment PSA, and treatment method can improve the predictive accuracy (AUC = 0.85), but the AUC was still under 0.9. The combined prediction model including CEUS time-intensity curve (TIC) indicators (PI and TTP) could accurately predict the BCR after treatment (AUC=0.953). The sensitivity and specificity were 93.02% and 88.24%, respectively.
Conclusion: The prediction model including TIC indicators and common influencing factors can more accurately predict the BCR in PCa patients.
Keywords: contrast-enhanced ultrasound, time-intensity curve, prostate cancer, prostate specific antigen, Gleason score, biochemical recurrence
Introduction
About 25% of patients with prostate cancer (PCa) will experience biochemical recurrence (BCR) after treatment.1 The median time from BCR to clinical progression is 5–8 years without retreatment, of which 32–45% of patients may die from PCa within 15 years.2,3 Serum prostate specific antigen (PSA) level, treatment method, and Gleason score are recognized risk factors of BCR.4–6 Patients with fewer BCR risk factors tend to have longer recurrence-free survival. Murata et al7 reported that the incidence of BCR was 93.9% in patients with ≥4 risk factors after 18 months. However, most studies about the risk factors of BCR are classified as tendency estimation. It cannot be quantified and applied to accurately predict the incidence of BCR for each individual, which is clinically important in determining treatment options.
The quantitative indicators of time-intensity curve (TIC) are accurate for the identification of benign and malignant tumors in contrast-enhanced ultrasound (CEUS) imaging.8,9 Studies have demonstrated that TIC is a reliable quantitative tool for diagnosing the benign and malignant prostate tumors.10,11 In addition, it can be used to assess the aggressiveness of PCa and to predict PCa biopsy results.12,13 However, the role of TIC in quantitatively predicting the onset of BCR is less reported. The aim of this study is to explore the reliable indicators for accurately predicting the BCR after treatment by establishing a combined prediction model including TIC indicators and the recognized risk factors for each PCa patient.
Patients and Methods
Research Participants
This retrospective cohort study was approved by the Ethics Committee of Shanghai Punan Hospital of Pudong New District. Written informed consents were obtained from all participants. This study was conducted in accordance with the Declaration of Helsinki. Totally 157 consecutive PCa patients diagnosed by prostate puncture biopsy at Shanghai Punan Hospital of Pudong New District from April 2010 to April 2014 were recruited. The patients were 49–89 years old, with an average age of (69.31±8.35) years. The inclusion criteria were as follows: (1) meeting the PCa diagnostic criteria;13 (2) patients diagnosed as primary PCa and not been treated; and (3) complete clinical and imaging data and willing to be followed up. The exclusion criteria were as follows: (1) contraindications of CEUS such as severe heart disease, severe pulmonary hypertension, and allergies; (2) patients with other malignant tumors; and (3) patients with mental illness. The clinical variables including age, body mass index (BMI), PSA, and TNM stage were collected after admission. The TNM stage in this study included T1-T4, N0-N1, and M0-M1. PSA was determined by a commercial chemiluminescence method (UniCel Dxl 800, Beckman Coulter, USA).
CEUS Examination
LOGIQ E9 ultrasound imaging system (GE Healthcare, Milwaukee, Wis., USA) with a wideband IC5-9-D intracavity probe (frequency 5–9 MHz) was equipped. The ultrasound examination and image analysis were independently analyzed by 2 senior sonographers with 8 years of experience in prostate ultrasound. Patients were examined with a transrectal ultrasound to observe the prostate size, blood supply, tumor size, location, and blood flow at first. Subsequently, patients were examined in CEUS mode using the SonoVue ultrasound contrast agent (Bracco SpA, Milan, Italy). The prostate CEUS was observed in real-time and the enhanced strength and texture of PCa were recorded.
Image Analysis
TIC analysis software in the ultrasound imaging system was used to calculate the TIC indicators in the region of interest (ROI), including peak intensity (PI), rising branch slope (α), falling branch slope (β), time to peak (TTP), time to arrival (AT), and area under the curve (AUC).
Pathological Classification and Immunohistochemistry of Biopsy
Eight-needle systematic puncture biopsy was performed for all patients and ultrasound-guided targeted puncture biopsy was performed on suspicious PCa lesions by a senior urologist with more than 10 years of clinical experience. The puncture specimens were sent for pathological examination and CD34 immunohistochemistry and analyzed by a senior pathologist with 10 years of experience in diagnosing PCa. Patients with PCa pathological diagnosis would classified by Gleason score.14
Treatment
PCa patients with clinical staging T1-T2, more than 10 years in life expectancy, able to tolerate general anesthesia, and no obvious surgery contraindications received radical prostatectomy (RP). Other patients (i.e. patients with clinical staging T3–T4) received medical or surgical castration. Medical castration: Leuprorelin 3.6 mg was injected every 28 days and bicalutamide was given 50.0 mg/d. Surgical castration: Bilateral testectomy was performed and bicalutamide was given 50.0 mg/d for 6 months after the surgical wound was about healed.
Follow-Up
Patients would receive an outpatient PSA review during follow-up. The first follow-up time was in the 1st month after the end of treatment, and a follow-up of every 3 months was needed thereafter. Follow-up was performed every 6 months after 2 years and the total follow-up time was 5 years. BCR was defined if increased PSA levels were detected twice in succession, and each increase was more than 0.2ng/mL.15 Patients with BCR were included in the recurrence group and the remaining patients were included in the non-recurrence group (Figure 1).
 |
Figure 1 Flowchart of recruitment, examination, treatment and grouping in PCa patients. |
Statistical Analysis
SPSS (version 22.0; SPSS Inc., Chicago, IL, USA) and MedCalc (Version 22.0.1; MedCalc Software, Ostend, Belgium) were used for statistical analysis. The numerical data conforming to the normal distribution were expressed as mean ± standard deviation, and independent sample t-tests were used for comparison. The numerical data that did not meet the normal distribution were expressed as median (interquartile range), and Mann–Whitney U-tests were used for comparison. The categorical variables were expressed as number and the comparison between the two groups was performed by the chi-square test. Intraclass correlation coefficient (ICC) was used to test the inter-observer agreement of the TIC indicators measured by two sonographers. ICC> 0.75 indicates good repeatability, 0.4 <ICC≤0.75 normal repeatability, and ICC≤0.4 indicates poor repeatability. Kaplan–Meier was used to calculate the BCR rate and plot a survival curve. Multivariate COX regression analysis was used to analyze independent influencing factors for BCR. Receiver-operating characteristics (ROC) curves were established to evaluate the predictive ability of potential indicators for BCR. A logistic regression model was used to establish a combined prediction model and its feasibility in predicting BCR was explored. Statistical significance was defined as 2-tailed P<0.05 for all tests.
Results
Follow-Up Results
At the end of the follow-up, 12 of the 157 PCa patients were lost. Forty-three patients were diagnosed as BCR (included in the recurrence group), and the remaining 102 patients without BCR were included in the non-recurrence group (145 patients included in this study finally). The Kaplan–Meier analysis showed that the 5-year incidence of BCR was 27%. The number of patients with BCR increased with time, and it increased significantly at the 12th, 26th and 48th month of the follow-up (Figure 2).
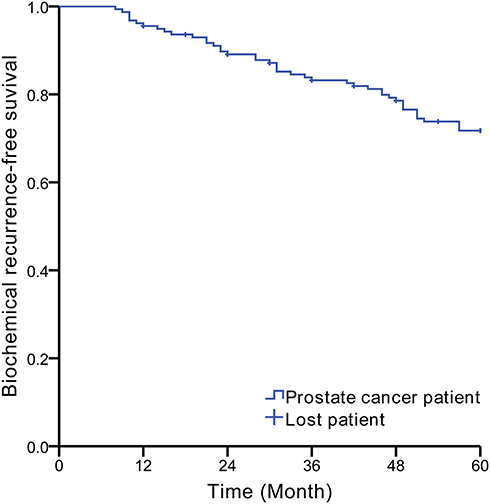 |
Figure 2 The incidence of BCR within 5 years of follow-up in PCa patients (Kaplan–Meier). |
Comparison of Clinical Variables and CEUS Features in the Recurrence and Non-Recurrence Group
In the recurrence group, the proportion of clinical stage T3-T4, lymph node metastasis, distant metastasis, tumor size, Gleason score>7, pretreatment PSA and medical or surgical castration were higher than those in the non-recurrence group (all P<0.05, Table 1).
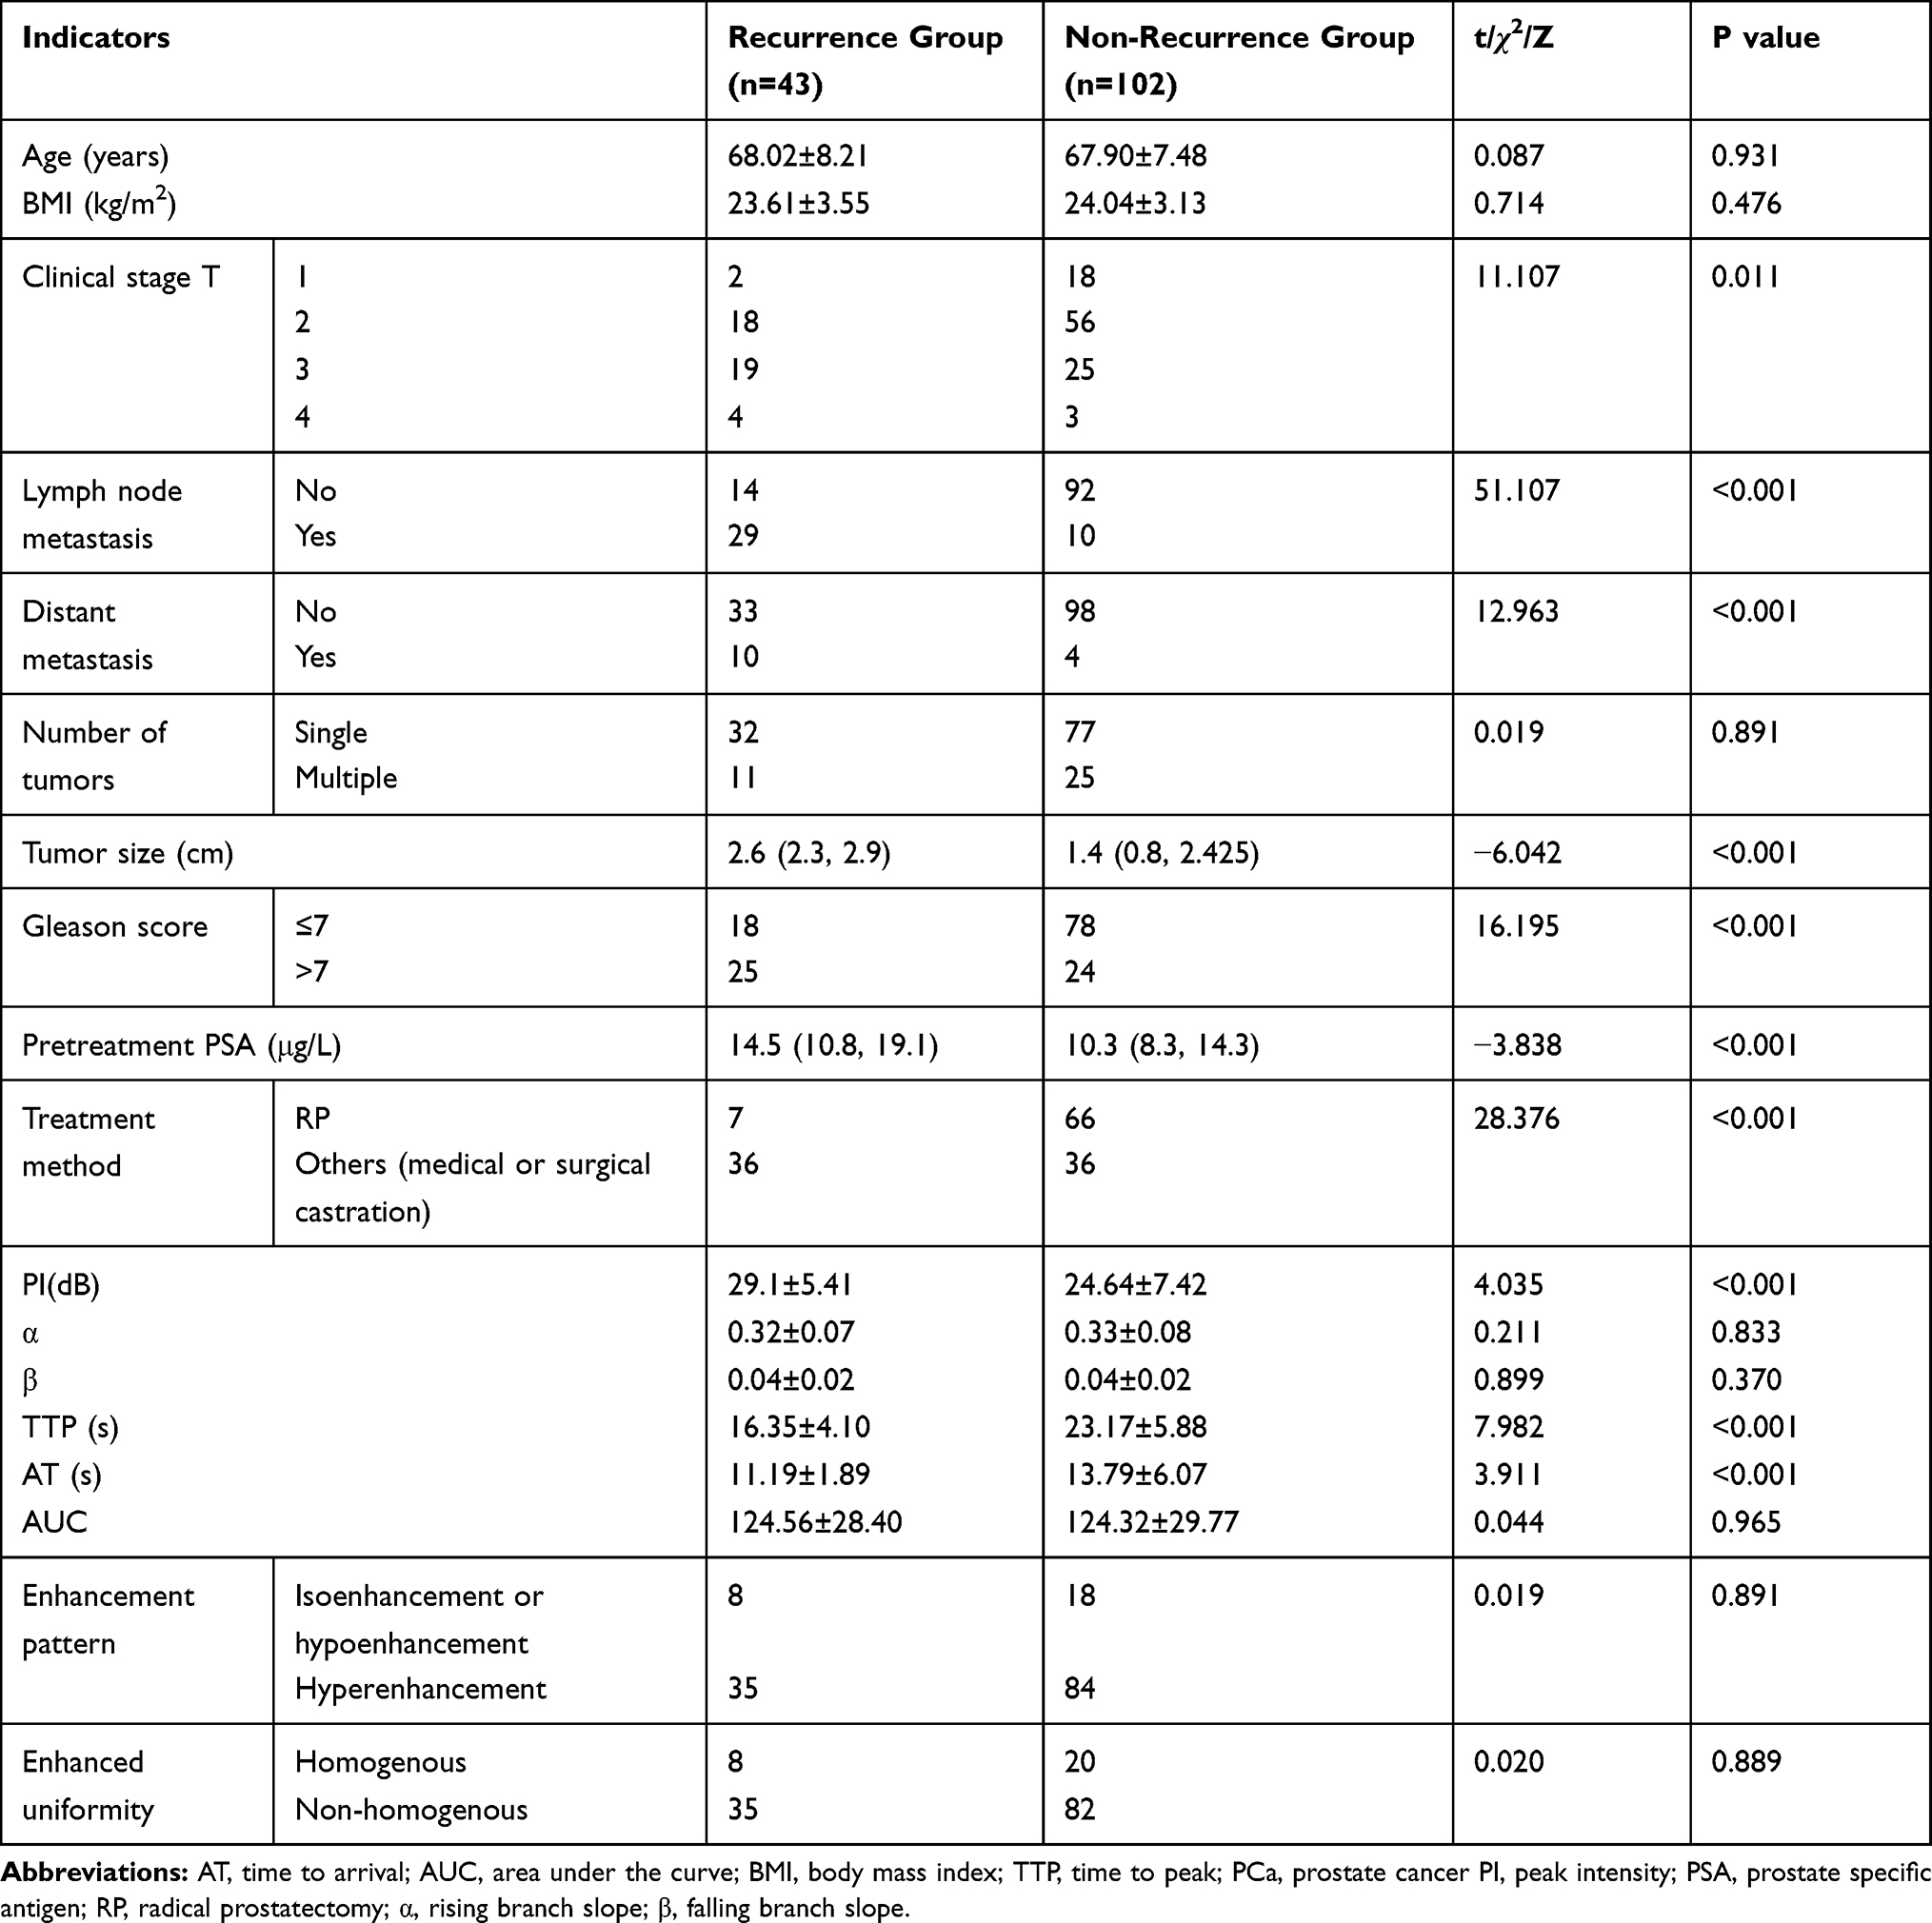 |
Table 1 Comparison of Clinical Variables and CEUS in the Recurrence and Non-Recurrence Group |
The ultrasound features of PCa showed abnormal enhancement of the external glands (left of Figure 3A, left of Figure 3B). In CEUS, a rapid hyperenhancement in the arterial wash-in phase was displayed, and the enhancement intensity was greater than that of the surrounding normal prostate tissue. Most PCa lesions showed hyperenhancement (right of Figure 3A) and a small part of them showed hypoenhancement (right of Figure 3B). A slight hypoenhancement in the venous phase was displayed, and the contrast agent washed out rapidly in the parenchymal phase.
 |
Figure 3 Assessment of PCa by transrectal ultrasonography and pathological diagnosis. (A) The hypoechoic nodule of the left external gland of the prostate is hyperenhanced, with asymmetric enhancement in the range of approximately 1.5 cm × 1.0 cm. (B) The hypoechoic nodule of the left external gland of the prostate is hypoenhanced, with an asymmetric enhancement in the range of approximately 1.7 cm × 1.0 cm. (C) The TIC shows that the ascending slope in the nodule region is larger and the peak intensity is higher. (D) Prostate adenocarcinoma, Gleason score 5+5=10, hematoxylin-eosin staining (200 magnification). (E) Prostate adenocarcinoma, CD34 immunohistochemical staining (200 magnification), prostate cancer tissue is rich in blood vessels. |
The ICC of the TIC indicators including PI, α, β, TTP, AT, AUC was 0.913, 0.927, 0.917, 0.921, 0.946, and 0.933, respectively, which indicated that the inter-observer agreement of the two sonographers in testing TIC indicators was good. By comparing the TIC indicators between the two groups, it found that most of the ascending branches of TIC in the recurrence group showed a larger slope and a higher peak intensity (Figure 3C). Table 1 shows that PI in the recurrence group is higher than that in the non-recurrence group, while TTP and AT are lower than those in the non-recurrence group (all P<0.05). PCa biopsy pathology results showed that the Gleason score of PCa was between 6–10 (Figure 3D), the lower the degree of differentiation, the higher the microvessel density (Figure 3E).
Multivariate COX Regression Analysis of BCR in PCa Patients
The results showed that lymph node metastasis (P<0.001), distant metastasis (P <0.001), Gleason score (P<0.001), pretreatment PSA (P<0.001), treatment method (P<0.001), PI (P=0.001), and TTP (P=0.003) were the independent influencing factors for BCR (Table 2).
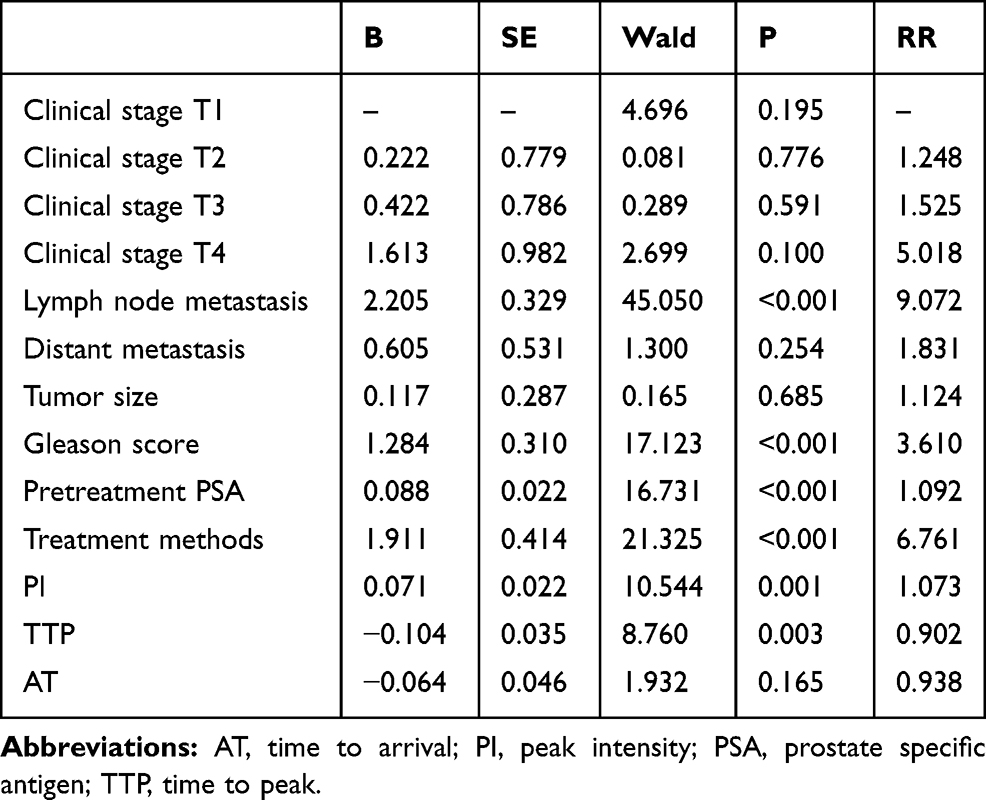 |
Table 2 Multivariate COX Regression Analysis for BCR |
Accuracy Analysis of Potential Indicators in Predicting BCR
The ROC curves were established to further analyze the potential indicators including lymph node metastasis, Gleason score, pretreatment PSA, treatment methods, PI and TTP in predicting BCR. As shown in Figure 4 and Table 3, the AUC of each indicator is inaccurate (all <0.9), of which the accuracy of TTP is the highest (AUC = 0.826), and the AUC of other indicators are <0.8. It indicated that these indicators were difficult to independently predict the BCR after treatment. In order to improve the predictive accuracy, this study combined the common influencing factors based on a logistic regression model. It found that the combination of lymph node metastasis, Gleason score, pretreatment PSA, and treatment methods can improve the predictive accuracy of BCR. But the AUC was still <0.9. However, when combined with the TIC indicators (PI and TTP), the AUC of the combined prediction model (0.953) revealed that it could accurately predict the BCR after treatment, which was significantly higher than other indicators (P<0.05). The cut-off point was 0.26, and the sensitivity and specificity were 93.02% and 88.24%, respectively. The fitting equation was Logit (P) =−1.589 + 2.256*lymph node metastasis + 1.161*Gleason score+0.081* pretreatment PSA + 2.32*treatment + 0.092*PI- 0.398*TTP (Table 3 and Figure 5).
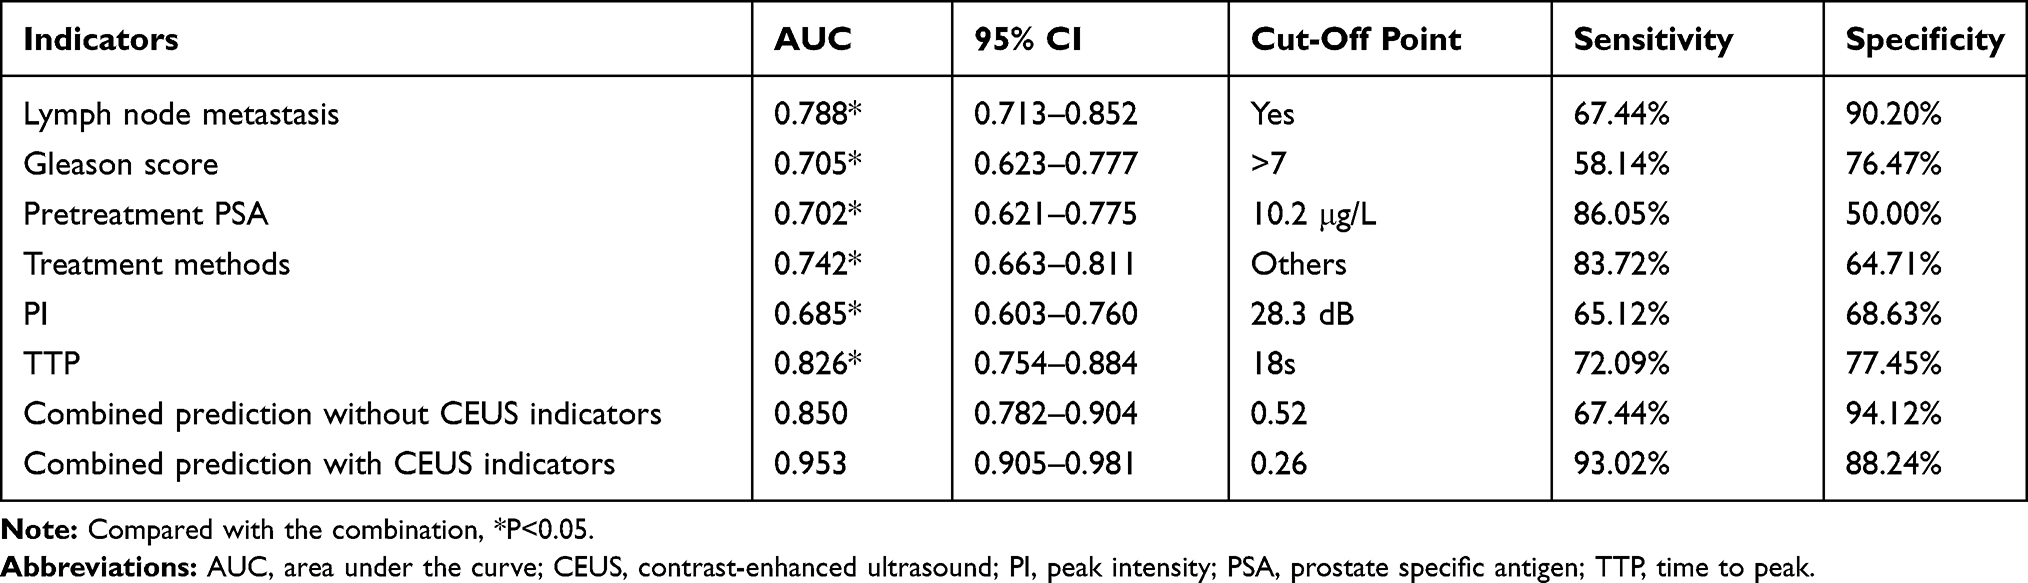 |
Table 3 ROC Analysis for the Prediction of BCR |
 |
Figure 4 ROC analysis of potential indicators for predicting BCR. |
 |
Figure 5 ROC analysis of the combined prediction model with or without TIC indicators for BCR. |
Discussion
Predictive Analysis of Known Risk Factors for BCR
The incidence of BCR within 5 years in the present study was 27%, which was similar to the results of Ward et al.16 It is known that multiple factors may affect the BCR after treatment, of which PSA and Gleason score have been recognized as the important influencing factors.17,18 The study by Carroll et al19 showed that PSA was of great significance in predicting BCR after treatment. Similarly, in this study, pretreatment PSA was one of the influencing factors for BCR in multivariate analysis. However, ROC analysis showed that the AUC of pretreatment PSA (0.702) in predicting BCR was not accurate. It indicated that it is difficult to predict the probability of BCR in each PCa patient by pretreatment PSA despite it can be used as a tendency estimation indicator to find PCa patients with a higher risk of BCR. The possible reason is that in addition to PCa, multiple mechanisms may cause increased PSA levels, including inflammatory factors, urinary catheterization, etc. Therefore its specificity in predicting BCR was reduced.20
Poorly differentiated tumor tissue usually grows rapidly and has a poor prognosis. Gleason score defines the tumor malignancy and predicts the development trend.21 Our study confirmed that Gleason> 7 was one of the main influencing factors for BCR, which was similar to the research by Rasiah et al.22 They proved that Gleason>7 was an easily available predictor of BCR. However, its AUC in predicting BCR (0.705) was still inaccurate. The possible reason is that Gleason>7 is a qualitative indicator and is difficult to accurately reveal the local small differences in tumors compared to quantitative indicators.
TNM staging can be used to assess the degree of PCa invasion and its prognosis, of which lymph node metastasis is one of the important prognostic factors.23 Cheng et al24 found that the prognosis of patients with single lymph node metastasis was better than that of patients with multiple lymph node metastases. The study by Luchini et al25 also showed that PCa patients with lymph node metastasis had a higher risk of recurrence. Our study revealed that lymph node metastasis was also one of the independent influencing factors of BCR.
The routinely used treatments for PCa also affect the recurrent outcomes. The research by Liu et al26 showed that patients underwent RP had significantly longer survival than patients who underwent other treatments. Our study found that the treatment method was an independent factor affecting BCR. It is worth noting that the treatment method, lymph node metastasis and Gleason score are all qualitative indicators. Their accuracies in predicting BCR are limited although they are suitable for tendency estimation.
Predictive Analysis for BCR by TIC Indicators
In the recurrence group, CEUS demonstrated a circumscribed perfusion area with rapid hyperenhancement in the arterial wash-in phase compared to the surrounding normal prostate tissues. This enhancement mode may indicate the risk of BCR.27 The possible reason is that the tumor cells induce more neovascularization and make microvessels more concentrated. Due to the increased blood supply demand of malignant tumor tissues, they will be stimulated to form a large number of arteriovenous fistulas. It makes the contrast agent quickly wash in and wash out in the PCa lesion, and the perfusion of contrast agent is significantly greater than the surrounding tissues.28 Therefore, these prostate malignant tumors are more likely to recur, which is consistent with the findings by Erbersdobler et al.29
In the TIC analysis, TTP was lower and PI was higher in the recurrence group and they were significantly associated with BCR in the multivariate analysis. It indicated that the tumors in the recurrence group were mostly poorly differentiated and their blood supply was rich. Zhu et al30 also reported that the TTP of poorly differentiated tumors was significantly lower than that of highly differentiated tumors. Poorly differentiated tumors might indicate more blood supply to prostatic tumors, which was more possible to recur in the future. In the predictive analysis of BCR, the accuracies of TIC indicators were higher than the known risk factors. Especially the AUC of TTP was 0.826, but it was still not qualified to accurately predict BCR.
Combined Prediction Analysis
The AUCs of the independent influencing factors in this study were not accurate in predicting BCR since most of them are qualitative indicators (although the AUCs of TIC indicators were relatively higher). In this study, by combining the known risk factors for BCR (lymph node metastasis, Gleason score, pretreatment PSA, treatment methods), it revealed that the accuracy of combined prediction model was better than that of each single factor, but the AUC was still <0.9. However, when the TIC indicators (PI and TTP) were also included in the combined prediction model, the BCR after treatment could be accurately predicted (AUC=0.953). It suggested that in clinical setting, physicians can record the common risk factors of BCR and the TIC indicators (PI and TTP) to predict the probability of BCR for each PCa patient by the mathematical model.
Limitation and Perspective
Because our study is a retrospective cohort study at a single institution, a completely blinded study was impossible and the selection bias is inevitable in our study design. Moreover, there may be some other factors affecting the BCR that have not been recorded in the clinical setting, which is the limitation of this study. Since a mathematical model can only calculates the results closest to the real situation based on a large sample. The accurate prediction of BCR requires a larger sample and more complete data collection to reduce the fitting errors of the combined prediction model.
Conclusion
The combined prediction model established by the known risk factors and the TIC indicators is expected to accurately predict the BCR in each PCa patient.
Abbreviation
AT, time to arrival; AUC, area under the curve; BCR, biochemical recurrence; BMI, body mass index; CEUS, contrast-enhanced ultrasound; HE, hematoxylin eosin; MVD, microvessel density; PI, peak intensity; PCa, prostate cancer; PSA, prostate specific antigen; ROC, Receiver Operating Characteristic; RP, radical prostatectomy; TIC, time-intensity curve; TTP, time to peak; α, rising branch slope; β, falling branch slope.
Disclosure
The authors report no conflicts of interest in this work.
References
1. Stephenson AJ, Scardino PT, Eastham JA, et al. Preoperative nomogram predicting the 10-year probability of prostate cancer recurrence after radical prostatectomy. J Natl Cancer Inst. 2006;98(10):715–717. doi:10.1093/jnci/djj190
2. Freedland SJ, Humphreys EB, Mangold LA, et al. Risk of prostate cancer–specific mortality following biochemical recurrence after radical prostatectomy. JAMA. 2005;294(4):433–439. doi:10.1001/jama.294.4.433
3. Bianco FJ
4. Artibani W, Porcaro AB, De Marco V, Cerruto MA, Siracusano S. Management of biochemical recurrence after primary curative treatment for prostate cancer: a review. Urol Int. 2018;100(3):251–262. doi:10.1159/000481438
5. Lee BH, Kibel AS, Ciezki JP, et al. Are biochemical recurrence outcomes similar after radical prostatectomy and radiation therapy? Analysis of prostate cancer-specific mortality by nomogram-predicted risks of biochemical recurrence. Eur Urol. 2015;67(2):204–209. doi:10.1016/j.eururo.2014.09.017
6. Van den Broeck T, van den Bergh RCN, Arfi N, et al. Prognostic value of biochemical recurrence following treatment with curative intent for prostate cancer: a systematic review. Eur Urol. 2019;75(6):967–987. doi:10.1016/j.eururo.2018.10.011]
7. Murata Y, Tatsugami K, Yoshikawa M, et al. Predictive factors of biochemical recurrence after radical prostatectomy for high-risk prostate cancer. Int J Urol. 2018;25(3):284–289. doi:10.1111/iju.13514]
8. Gao Y, Liao XH, Lu L, et al. Contrast-enhanced transrectal ultrasonography for the detection of diffuse prostate cancer. Clin Radiol. 2016;71(3):258–264. doi:10.1016/j.crad.2015.11.013
9. Ashrafi AN, Nassiri N, Gill IS, Gulati M, Park D, de Castro Abreu AL. Contrast-enhanced transrectal ultrasound in focal therapy for prostate cancer. Curr Urol Rep. 2018;19(10):87. doi:10.1007/s11934-018-0836-6
10. Huang H, Zhu ZQ, Zhou ZG, et al. Contrast-enhanced transrectal ultrasound for prediction of prostate cancer aggressiveness: the role of normal peripheral zone time-intensity curves. Sci Rep. 2016;6(1):38643. doi:10.1038/srep38643
11. Goossen TE, de la Rosette JJ, Hulsbergen-van de Kaa CA, van Leenders GJ, Wijkstra H. The value of dynamic contrast enhanced power doppler ultrasound imaging in the localization of prostate Cancer. Eur Urol. 2003;43(2):124–131. doi:10.1016/s0302-2838(02)00582-1
12. Postema AW, Frinking PJ, Smeenge M, et al. Dynamic contrast-enhanced ultrasound parametric imaging for the detection of prostate cancer. BJU Int. 2016;117(4):598–603. doi:10.1111/bju.13116
13. Heidenreich A, Bastian PJ, Bellmunt J, et al.; European Association of Urology. EAU guidelines on prostate cancer. part 1: screening, diagnosis, and local treatment with curative intent-update 2013. Eur Urol. 2014;65(1):124–137. doi:10.1016/j.eururo.2013.09.046
14. Humphrey PA. Histopathology of prostate cancer. Cold Spring Harb Perspect Med. 2017;7(10):a030411. doi:10.1101/cshperspect.a030411
15. Stephenson AJ, Kattan MW, Eastham JA, et al. Defining biochemical recurrence of prostate cancer after radical prostatectomy: a proposal for a standardized definition. J Clin Oncol. 2006;24(24):3973–3978. doi:10.1200/JCO.2005.04.0756
16. Ward JF, Blute ML, Slezak J, Bergstralh EJ, Zincke H. The long-term clinical impact of biochemical recurrence of prostate cancer 5 or more years after radical prostatectomy. J Urol. 2003;170(5):1872–1876. doi:10.1097/01.ju.0000091876.13656.2e
17. Venclovas Z, Jievaltas M, Milonas D. Significance of time until PSA recurrence after radical prostatectomy without neo-or adjuvant treatment on clinical progression and cancer related death in high-risk prostate cancer patients. Front Oncol. 2019;9:1286. doi:10.3389/fonc.2019.01286
18. Epstein JI, Egevad L, Amin MB, Delahunt B, Srigley JR, Humphrey PA; Grading Committee. The 2014 international society of urological pathology (ISUP) consensus conference on gleason grading of prostatic carcinoma definition of grading patterns and proposal for a new grading system. Am J Surg Pathol. 2016;40(2):244–252. doi:10.1097/PAS.0000000000000530]
19. Carroll P. Rising PSA after a radical treatment. Eur Urol. 2001;2:9–16. doi:10.1159/000049879
20. Umbehr MH, Gurel B, Murtola TJ, et al. Intraprostatic inflammation is positively associated with serum PSA in men with PSA −1, normal DRE and negative for prostate cancer. Prostate Cancer Prostatic Dis. 2015;18(3):264–269. doi:10.1038/pcan.2015.19
21. Johnston WL, Catton CN, Swallow CJ. Unbiased data mining identifies cell cycle transcripts that predict non-indolent gleason score 7 prostate cancer. BMC Urol. 2019;19(1):4. doi:10.1186/s12894-018-0433-5
22. Rasiah KK, Stricker PD, Haynes AM, et al. Prognostic significance of gleason pattern in patients with gleason score 7 prostate carcinoma. Cancer. 2003;98(12):2560–2565. doi:10.1002/cncr.11850
23. Muteganya R, Goldman S, Aoun F, Roumeguère T, Albisinni S. Current imaging techniques for lymph node staging in prostate cancer: a review. Front Surg. 2018;5:74. doi:10.3389/fsurg.2018.00074
24. Cheng L, Zincke H, Blute ML, Bergstralh EJ, Scherer B, Bostwick DG. Risk of prostate carcinoma death in patients with lymph node metastasis. Cancer. 2001;91(1):66–73. doi:10.1002/1097-0142(20010101)91:1<66::aid-cncr9>3.0.co;2-p
25. Luchini C, Fleischmann A, Boormans JL, et al. Extranodal extension of lymph node metastasis influences recurrence in prostate cancer: a systematic review and meta-analysis. Sci Rep. 2017;7(1):2374. doi:10.1038/s41598-017-02577-4
26. Liu L, Coker AL, Du XL, Cormier JN, Ford CE, Fang S. Long-term survival after radical prostatectomy compared to other treatments in older men with local/regional prostate cancer. J Surg Oncol. 2008;97(7):583–591. doi:10.1002/jso.21028
27. Wildeboer RR, Postema AW, Demi L, Kuenen MPJ, Wijkstra H, Mischi M. Multiparametric dynamic contrast-enhanced ultrasound imaging of prostate cancer. Eur Radiol. 2017;27(8):3226–3234. doi:10.1007/s00330-016-4693-8
28. Jung EM, Wiggermann P, Greis C, et al. First results of endocavity evaluation of the microvascularization of malignant prostate tumors using contrast enhanced ultrasound (CEUS) including perfusion analysis: first results. Clin Hemorheol Microcirc. 2012;52(2–4):167–177. doi:10.3233/CH-2012-1594
29. Erbersdobler A, Isbarn H, Dix K, et al. Prognostic value of microvessel density in prostate cancer: a tissue microarray study. World J Urol. 2010;28(6):687–692. doi:10.1007/s00345-009-0471-4
30. Zhu Y, Chen Y, Jiang J, Wang R, Zhou Y, Zhang H. Contrast-enhanced harmonic ultrasonography for the assessment of prostate cancer aggressiveness: a preliminary study. Korean J Radiol. 2010;11(1):75–78. doi:10.3348/kjr.2010.11.1.75
 © 2020 The Author(s). This work is published and licensed by Dove Medical Press Limited. The
full terms of this license are available at https://www.dovepress.com/terms
and incorporate the Creative Commons Attribution
- Non Commercial (unported, 3.0) License.
By accessing the work you hereby accept the Terms. Non-commercial uses of the work are permitted
without any further permission from Dove Medical Press Limited, provided the work is properly
attributed. For permission for commercial use of this work, please see paragraphs 4.2 and 5 of our Terms.
© 2020 The Author(s). This work is published and licensed by Dove Medical Press Limited. The
full terms of this license are available at https://www.dovepress.com/terms
and incorporate the Creative Commons Attribution
- Non Commercial (unported, 3.0) License.
By accessing the work you hereby accept the Terms. Non-commercial uses of the work are permitted
without any further permission from Dove Medical Press Limited, provided the work is properly
attributed. For permission for commercial use of this work, please see paragraphs 4.2 and 5 of our Terms.