Back to Journals » Neuropsychiatric Disease and Treatment » Volume 13
Association between COMT Val158Met and DAT1 polymorphisms and depressive symptoms in the obese population
Authors Bieliński M ![]() , Jaracz M
, Jaracz M ![]() , Lesiewska N
, Lesiewska N ![]() , Tomaszewska M, Sikora M, Junik R, Kamińska A, Tretyn A, Borkowska A
, Tomaszewska M, Sikora M, Junik R, Kamińska A, Tretyn A, Borkowska A ![]()
Received 1 April 2017
Accepted for publication 7 July 2017
Published 18 August 2017 Volume 2017:13 Pages 2221—2229
DOI https://doi.org/10.2147/NDT.S138565
Checked for plagiarism Yes
Review by Single anonymous peer review
Peer reviewer comments 3
Editor who approved publication: Dr Roger Pinder
Maciej Bieliński,1 Marcin Jaracz,1 Natalia Lesiewska,1 Marta Tomaszewska,1 Marcin Sikora,2 Roman Junik,3 Anna Kamińska,3 Andrzej Tretyn,2 Alina Borkowska1
1Department of Clinical Neuropsychology, Nicolaus Copernicus University in Toruń, Collegium Medicum in Bydgoszcz, Bydgoszcz, 2Department of Biotechnology, Nicolaus Copernicus University in Toruń, Toruń, 3Department of Endocrinology and Diabetology, Nicolaus Copernicus University in Toruń, Collegium Medicum in Bydgoszcz, Bydgoszcz, Poland
Objectives: Depressive symptoms are common among patients with obesity. Abnormalities in dopamine signaling involved in the reward circuit may ensue excessive consumption of food, resulting in obesity and leading to neuropsychiatric disorders such as depression. This study sought to investigate the association of polymorphisms in the genes encoding DAT1/SLC6A3 and COMT with the intensity of depressive symptoms in obese subjects.
Participants and methods: Prevalence and severity of depressive symptoms were assessed in a group of 364 obese patients using the Beck Depression Inventory (BDI) and the Hamilton Depression Rating Scale (HDRS). Genetic polymorphisms in DAT1 and COMT were evaluated in peripheral blood samples.
Results: The results indicated an association between DAT1 alleles and depressive symptoms, as well as severity of obesity. Subjects homozygous for the nine-repeat allele scored higher in BDI (P=0.022) and HDRS (P=0.00001), suggesting higher intensity of depression in both sexes. This allele was also associated with the highest body mass index (BMI; P=0.001). Carriers of the Val158Met allele of COMT scored higher on both depression scales (BDI, P=0.0005; HRDS, P=0.002) and had the highest BMI values.
Conclusion: Polymorphisms in the DAT1 and COMT genes are associated with a greater intensity of depressive symptoms in the obese population.
Keywords: dopaminergic signaling, obesity, depressive symptoms, reward circuit, gene polymorphism
Introduction
In recent decades, obesity has become a serious health problem worldwide. In 2014, nearly 2 billion people were overweight and >600 million were obese.1 High body weight is a risk factor for depressive symptoms,2 which are also considered to be disabling conditions with very high prevalence.3,4 Both depression and obesity are associated with elevated mortality and reduced quality of life; accordingly, their prevention and treatment are important priorities in many industrialized nations.5,6 For obesity, however, interventions seldom result in lasting weight loss and often fail to prevent future obesity.7 Likewise, for depressive disorders, more effective therapeutic approaches and novel treatment strategies are urgently required.8 A better understanding of the processes that account for the weight gain and elevated morbidity associated with depression would facilitate development of more efficient preventive and therapeutic interventions.
Dopamine signaling is closely connected with emotional and motivational functioning, especially in relation to reward-seeking behaviors such as drug abuse or natural rewards such as food intake.9 The circuit responsible for reward processing and motivation is a very complex neural network. This system has numerous neural pathways: the dopaminergic pathway consists of the frontal and prefrontal cortex (PFC) and subcortical areas, among which the nucleus accumbens (NAc), which forms the ventral striatum (VS), is a key region in human reward processing. Maladaptive changes in dopamine signaling within reward areas are presumed to be responsible for susceptibility to and the development of obesity and depressive disorders.8,10–12
Recent data show that the dysfunction in dopaminergic circuits may be responsible for the pathogenesis of mood disorders. Likewise, growing evidence describe the role of NAc in the regulation of traits that mediate behavioral abnormalities connected with depression.11 Grace suggested that diminished activation within subcortical circuits following their hyperactivity may result in anhedonia and depression. The abovementioned symptoms might be caused by the compensatory downregulation of dopamine neurons due to acute dopamine system activity.13
Many genetic studies provide evidence that genes involved in dopaminergic neurotransmission contribute to personality traits and major mental illnesses.10,14–18 Gatt et al10 implicated DAT1 in depression. Moreover, Massat et al19 linked the COMT Val158Met polymorphism to early onset of depressive disorders. The influence of COMT genotype on amygdale is not as clear as its impact on PFC. However, it is speculated that alterations in the activation within this areas, which are rendered by COMT polymorphism, may result in a vulnerability to affective disorders.18 Several studies also tested the association between obesity and genotype distributions of allele frequencies.20–22 Thaler et al21 found that homozygosity for the DAT1 ten-repeat allele determines the risk for eating-related symptomatology, whereas Sikora et al23 revealed that homozygosity for the nine-repeat allele was associated with a higher body mass index (BMI) in a group of 506 women. Other studies have reached conflicting conclusions.21,24,25 For example, Uzun et al24 excluded the link of the DAT1 gene to BMI and obesity and Thaler et al21 did not detect an association between COMT genotypes and alterations in BMI.
The human dopamine active transporter (DAT) regulates dopamine concentration in the synaptic cleft between dopamine neurons and is mostly distributed in the basal ganglia of the human brain.26 The role of this specific protein is to reuptake the dopamine that is released into presynaptic terminals. Therefore, the dopaminergic activity in synaptic neurotransmission is terminated. The DAT1 gene, also called SLC6A3, is localized to chromosome 5p15.3 and has a 40-bp variable number tandem repeat (VNTR) polymorphism within its 3′ untranslated region. The two most common alleles have nine and ten repeats, respectively. The A9 allele is putatively associated with higher levels of dopamine in the striatum and is more frequent among those who are addicted to psychoactive substances.27,28 In some studies, homozygosity of the nine-repeat allele (DAT-S) has been linked to reduced transporter protein expression, leading to a higher dopamine availability in the synapse29 and an elevated ventral striatal reactivity.30,31 On the contrary, homozygosity of the ten-repeat allele (DAT-L) is responsible for higher overall DAT concentration, which correlates with dopamine (DA) reuptake, and is thus associated with reduced synaptic dopamine availability.32 However, exact effects on DAT expression is still unclear due to evidence describing converse results in regard to aforementioned DAT1 SLC6A3 polymorphism and DA concentration.33,34
COMT is the enzyme that regulates dopamine catabolism. It is translated at higher levels in the PFC and temporal areas than in subcortical regions like striatum.18,35 COMT degrades DA and inhibits the biological function of this neurotransmitter after it is released in the synaptic cleft. COMT occurs in two isoforms, cell membrane bound (M-COMT) and soluble (S-COMT), which are encoded by the same gene (COMT). S-COMT consists of 221 amino acids, and M-COMT has 51 additional amino acids.36 S-COMT predominates outside the brain, whereas M-COMT is more abundant in the brain and is thus implicated in central dopamine activity. The COMT gene is located at 22q11.2 chromosome, and the common polymorphism is the Val158Met substitution that alters the activity of the encoded enzyme and may have neurobiological consequences.37 Three different genotypes of the COMT Val158Met polymorphism exist: Met/Met, Met/Val, and Val/Val. Individuals homozygous for the Met allele have lower COMT activity and degrade extrasynaptic dopamine more slowly, resulting in higher DA availability in the PFC, than COMT Val/Val subjects who have higher COMT activity leading to reduced dopaminergic signaling.38,39
Studies to date have yielded inconsistent results regarding the relationship of dopaminergic activity to obesity and depressive disorders. Accordingly, in this study, we sought to investigate the association of DAT1 and COMT polymorphisms with the intensity of depressive symptoms in the big sample of obese participants. There will be attempts to elucidate which mechanisms within the reward circuits are responsible for abovementioned connections.
Participants and methods
Participants
A total of 364 Caucasian patients of Polish nationality were enrolled in the study. Individuals included in the study were recruited from patients treated for obesity in health clinic. Demographic characteristics including age and sex of the subjects were collected (Table 1). The mean age of participants was 52 years (range, 39–69 years) for women and 56 years (range, 42–67 years) for men. Subjects with a severe somatic or psychiatric disorder per Diagnostic and Statistical Manual of Mental Disorders, 4th edition; any neurological abnormality; or any addiction to illicit drugs or alcohol were excluded from the study. Participants were informed about the aims of this study and provided written informed consent. Permission for the study was obtained from the Bioethical Commission of the Nicolaus Copernicus University, Collegium Medicum in Bydgoszcz (No 533/2008).
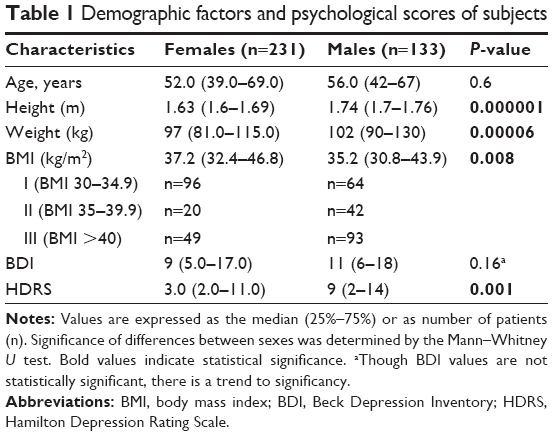 | Table 1 Demographic factors and psychological scores of subjects |
Clinical assessments and measures
Clinical evaluation was based on physical examination and medical history. Emphasis was placed on facets that influence weight gain or that are associated with psychological disorders, such as biometric analyses and concomitant diseases, eg, hypertension, hypercholesterolemia, and diabetes mellitus.
Biometric analyses were performed to measure weight (kg), height (m), and BMI. As a proxy for adiposity, BMI was calculated as the ratio between weight (kg) and squared height (m2). Primary obesity was defined as a BMI of >30. Secondary causes of obesity were excluded based on medical history, physical examination, and biochemical results (eg, cortisol, prolactin, and thyroid-stimulating hormone levels).
Key emotional depressive symptoms and their severity were measured using the Beck Depression Inventory (BDI; an assessment of subjective depression) and Hamilton Depression Rating Scale (HDRS; an assessment of objective depression). Depression was defined based on an established cutoff score for the Polish population: ie, BDI score >12 and HDRS score >7.
Genotyping
Genomic DNA was extracted from 7 to 10 mL of peripheral blood using the method of Lahiri and Schnabel.40 Blood was collected and mixed with 0.5 mL of 0.5 M EDTA, frozen in liquid nitrogen, and stored at −80°C prior to extraction. DAT1 and COMT genotypes were determined by polymerase chain reaction (PCR). The following primers were used: DAT1 forward, 5′-TGTGGTGTAGGGAACGGCCTGAG-3′; DAT1 reverse, 5′-CTTCCTGGAGGTCACGGCTCAAGG-3′; COMT forward, 5′-AGCTCCAAGCGCGCTCACAG-3′; and COMT reverse, 5′-CAAAGTGCGCATGCCCTCCC-3′. PCR products were then separated by agarose gel electrophoresis using O’RangeRuler™ 50 bp DNA Ladder (Fermentas) as a length marker (Figures 1 and 2).
 | Figure 1 Representative photo of the digested COMT PCR products. |
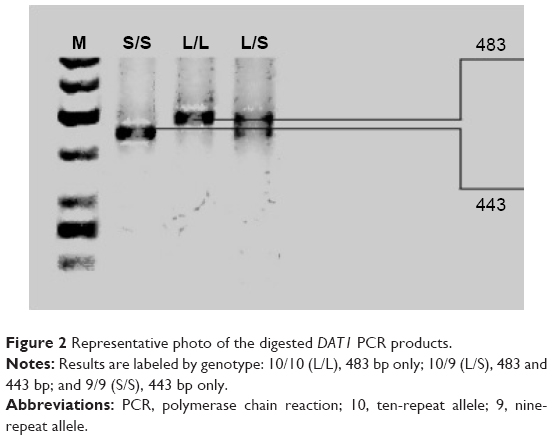 | Figure 2 Representative photo of the digested DAT1 PCR products. |
Statistical analysis
The Shapiro–Wilk test was initially used to assess the normality of the distribution of study variables. Because the distribution was non-normal, nonparametric tests were used in subsequent analysis. Statistical significance of differences was calculated using the Mann–Whitney U test, and for comparisons with three or more groups, the Kruskal–Wallis analysis of variance (ANOVA) was applied. The NIR Fisher test was used for post hoc analyses. Analysis of covariance (ANCOVA) was performed to examine interaction effects. Statistica 10.0 was used for statistical analyses, and the computer program “Utility Programs for Analysis of Genetic Linkage” (Copyright © 1988 J. Tot) was utilized to test for goodness of fit to the Hardy–Weinberg equilibrium.
Results
The first analysis sought to determine whether any significant demographic, psychological, or clinical differences were present between women and men (Table 1). Female participants scored significantly higher in BMI than males, whereas males presented with more severe depressive symptoms, as assessed by HDRS (P=0.001) and BDI (P=0.16), although the BDI results were not statistically significant. For information, there are also given numbers of individuals with particular degree of obesity.
We calculated the R-Spearman rank correlations for depressive scores and found positive significant correlations between BDI and HDRS values (r=0.84; P=0.000002). In addition, HDRS and BMI were significantly positively correlated (r=0.22; P=0.00002), but the positive correlation between BDI and BMI was not significant.
Next, we examined the relationship of DAT1 alleles to the intensity of depression symptoms and calculated BMI (Table 2). The results revealed an association between DAT1 genotypes and both depressive symptoms as well as severity of obesity. Homozygotes for the nine-repeat allele scored higher in BDI and HDRS, suggesting a greater intensity of depression, in both sexes. This allele was also associated with the highest BMI, suggesting that such patients are at a greater risk of obesity. The population was in Hardy–Weinberg equilibrium (P=0.1364).
 | Table 2 Effect of DAT1 polymorphisms on BDI, HDRS, and BMI |
A similar analysis was performed for COMT gene polymorphisms (Table 3). The data show the distribution of COMT genotypes (ie, Met/Met, Met/Val, and Val/Val). Met/Met carriers had the highest scores on depression scales. The highest BMI values were presented in individuals with the Val allele, but the associations among COMT polymorphisms and obesity were not statistically significant. The assessed population was not in Hardy–Weinberg equilibrium (P<0.05).
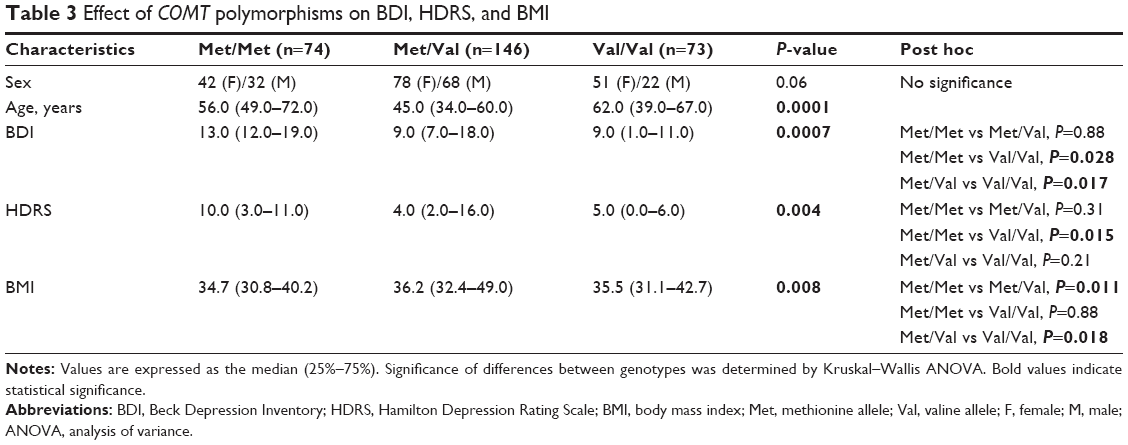 | Table 3 Effect of COMT polymorphisms on BDI, HDRS, and BMI |
Significant interaction effects on BDI and HDRS were found for age, BMI, DAT1, and COMT. There was no significance for sex (Table 4).
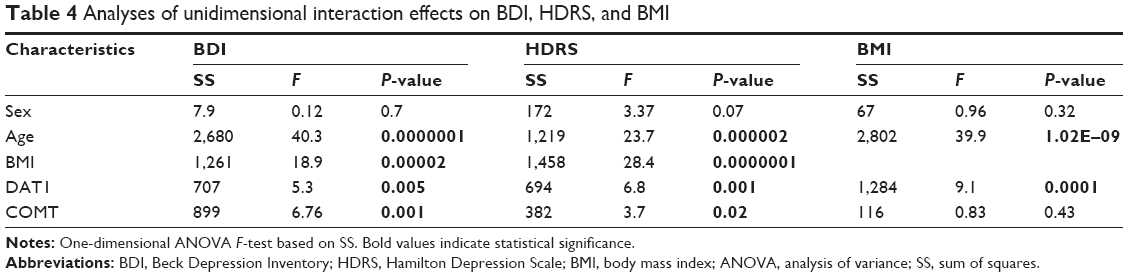 | Table 4 Analyses of unidimensional interaction effects on BDI, HDRS, and BMI |
Analyses of multidimensional interaction effects for BDI, HDRS, and BMI revealed significant relationships for sex, age, and both investigated polymorphisms (Table 5).
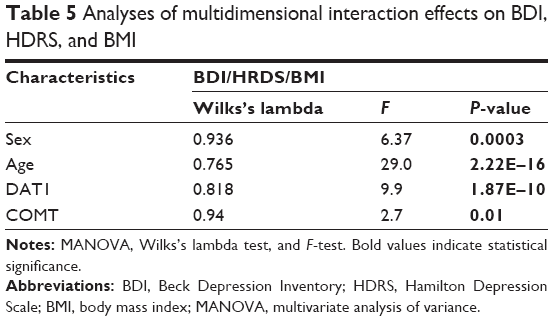 | Table 5 Analyses of multidimensional interaction effects on BDI, HDRS, and BMI |
Discussion
In this study, we detected associations between COMT and DAT1 allele polymorphisms on prevalence of depressive symptoms and intensity of BMI in obese patients. Carriers of the COMT Met allele or the nine-repeat allele of DAT1 scored higher in both BDI, which measures subjective depression symptoms, and HDRS, which is a proxy for the assessment of objective depression. Carriers of the DAT1 nine-repeat allele had higher BMI scores and thus were more severely obese. Regarding COMT polymorphism, participants who had Val allele scored higher in BMI in comparison to Met homozygotes. The highest values of adiposity concentration presented heterozygotes.
The influence of DAT1 and COMT variants on activation of the human reward system remains poorly understood. Dreher et al41 identified the interaction between COMT and DAT1 in the VS and lateral PFC during reward anticipation and in PFC and midbrain at the time of reward delivery. Carriers of the nine-repeat allele or Met/Met genotype exhibited higher activation than the carriers of the ten-repeat allele or Val/Val genotype, presumably reflecting functional changes resulting from elevated synaptic dopamine availability.
Food intake increases dopamine levels within the reward system, which are responsible for the rewarding effect of food. The reward surfeit theory of obesity postulates that greater innate reward responsiveness to food intake results in overeating and future weight gain.7 According to the incentive sensitization model, repeated intake of highly palatable foods is correlated with increased responsiveness of reward regions to cues associated with such foods. As a result, this conditioning augments food intake when these cues are presented.42 Individuals with genotypes putatively associated with higher dopamine capacity may be at a greater risk of weight gain due to overeating. Yokum et al examined the association between the multilocus genetic composite reflecting high dopamine signaling capacity and future increases in BMI. Their results showed that greater dopamine capacity was more strongly associated with COMT Val/Val and the DAT1 nine-repeat allele than with COMT Met/Met and the DAT1 ten-repeat allele. In overweight, obese, and healthy-weight participants over a 2-year follow-up, subjects with a greater number of alleles associated with high dopamine capacity exhibited elevated weight gain. The comparison of individual genotypes with elevated BMI indicated that carriers of the DAT1 nine-repeat allele exhibited even greater weight than carriers of the ten-repeat allele, which is consistent with the results of our study.20 Consumption of highly palatable food is associated with hedonic forms of eating, in which the aim of consuming is to experience reward rather than solely to meet metabolic need.43 The functional magnetic resonance imaging (fMRI) study of Yokum et al44 revealed greater responsiveness of reward region, ie, NAc, VS, and orbitofrontal cortex, to high-fat/-sugar cues and also showed that regional hyperresponsiveness increased the risk for weight gain. Another study of these authors although did not present the correlation between COMT allele and the increase in BMI but suggested that greater DA capacity associated with Val allele might be connected with a future weight gain.20 In our study, the correlation between Val allele carriers and higher BMI values compared to Met homozygotes was presented. This might be related to greater DA capacity and hence higher dopamine signaling in such individuals. Moreover, in the study of Wallace et al,45 Val/Val carriers were associated with consumption of food containing high concentrations of sugar or fat, which is described as “unhealthy”. Val allele carriers present impulsivity traits that correlate with overconsumption and food additive behavior.46 In addition, the epistatic mechanism between COMT and DAT1 genotypes described by Hersrud and Stoltenberg might explain received results. In this study, individuals presented with Met/10 and Val/9 genotypes were associated with elevated food intake, which may lead to undesired weight changes.47 In our study, the highest BMI value was shown in the group of heterozygotes. However, we presume that such scores might have resulted from the presence of Val allele, which is connected with maladaptive changes in DA signaling and leads to weight gain. As we have mentioned previously, COMT is sparsely expressed in subcortical regions, and the main determinant of dopamine termination is DAT. This may explain many inconsistencies regarding the influence of COMT polymorphisms on BMI values that surely contribute to weight gain, albeit the exact mechanism is still unknown. It should be also stressed that the effect of an individual genotype may account for only a small proportion of variance in weight gain and is interdependent on other genes as well as environmental and epigenetic factors.20,48,49
The mechanism leading to maladaptive changes within the reward circuit might involve changes within the dopaminergic synapse. Synaptic transmission depends on specific neurotransmitters within the synaptic cleft. The dopaminergic synapse consists of numerous elements on the pre- and postsynaptic membranes. The concentration of dopamine is dynamically regulated by various mechanisms, including pre- and postsynaptic signaling, presynaptic neurotransmitter release, and reuptake by DAT, as well as the distribution of target receptors on the pre- and postsynaptic membranes (D1 class and D2 class). Although DAT is primarily responsible for clearing excess dopamine, COMT also contributes to elimination of this neurotransmitter from the cleft.50
In heterologous cell studies, Kurian et al demonstrated that DAT1 mutations responsible for the inhibition of DAT reuptake activity prolonged the presence of dopamine in the synaptic cleft, resulting in the activation of mechanisms that downregulate dopamine, ie, overstimulation of D2 autoreceptors leads to the inhibition of dopamine synthesis, increases dopamine degradation within the synaptic cleft, and eventually causes downregulation or desensitization of post-synaptic dopamine receptors.51 Thus, higher dopamine concentrations might contribute to lower activity of the dopaminergic system and, in this manner, cause neuropsychiatric disorders that result from dopamine depletion.
Further to this, inhibition of DAT reuptake caused by mutations was correlated with infantile parkinsonism-dystonia, a disease that arises due to dopamine deficiency.51 The results of that study is consistent with the results of our study and might explain the higher incidence of depressive symptoms in the nine-repeat allele carriers of DAT1.
Depressive disorder is characterized by heterogeneity of symptoms, which reflect different molecular pathologies operating in different areas of the brain. The brain’s reward areas may contribute to the manifestation of depression.11 The activation of VS by dopamine release prompts not only hedonism but also euphoria. Dysphoria is one of the most prominent manifestations of depressive disorders. It is presumed to be related to disturbances of dopamine signaling within the VS.48 Current evidence indicates that dopamine depletors and antagonists reduce motivation, lower mood, and induce a depressed state.52,53 Excessive consumption in overweight patients may cause overstimulation of dopaminergic circuits and depletion of dopamine stores in the presynaptic membrane, as well as activate secondary mechanisms due to the surfeit of dopamine within synaptic clefts.
Moreover, impairment of dopamine reuptake due to reduced DAT expression might also intensify following dopamine depletion. Eventually, this phenomenon may lead to reduced dopaminergic stimulation, resulting in the development of dopamine deficiency with subsequent manifestation of depressive symptoms.
The association between COMT polymorphism and depressive disorders remains controversial in the literature of the field. Therefore, the Val158Met polymorphism may not be associated with susceptibility to depression, as reported by Opmeer et al.48 Met allele homozygotes presented with higher depressive scores in BDI and HDRS than Val homozygotes. This is consistent with other reports that the Met allele of COMT is significantly associated with vulnerability to stress and anxiety, which are major factors in the pathogenesis of depressive disorders, and therefore may be responsible for higher scores on depressive scales.11,54,55
COMT Val158Met is associated with susceptibility to greater negative emotionality during recurrent socioemotional stress. Met allele is also suggested to interact with hypothalamic–pituitary–adrenal (HPA) axis reactivity.56 HPA, which is responsible for the stress transmission, is considered to play a key role in the pathogenesis of obesity and depression. An inflammatory cytokine IL-6 activates HPA axis and is involved in both obesity and depression, which are considered to show dysregulation of HPA axis.57,58 What are the effects of stressors on the dopamine system? It depends on the duration of their impact. Obesity may be seen as the chronic inflammatory state.58 Chronic stressors affect DA system by stress-induced activation of VTA, following downregulation of neuron firing in this region, which may project to other reward-related areas. Unlike to acute stress stimuli, such condition lasts longer. This turn of events may lead to depressive symptoms such as anhedonia or amotivation. Evidence indicates that disruption in the DA system resulting in deficits in frontal cortical regions, involving reward regions, contributes to the pathogenesis of depression.13
This process elucidates the COMT contribution in the development of depression and shows the interplay between obesity and the neuropsychiatric disorders in their pathogenesis.
The association between depressive disorders and obesity has been reported in multiple studies; however, the responsible neurobiological mechanism remains unknown. ANOVA revealed a correlation between obesity and the intensity of subjective depressive symptoms in HDRS but not in BDI. Lasserre et al59 suggested that heterogeneity of depressive symptoms may explain the contradictory findings of comorbidity between depression and obesity and pointed out that depression with atypical features (eg, elevated appetite, emotional eating, and poor physical activity) is associated with increased adiposity as determined by BMI. Numerous studies reveal a positive association between atypical depression and higher BMI. The adiposity rates of those participants are significantly greater than those individuals who have never been depressed or who present with another subtype of depression.60–63 Such findings imply high comorbidity between atypical depression and adiposity and advocate to subtype depression diagnosis in future research because the atypical subtype of depression might be a strong predictor of adiposity.59
Conclusion
We found that polymorphisms of the DAT1 and COMT genes, which are involved in dopaminergic neurotransmission, were associated with a higher intensity of depressive symptoms in obese population. Individuals with the DAT1 nine-repeat allele or homozygotes of the COMT Met allele manifested more severe depressive symptoms in BDI and HDRS. Homozygotes for the DAT1 nine-repeat allele presented the highest BMI values in obese populations, indicating that the DAT1 VNTR polymorphism was significantly associated with severity of obesity. Likewise, the COMT Val158Met polymorphism was connected with BMI values, and Val/Met carriers presented the highest adiposity concentration on the contrary to Met homozygotes. Our results indicate that maladaptive changes within the reward system could increase susceptibility to depressive and eating disorders due to alterations in dopaminergic neurotransmission.
Acknowledgment
This research was supported by a grant from the Polish Ministry of Science and Higher Education (Grant No NN 402053136).
Author contributions
A Borkowska, R Junik, and A Tretyn conceived the idea for the study. M Bieliński and M Jaracz contributed to the design of the research. M Bieliński, M Jaracz, N Lesiewska, M Tomaszewska, and A Kamińska were involved in data collection. M Bieliński, M Jaracz, N Lesiewska, and A Borkowska analyzed the data. M Bieliński and N Lesiewska wrote the manuscript. A Borkowska coordinated funding for the project. All authors contributed toward data analysis, drafting and critically revising the paper and agree to be accountable for all aspects of the work.
Disclosure
The authors report no conflicts of interest in this work.
References
Who.int [homepage on the Internet]. WHO Fact Sheet No: 311. Overweight and Obesity. [updated 2016 June; cited 2016 June]. Available from: http://www.who.int/mediacentre/factsheets/fs311/en/. Accessed August 2, 2017. | ||
Bruffaerts R, Demyttenaere K, Vilagut G, et al. The relation between body mass index, mental health, and functional disability: a European population perspective. Can J Psychiatry. 2008;53(10):679–688. | ||
Cassano P, Fava M. Depression and public health: an overview. J Psychosom Res. 2002;53(4):849–857. | ||
Kessler RC, Berglund P, Demler O, et al; National Comorbidity Survey Replication. The epidemiology of major depressive disorder: results from the National Comorbidity Survey Replication (NCS-R). JAMA. 2003;289(23):3095–3105. | ||
Markkula N, Härkänen T, Nieminen T, et al. Prognosis of depressive disorders in the general population-results from the longitudinal Finnish Health 2011 study. J Affect Disord. 2011;15:687–696. | ||
Who.int [homepage on the Internet]. WHO Fact Sheet No: 369. Depression. [updated 2017 February; cited 2016 June]. Available from: http://www.who.int/mediacentre/factsheets/fs369/en/. Accessed August 2, 2017. | ||
Stice E, Spoor S, Bohon C, Small DM. Relation between obesity and blunted striatal response to food is moderated by TaqIA A1 allele. Science. 2008;322(5900):449–452. | ||
Heshmati M, Russo SJ. Anhedonia and the brain reward circuitry in depression. Curr Behav Neurosci Rep. 2015;2(3):146–153. | ||
Baik JH. Dopamine signaling in reward-related behaviors. Front Neural Circuits. 2013;7:152. | ||
Gatt JM, Burton KL, Williams LM, Schofield PR. Specific and common genes implicated across major mental disorders: a review of meta-analysis studies. J Psychiatr Res. 2015;60:1–13. | ||
Nestler EJ. Role of the brain’s reward circuitry in depression: transcriptional mechanisms. Int Rev Neurobiol. 2015;124:151–170. | ||
Stice E, Yokum S, Blum K, Bohon C. Weight gain is associated with reduced striatal response to palatable food. J Neurosci. 2010;30(39):13105–13109. | ||
Grace AA. Dysregulation of the dopamine system in the pathophysiology of schizophrenia and depression. Nat Rev Neurosci. 2016;17(8):524–532. | ||
Davis C, Loxton NJ, Levitan RD, Kaplan AS, Carter JC, Kennedy JL. ‘Food addiction’ and its association with a dopaminergic multilocus genetic profile. Physiol Behav. 2013;118:63–69. | ||
Huang CC, Lu RB, Shih MC, Yen CH, Huang SY. Association study of the dopamine transporter gene with personality traits and major depressive disorder in the Han Chinese population. Pharmacogenet Genomics. 2011;21(2):94–97. | ||
Felten A, Montag C, Markett S, Walter NT, Reuter M. Genetically determined dopamine availability predicts disposition for depression. Brain Behav. 2011;1(2):109–118. | ||
Joyce PR, Stephenson J, Kennedy M, Mulder RT, McHugh PC. The presence of both serotonin 1A receptor (HTR1A) and dopamine transporter (DAT1) gene variants increase the risk of borderline personality disorder. Front Genet. 2014;4:313. | ||
Opmeer EM, Kortekaas R, Van Tol MJ, et al. Influence of COMT val158met genotype on the depressed brain during emotional processing and working memory. PLoS One. 2013;8(9):e73290. | ||
Massat I, Souery D, Del-Favero J, et al. Association between COMT (Val158Met) functional polymorphism and early onset in patients with major depressive disorder in a European multicenter genetic association study. Mol Psychiatry. 2005;10(6):598–605. | ||
Yokum S, Marti CN, Smolen A, Stice E. Relation of the multilocus genetic composite reflecting high dopamine signaling capacity to future increases in BMI. Appetite. 2015;87:38–45. | ||
Thaler L, Groleau P, Badawi G, et al. Epistatic interactions implicating dopaminergic genes in bulimia nervosa (BN): relationships to eating- and personality-related psychopathology. Prog Neuropsychopharmacol Biol Psychiatry. 2012;39(1):120–128. | ||
Kring SI, Werge T, Holst C, et al. Polymorphisms of serotonin receptor 2A and 2C genes and COMT in relation to obesity and type 2 diabetes. PLoS One. 2009;4(8):e6696. | ||
Sikora M, Gese A, Czypicki R, et al. Correlations between polymorphisms in genes coding elements of dopaminergic pathways and body mass index in overweight and obese women. Endokrynol Pol. 2013;64(2):101–107. | ||
Uzun M, Saglar E, Kucukyildirim S, Erdem B, Unlu H, Mergen H. Association of VNTR polymorphisms in DRD4, 5-HTT and DAT1 genes with obesity. Arch Physiol Biochem. 2015;121(2):75–79. | ||
Epstein LH, Temple JL, Neaderhiser BJ, Salis RJ, Erbe RW, Leddy JJ. Food reinforcement, the dopamine D2 receptor genotype, and energy intake in obese and nonobese humans. Behav Neurosci. 2007;121(5):877–886. | ||
Hall H, Halldin C, Guilloteau D, et al. Visualization of the dopamine transporter in the human brain postmortem with the new selective ligand [125I]PE2I. Neuroimage. 1999;9(1):108–116. | ||
Sander T, Harms H, Podschus J, et al. Allelic association of a dopamine transporter gene polymorphism in alcohol dependence with withdrawal seizures or delirium. Biol Psychiatry. 1997;41(3):299–304. | ||
Jorm AF, Henderson AS, Jacomb PA, et al. Association of smoking and personality with a polymorphism of the dopamine transporter gene: results from a community survey. Am J Med Genet. 2000;96(3):331–344. | ||
Vandenbergh DJ, Persico AM, Hawkins AL, et al. Human dopamine transporter gene (DAT1) maps to chromosome 5p15.3 and displays a VNTR. Genomics. 1992;14(4):1104–1106. | ||
Mill J, Asherson P, Browes C, D’Souza U, Craig I. Expression of the dopamine transporter gene is regulated by the 3′ UTR VNTR: evidence from brain and lymphocytes using quantitative RT-PCR. Am J Med Genet. 2002;114(8):975–979. | ||
Faraone SV, Spencer TJ, Madras BK, Zhang-James Y, Biederman J. Functional effects of dopamine transporter gene genotypes on in vivo dopamine transporter functioning: a meta-analysis. Mol Psychiatry. 2014;19(8):880–889. | ||
Brookes KJ, Neale BM, Sugden K, Khan N, Asherson P, D’Souza UM. Relationship between VNTR polymorphisms of the human dopamine transporter gene and expression in post-mortem midbrain tissue. Am J Med Genet B Neuropsychiatr Genet. 2007;144B(8):1070–1078. | ||
Van Dyck CH, Malison RT, Jacobsen LK, et al. Increased dopamine transporter availability associated with the 9-repeat allele of the SLC6A3 gene. J Nucl Med. 2005;46(5):745–751. | ||
Van de Giessen E, De Win MM, Tanck MW, Van den Brink W, Baas F, Booij J. Striatal dopamine transporter availability associated with polymorphisms in the dopamine transporter gene SLC6A3. J Nucl Med. 2009;50(1):45–52. | ||
Karoum F, Chrapusta SJ, Egan MF. 3-Methoxytyramine is the major metabolite of released dopamine in the rat frontal cortex: reassessment of the effects of antipsychotics on the dynamics of dopamine release and metabolism in the frontal cortex, nucleus accumbens, and striatum by a simple two pool model. J Neurochem. 1994;63(3):972–979. | ||
Creveling CR. The role of catechol-O-methyltransferase in the inactivation of catecholestrogen. Cell Mol Neurobiol. 2003;23(3):289–291. | ||
Meyer-Lindenberg A, Weinberger DR. Intermediate phenotypes and genetic mechanisms of psychiatric disorders. Nat Rev Neurosci. 2006;7(10):818–827. | ||
Chen J, Lipska BK, Halim N, et al. Functional analysis of genetic variation in catechol-O-methyltransferase (COMT): effects on mRNA, protein, and enzyme activity in postmortem human brain. Am J Hum Genet. 2004;75(5):807–821. | ||
Lotta T, Vidgren J, Tilgmann C, et al. Kinetics of human soluble and membrane-bound catechol O-methyltransferase: a revised mechanism and description of the thermolabile variant of the enzyme. Biochemistry. 1995;34(13):4202–4210. | ||
Lahiri DK, Schnabel B. DNA isolation by a rapid method from human blood samples: effects of MgCl2, EDTA, storage time, and temperature on DNA yield and quality. Biochem Genet. 1993;31(7–8):321–328. | ||
Dreher JC, Kohn P, Kolachana B, Weinberger DR, Berman KF. Variation in dopamine genes influences responsivity of the human reward system. Proc Natl Acad Sci U S A. 2009;106(2):617–622. | ||
Berridge KC, Ho CY, Richard JM, DiFeliceantonio AG. The tempted brain eats: pleasure and desire circuits in obesity and eating disorders. Brain Res. 2010;1350:43–64. | ||
Lowe MR, Butryn ML. Hedonic hunger: a new dimension of appetite? Physiol Behav. 2007;91(4):432–439. | ||
Yokum S, Ng J, Stice E. Attentional bias to food images associated with elevated weight and future weight gain: an fMRI study. Obesity (Silver Spring). 2011;19(9):1775–1783. | ||
Wallace DL, Aarts E, d’Oleire Uquillas F, et al. Genotype status of the dopamine-related catechol-O-methyltransferase (COMT) gene corresponds with desirability of “unhealthy” foods. Appetite. 2015;92:74–80. | ||
Murphy CM, Stojek MK, MacKillop J. Interrelationships among impulsive personality traits, food addiction, and Body Mass Index. Appetite. 2014;73:45–50. | ||
Hersrud SL, Stoltenberg SF. Epistatic interaction between COMT and DAT1 genes on eating behavior: a pilot study. Eat Behav. 2009;10(2):131–133. | ||
Opmeer EM, Kortekaas R, Aleman A. Depression and the role of genes involved in dopamine metabolism and signalling. Prog Neurobiol. 2010;92(2):112–133. | ||
Moriam S, Sobhani ME. Epigenetic effect of chronic stress on dopamine signaling and depression. Genet Epigenet. 2013;5:11–16. | ||
Blackstone C. Infantile parkinsonism-dystonia: a dopamine “transportopathy”. J Clin Invest. 2009;119(6):1455–1458. | ||
Kurian MA, Zhen J, Cheng SY, et al. Homozygousloss-of function mutations in the gene encoding the dopamine transporter are associated with infantile parkinsonism-dystonia. J Clin Invest. 2009;119(6):1595–1603. | ||
Bressan RA, Costa DC, Jones HM, Ell PJ, Pilowsky LS. Typical antipsychotic drugs – D(2) receptor occupancy and depressive symptoms in schizophrenia. Schizophr Res. 2002;56(1–2):31–36. | ||
Verhoeff NP, Christensen BK, Hussey D, et al. Effects of catecholamine depletion on D2 receptor binding, mood, and attentiveness in humans: a replication study. Pharmacol Biochem Behav. 2003;74(2):425–432. | ||
Enoch MA, Xu K, Ferro E, Harris CR, Goldman D. Genetic origins of anxiety in women: a role for a functional catechol-O-methyltransferase polymorphism. Psychiatr Genet. 2003;13(1):33–41. | ||
Antypa N, Drago A, Serretti A. The role of COMT gene variants in depression: bridging neuropsychological, behavioral and clinical phenotypes. Neurosci Biobehav Rev. 2013;37(8):1597–1610. | ||
Montirosso R, Provenzi L, Tavian D, Missaglia S, Raggi ME, Borgatti R. COMT(val158met) polymorphism is associated with behavioral response and physiologic reactivity to socio-emotional stress in 4-month-old infants. Infant Behav Dev. 2016;45(ptA):71–82. | ||
Bornstein SR, Schuppenies A, Wong ML, Licinio J. Approaching the shared biology of obesity and depression: the stress axis as the locus of gene-environment interactions. Mol Psychiatry. 2006;11(10):892–902. | ||
Luppino FS, de Wit LM, Bouvy PF, et al. Overweight, obesity, and depression: a systematic review and meta-analysis of longitudinal studies. Arch Gen Psychiatry. 2010;67(3):220–229. | ||
Lasserre AM, Glaus J, Vandeleur CL, et al. Depression with atypical features and increase in obesity, body mass index, waist circumference, and fat mass: a prospective, population based study. JAMA Psychiatry. 2014;71(8):880–888. | ||
Lamers F, De Jonge P, Nolen WA, et al. Identifying depressive subtypes in a large cohort study: results from the Netherlands Study of Depression and Anxiety (NESDA). J Clin Psychiatry. 2010;71(12):1582–1589. | ||
Levitan RD, Davis C, Kaplan AS, Arenovich T, Phillips DI, Ravindran AV. Obesity comorbidity in unipolar major depressive disorder: refining the core phenotype. J Clin Psychiatry. 2012;73(8):1119–1124. | ||
Hasler G, Pine DS, Gamma A, et al. The associations between psychopathology and being overweight: a 20-year prospective study. Psychol Med. 2004;34(6):1047–1057. | ||
Glaus J, Vandeleur C, Gholam-Rezaee M, et al. Atypical depression and alcohol misuse are related to the cardiovascular risk in the general population. Acta Psychiatr Scand. 2013;128(4):282–293. |
 © 2017 The Author(s). This work is published and licensed by Dove Medical Press Limited. The
full terms of this license are available at https://www.dovepress.com/terms
and incorporate the Creative Commons Attribution
- Non Commercial (unported, 3.0) License.
By accessing the work you hereby accept the Terms. Non-commercial uses of the work are permitted
without any further permission from Dove Medical Press Limited, provided the work is properly
attributed. For permission for commercial use of this work, please see paragraphs 4.2 and 5 of our Terms.
© 2017 The Author(s). This work is published and licensed by Dove Medical Press Limited. The
full terms of this license are available at https://www.dovepress.com/terms
and incorporate the Creative Commons Attribution
- Non Commercial (unported, 3.0) License.
By accessing the work you hereby accept the Terms. Non-commercial uses of the work are permitted
without any further permission from Dove Medical Press Limited, provided the work is properly
attributed. For permission for commercial use of this work, please see paragraphs 4.2 and 5 of our Terms.