Back to Journals » Cancer Management and Research » Volume 10
Association between body mass index and breast cancer risk: evidence based on a dose–response meta-analysis
Authors Liu K, Zhang W, Dai Z ![]() , Wang M, Tian T, Liu X, Kang H, Guan H, Zhang S, Dai Z
, Wang M, Tian T, Liu X, Kang H, Guan H, Zhang S, Dai Z ![]()
Received 22 June 2017
Accepted for publication 15 December 2017
Published 18 January 2018 Volume 2018:10 Pages 143—151
DOI https://doi.org/10.2147/CMAR.S144619
Checked for plagiarism Yes
Review by Single anonymous peer review
Peer reviewer comments 3
Editor who approved publication: Dr Antonella D'Anneo
Kang Liu,1,* Weining Zhang,2,* Zhiming Dai,3,* Meng Wang,1,* Tian Tian,1 Xinghan Liu,1 Huafeng Kang,1 Haitao Guan,1 Shuqun Zhang,1 Zhijun Dai1
1Department of Oncology, Second Affiliated Hospital of Xi’an Jiaotong University, 2Department of Surgical Chest and Oncology, Xian XD Group Hospital, 3Department of Hematology, Second Affiliated Hospital of Xi’an Jiaotong University, Xi’an, Shaanxi, China
*These authors have contributed equally to this work
Introduction: Breast cancer is the most common cancer in women worldwide. The association between body mass index (BMI) and breast cancer risk has been paid more attention in the past few years, but the findings are still controversial. To obtain a more reliable conclusion, we performed a dose–response meta-analysis on 12 prospective cohort studies comprising 22,728,674 participants.
Methods: Linear and nonlinear trend analyses were conducted to explore the dose–response relationship between BMI and breast cancer risk. The summary relative risk (SRR) and 95% confidence intervals (CIs) were used to evaluate the cancer risk.
Results: The overall results showed a weak positive association between a 5-unit increase in BMI and breast cancer risk, indicating that a 5 kg/m2 increase in BMI corresponded to a 2% increase in breast cancer risk (SRR: 1.02, 95% CI: 1.01–1.04, p<0.001). Notably, further subgroup meta-analysis found that higher BMI could be a protective factor of breast cancer risk for premenopausal women (SRR: 0.98, 95% CI: 0.96–0.99, p<0.001). In addition, the dose–response result demonstrated that there was a linear association between BMI and breast cancer risk (Pnonlinearity=0.754).
Conclusion: In summary, this dose–response meta-analysis of prospective cohort studies showed that every 5 kg/m2 increase in BMI corresponded to a 2% increase in breast cancer risk in women. However, higher BMI could be a protective factor in breast cancer risk for premenopausal women. Further studies are necessary to verify these findings and elucidate the pathogenic mechanisms.
Keywords: BMI, breast, dose–response, cancer, menopausal
Introduction
Breast cancer is the most common cancer in women worldwide.1 The incidence of breast cancer could be influenced by complex factors such as environmental, genetic, and lifestyle factors.2 Since breast cancer accounts for the largest proportion of cancer in women globally, research on the possible associated risk factors of breast cancer is necessary.
For both overweight and obese people, excess body weight is generally recognized as a significant risk factor for many common cancers.3 Body mass index (BMI), defined as body weight in kilograms divided by the square of height in meters, is one of the most commonly used anthropometric measurements.4 The association between BMI and breast cancer risk has received much attention in the past few years, but the findings have still been controversial.5–16 In addition, no study has yet examined the exact dose–response relationship between BMI and breast cancer risk. Therefore, we aimed to quantify the risk of breast cancer associated with an incremental increase in BMI by performing a dose–response meta-analysis of prospective cohort studies.
Methods
Search strategy
Two authors independently and systematically searched PubMed, Web of Science, Chinese National Knowledge Infrastructure (CNKI), and WanFang databases through April 1, 2017. Research articles were selected using the following terms: “body mass index”, “BMI”, “obesity”, “overweight”, “breast cancer”, or “breast carcinoma”. The search was focused on human studies, without any other restriction. We also used the “Related Articles” option in PubMed to identify additional studies of the same topic. The reference lists of the retrieved articles were also screened.
Selection criteria
We included studies that met the following criteria: 1) an original article; 2) a prospective cohort study; 3) determining BMI at baseline and then recording the incidence of breast cancer during follow-up; 4) risk estimate as hazard ratio (HR), relative risk (RR), or odds ratio (OR) with corresponding 95% confidence intervals (CIs) for more than three categories of BMI or providing sufficient data to estimate them; and 5) RR and corresponding 95% CI with adjustment for age. If the studies were reported from the same or overlapping cohorts, only the most recent and informative one was included. Discrepancies between two investigators were solved by discussion.
Data extraction
Two investigators independently extracted data, which were cross-checked by another investigator. We extracted the following items from each article: first author, year of publication, geographic location, follow-up duration, mean age, number of cases, sample size, assessment of BMI, and menopausal status. If one study reported several risk estimates, we used the one from the main multivariable model that included more adjusted confounders. If the study did not provide total person-years or total participants for each group, we estimated them using the method carried out by Aune et al.4 In addition, the quality of the included studies was assessed by the Newcastle–Ottawa scale.
Statistical analysis
Summary RRs and 95% CIs for a 5-unit increment in BMI were estimated using a random-effects model.17 The average of the natural logarithm of the RRs was estimated, and the RR from each study was weighted by the inverse of its variance. A two-tailed p-value <0.1 was considered statistically significant. Heterogeneity among studies was assessed using the Q or I2 statistics, which tested total variation across studies that was attributable to heterogeneity rather than chance.18
A dose–response analysis was conducted based on the category data of BMI, number of cases, person-years, and logarithm of RRs and its corresponding standard error. The eligible studies should provide sufficient information across at least three categories of exposure. Among the studies, we assigned a median BMI for each category. For the open-ended upper category, the amplitude was assumed to be the same as the previous one. We transformed category-specific risk estimates into estimates of the RR associated with every 5 kg/m2 increase in BMI by using the method of generalized least-squares for trend estimates.19 The potential linear dose–response relationship between BMI and breast cancer risk was examined using a two-stage hierarchical regression model.20 Data were modeled with random-effects restricted cubic spline models with four knots. The Greenland and Longnecker method was used to estimate the covariances of multivariable-adjusted relative risks.21
Sources of heterogeneity were explored by subgroup analyses based on menopausal status, assessment of BMI, geographic location, follow-up duration, and sample size. Sensitivity analyses were conducted to clarify whether the results were affected by one single study by repeating the meta-analysis after omitting one study at a time. We inspected the asymmetry of the funnel plot with Egger’s test for publication bias. All statistical analyses were performed with Stata statistical software, version 12.0.
Results
Study selection and characteristics
A flow chart of our selection process is shown in Figure 1. Initially, 324 articles were identified via the database search. Of these, 38 articles were excluded for duplication. After reading the titles and abstracts of all the articles, 260 articles were excluded. Furthermore, after searching through the full-texts of the remaining articles, an additional 14 articles were excluded, including eight articles that contained no useful data and six articles that had re-reported data. Finally, a total of 12 articles (involving 19,480 cases) with a sample size of 22,728,674 participants were included in our meta-analysis.
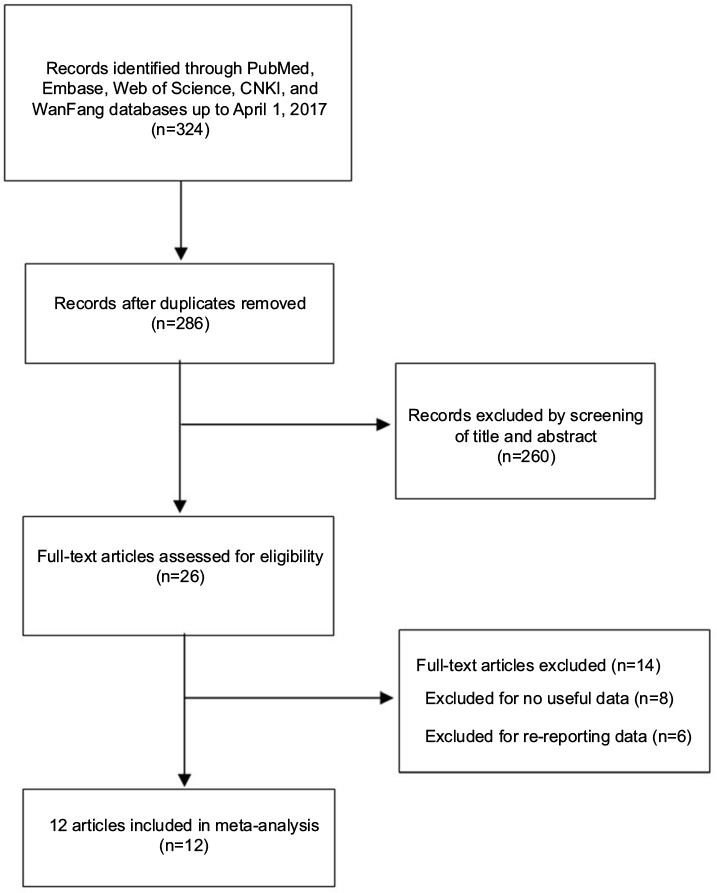 | Figure 1 Flow chart of included studies for the meta-analysis. Abbreviation: CNKI, China National Knowledge Infrastructure. |
The main characteristics of the included studies are shown in Table 1. All studies were published from 2004 to 2014, with the mean duration of follow-up varying from 4.29 to 10.8 years. The sample size ranged from 15,054 to 1,222,630. Among the included studies, four were conducted in Europe,10,12,13,16 two in America,5,14 five in Asia,6–9,11 and one in Austria.15 Of the 14 studies, BMI was either self-reported or measured by investigators. The patient menopausal status of all included studies was premenopausal, postmenopausal, or mixed. In all, 12 articles were published in English and two were in Chinese.6,11 The Newcastle–Ottawa scale was applied to assess the quality of the included studies, and the results showed all the studies were of high quality, with a Newcastle–Ottawa scale score of ≥7.22
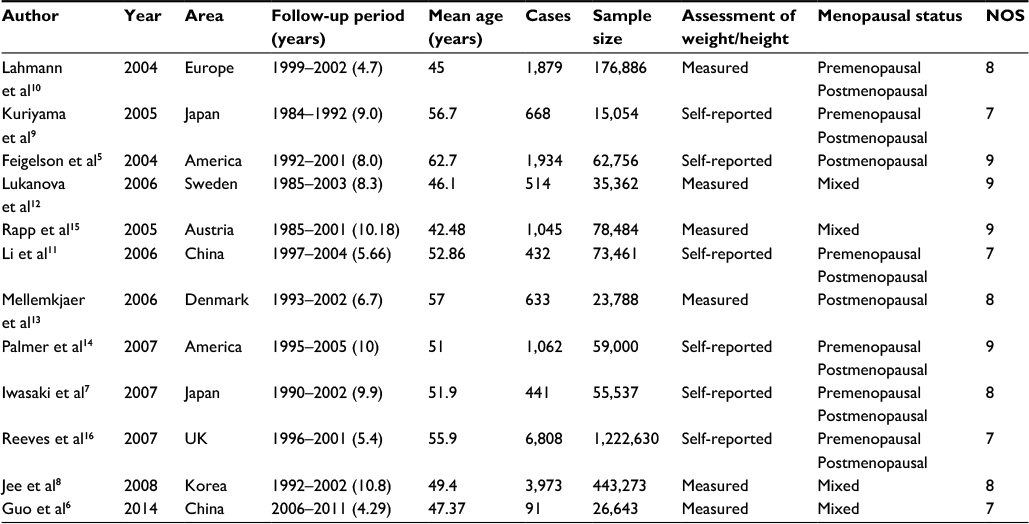 | Table 1 Characteristics of prospective cohort studies included in the meta-analysis Abbreviation: NOS, Newcastle–Ottawa scale. |
Overall analyses
As shown in Figure 2, the overall meta-analysis in the random-effects model showed a weak positive association between a 5-unit BMI increase and breast cancer risk, indicating that a 5 kg/m2 increase in BMI corresponded to a 2% increase in breast cancer risk (summary relative risk [SRR]: 1.02, 95% CI: 1.01–1.04, p=0.00). There was evidence of heterogeneity among all studies (I2=74.2%, pheterogeneity=0.00). There was also no evidence of publication bias with Egger’s test (p=0.74), and the funnel plot showed no sign of asymmetry by visual inspection. In sensitivity analyses excluding one study at a time, the SRR in the overall analysis ranged from 1.02 (95% CI: 1.00–1.05) when the study by Reeves et al16 was excluded to 1.03 (95% CI: 1.02–1.03) when the study by Palmer et al14 was excluded, which indicated that our results are statistically robust.
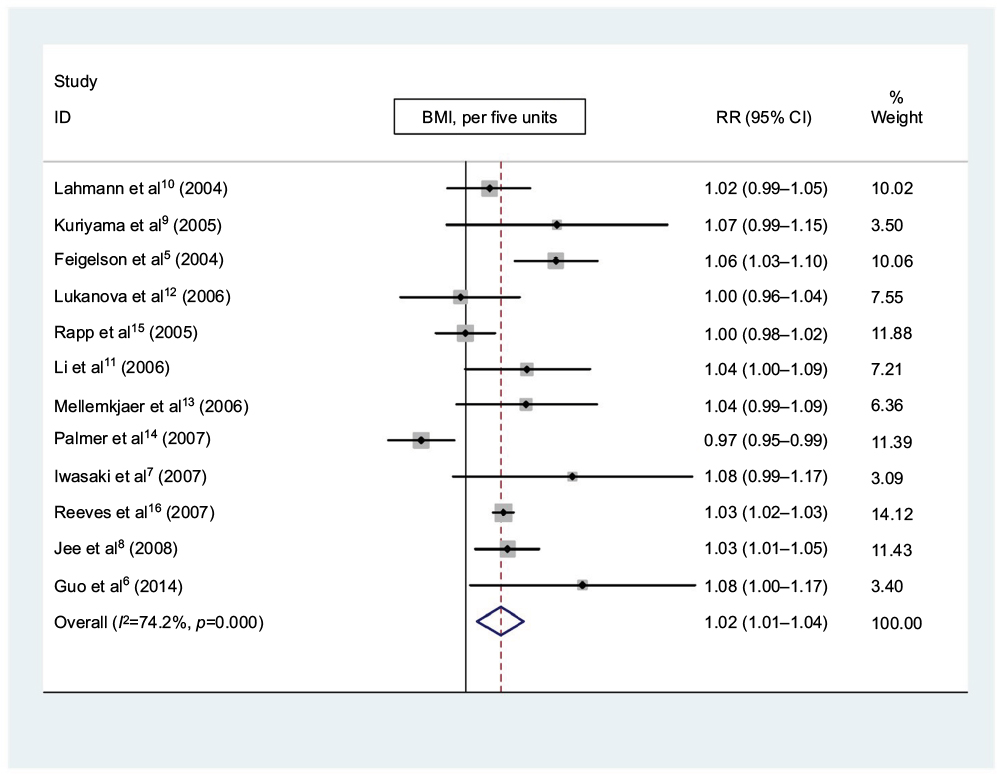 | Figure 2 Meta-analysis of the association between BMI increment (per five units) and breast cancer risk. Note: Weights are from random-effects analysis. Abbreviations: BMI, body mass index; RR, relative risk; CI, confidence interval. |
Subgroup analyses
As shown in Table 2, when studies were stratified by menopausal status, assessment of BMI, geographic location, follow-up duration, and sample size, the results were generally consistent with the overall result, except for premenopausal studies (SRR: 0.98, 95% CI: 0.96–0.99, p=0.00). This indicates that higher BMI could be a protective factor for breast cancer risk in premenopausal women. There was no evidence of either heterogeneity (I2=0%, pheterogeneity=0.62) or publication bias (p for Egger’s test=0.85) in premenopausal studies (Figure 3).
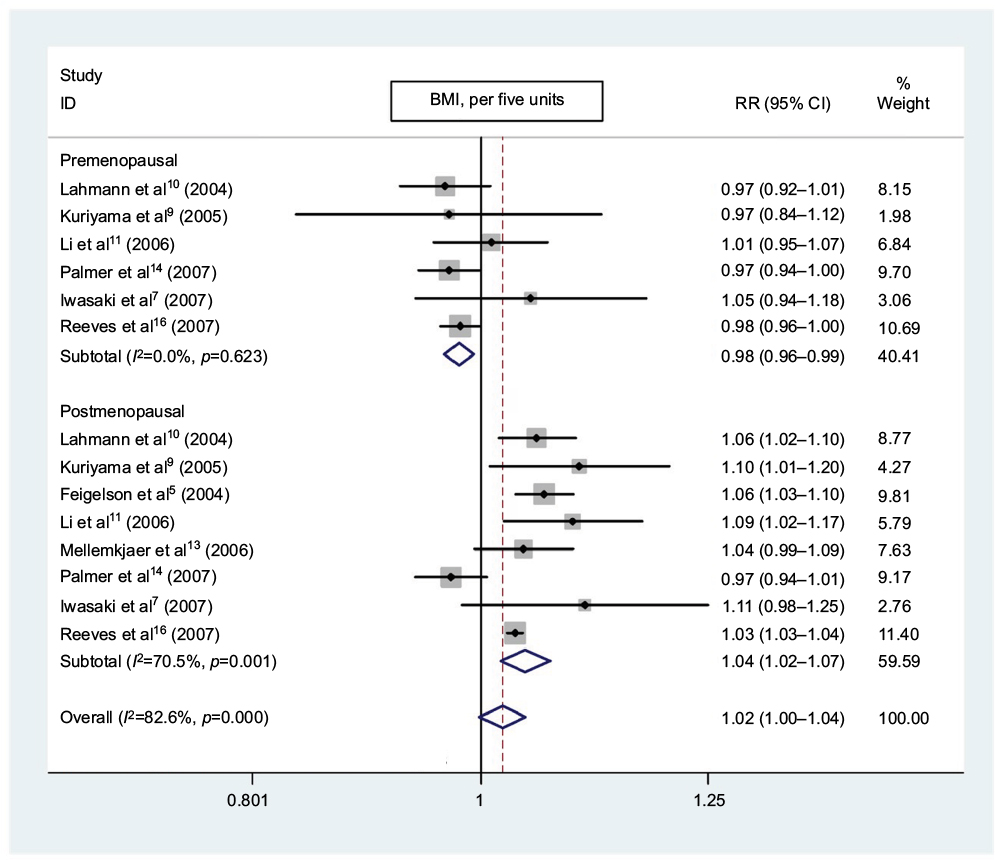 | Figure 3 Subgroup analysis of the association between BMI increment (per five units) and breast cancer risk stratified by menopausal status. Note: Weights are from random-effects analysis. Abbreviations: BMI, body mass index; RR, relative risk; CI, confidence interval. |
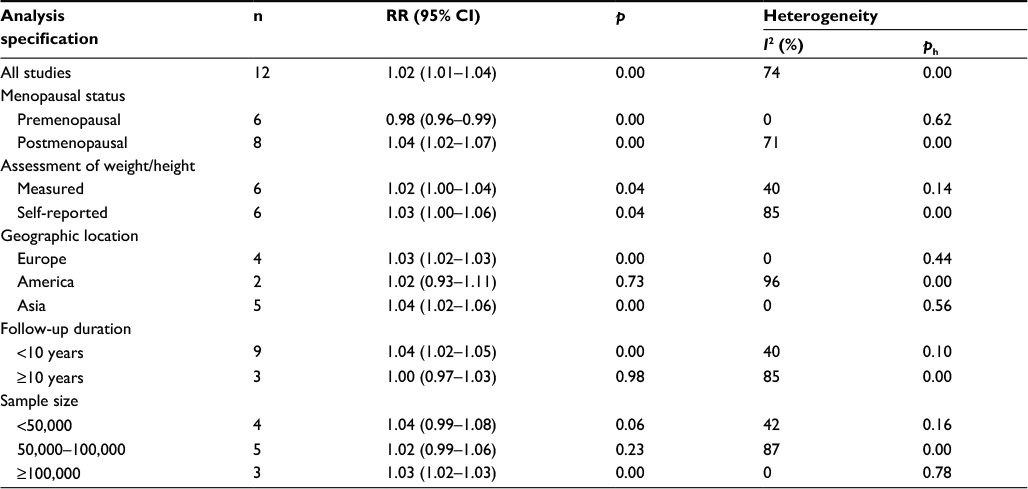 | Table 2 Subgroup analyses of BMI and breast cancer Abbreviations: BMI, body mass index; RR, relative risk; CI, confidence interval; ph, p for heterogeneity. |
Dose–response analyses
As shown in Figure 4, there was evidence of a linear association between BMI and breast cancer risk (pnonlinearity=0.754). When stratified by menopausal status (Figure 5), the association between BMI and breast cancer risk remained linear for premenopausal and postmenopausal women (pnonlinearity=0.892 and pnonlinearity=0.630, respectively).
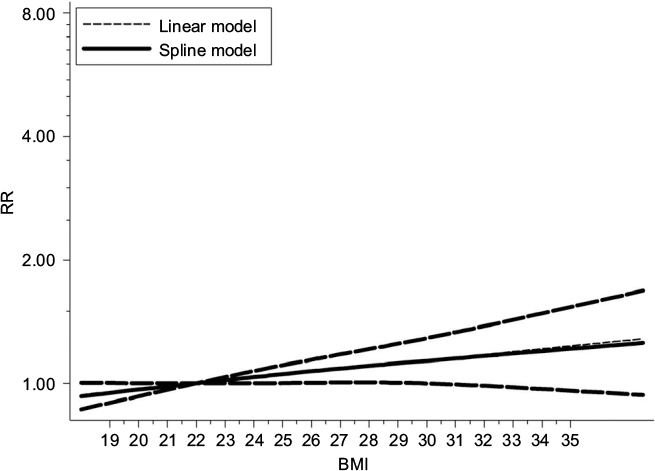 | Figure 4 Dose–response meta-analysis of BMI and breast cancer risk (linear and nonlinear models). Abbreviations: BMI, body mass index; RR, relative risk. |
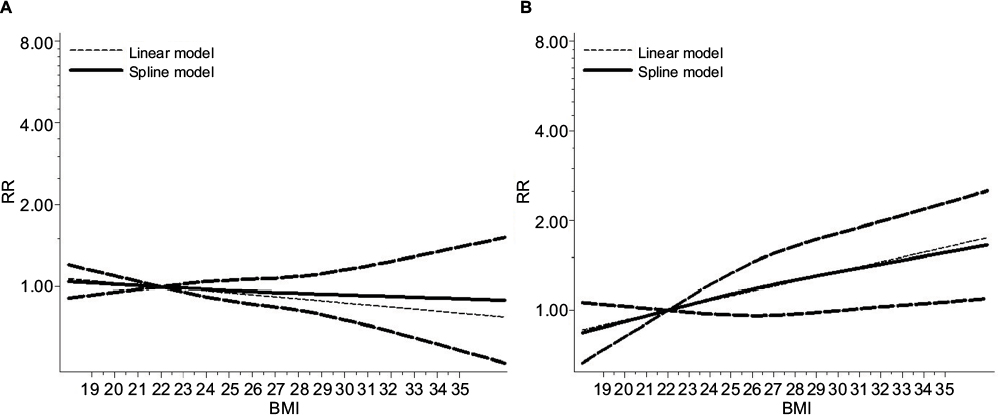 | Figure 5 Dose–response meta-analysis of BMI and breast cancer risk stratified by menopausal status (linear and nonlinear models). Note: (A) Premenopausal women; (B) postmenopausal women. Abbreviations: BMI, body mass index; RR, relative risk. |
Discussion
It has been reported that BMI is associated with the risk of many solid cancers. Excess body weight is known to correlate with cancers in certain populations, including colorectal cancer, renal cancer, pancreatic cancer, and so on.23 However, evidence for breast cancer is controversial. The study by Jee et al8 found that higher BMI could increase breast cancer risk in the Korean population. Conversely, the study by Palmer et al14 demonstrated that lower BMI was associated with breast cancer risk. However, no studies have examined the exact dose–response relationship between BMI and breast cancer risk before. Unlike previous studies and recent evidence, our meta-analysis aimed to explore the dose–response relationship between BMI and breast cancer risk.
In this updated meta-analysis, 12 prospective cohort studies comprising 22,728,674 participants were included to explore the dose–response relationship between BMI and breast cancer risk. Overall, the dose–response meta-analysis across all the studies in the random-effects model showed that there was a potential linear association between BMI and breast cancer risk, and the risk increased by 2% for each 5 kg/m2 increase in BMI. Notably, further subgroup meta-analysis found that the relationship between BMI and breast cancer risk differed based on menopausal status. For premenopausal women, higher BMI could decrease breast cancer risk. However, higher BMI is associated with increased breast cancer risk in postmenopausal women.
The exact mechanism behind the association between BMI and breast cancer risk is uncertain, but there are some potential hypotheses. The positive association between BMI and breast cancer risk in postmenopausal women was speculated to result from the higher level of estrogen derived from the aromatization of androstenedione within the larger fat reserves of women of higher BMI.24 The negative relationship between higher BMI and breast cancer risk in premenopausal women probably came from a protective effect of increased weight in the early premenopausal years, which is a predictor of longer anovulatory cycles and a lower level of progesterone and estrogen.25 However, these hypotheses still need to be verified by further studies of carcinogenic mechanisms in the future.
Heterogeneity was detected in this meta-analysis in overall analysis among different studies, and it was possibly derived from many confounding factors such as menopausal status, assessment of BMI, geographic location, and sample size. To investigate the sources of the observed heterogeneity among the studies, we conducted subgroup analyses stratified by these confounding factors. The results of the subgroup analyses were generally consistent with the overall results, except for women of a different menopausal status, which indicated that menopausal status could be the main source of heterogeneity. In the premenopausal subgroup analysis, the heterogeneity analysis result (I2=0%, pheterogeneity=0.62) verified our hypothesis as well. However, the heterogeneity in the postmenopausal group could be caused by the presence of different ethnicities. Publication bias and sensitivity analyses showed that our results were robust.
Our meta-analysis has some strengths. Because our meta-analysis was based on prospective cohort studies, recall bias and selection bias were not likely to affect the results in our study. Prospective cohort studies could also avoid the reliance on the use of proxy respondents, which have been shown to be very common in case–control studies as a result of the poor survival rates of malignant cancer.17 In addition, the included studies in our meta-analysis had large sample sizes (19,480 cases, 22,728,674 participants) and relatively long follow-up durations, so we had the statistical power to detect weak or moderate associations. We also had the statistical power to detect significant associations in different subgroups stratified by menopausal status, assessment of BMI, geographic location, and sample size. Notably, we examined the exact dose–response relationship between BMI and breast cancer risk for the first time to our knowledge in a meta-analysis.
Several limitations of this meta-analysis also should be acknowledged. First, after observing heterogeneity across studies, we determined the main source of heterogeneity by subgroup analyses. Nevertheless, heterogeneity still existed in the postmenopausal group, which could be explained by some other factors. Second, although all the included studies in our meta-analysis were prospective cohort studies, differences among geographic location and follow-up duration and end point may affect the estimate of the true effects. Third, waist, hip, and lean muscle mass are very related to BMI, and we wanted to analyze these factors. However, we were unable to because of the unavailability of relevant data in many studies. Fourth, half of the studies were based on self-reported weight and height; thus, there might be some underreporting or overreporting. Fortunately, a strong correlation between self-reported and measured weight and height have been found in most studies.26,27 In addition, the conclusion of our meta-analysis was limited to Europe, America, and Asia and may not necessarily be generalized to other regions such as Africa and Latin America.
Summary
This dose–response meta-analysis of prospective cohort studies showed that every 5 kg/m2 increase in BMI corresponded to a 2% increase in breast cancer risk in women. However, higher BMI could be a protective factor of breast cancer risk for premenopausal women. Further studies are necessary to verify these findings and elucidate the pathogenic mechanisms.
Acknowledgments
The authors thank Yi Zheng, Shanli Li, Yujiao Deng, and Linghui Zhou for their contribution. This work was supported by the National Natural Science Foundation of China (No. 81471670/81274136), the China Postdoctoral Science Foundation funded Projects (No. 2014M560791/2015T81037) and the Key research and development plan, Shaanxi Province, People’s Republic of China (2017ZDXM-SF-066).
Disclosure
The authors report no conflicts of interest in this work.
References
Cardoso F, Harbeck N, Fallowfield L, Kyriakides S, Senkus E. Locally recurrent or metastatic breast cancer: ESMO clinical practice guidelines for diagnosis, treatment and follow-up. Ann Oncol. 2012;23(suppl 7): vii11–vii19. | ||
Lichtenstein P, Holm NV, Verkasalo PK, et al. Environmental and heritable factors in the causation of cancer – analyses of cohorts of twins from Sweden, Denmark, and Finland. N Engl J Med. 2000;343(2):78–85. | ||
Renehan AG, Tyson M, Egger M, Heller RF, Zwahlen M. Body-mass index and incidence of cancer: a systematic review and meta-analysis of prospective observational studies. Lancet. 2008;371(9612):569–578. | ||
Aune D, Greenwood DC, Chan DSM, et al. Body mass index, abdominal fatness and pancreatic cancer risk: a systematic review and non-linear dose–response meta-analysis of prospective studies. Ann Oncol. 2012;23(4):843–852. | ||
Feigelson HS, Jonas CR, Teras LR, Thun MJ, Calle EE. Weight gain, body mass index, hormone replacement therapy, and postmenopausal breast cancer in a large prospective study. Cancer Epidemiol Biomarkers Prev. 2004;13(2):220–224. | ||
Guo L, Li N, Wang G, et al. [Body mass index and cancer incidence:a prospective cohort study in northern China]. Zhonghua liu xing bing xue za zhi. 2014;35(3):231–236. Chinese. | ||
Iwasaki M, Otani T, Inoue M, Sasazuki S, Tsugane S; Japan Public Health Center-Based Prospective Study Group. Body size and risk for breast cancer in relation to estrogen and progesterone receptor status in Japan. Ann Epidemiol. 2007;17(4):304–312. | ||
Jee SH, Yun JE, Park EJ, et al. Body mass index and cancer risk in Korean men and women. Int J Cancer. 2008;123(8):1892–1896. | ||
Kuriyama S, Tsubono Y, Hozawa A, et al. Obesity and risk of cancer in Japan. Int J Cancer. 2005;113(1):148–157. | ||
Lahmann PH, Hoffmann K, Allen N, et al. Body size and breast cancer risk: findings from the European Prospective Investigation into cancer and nutrition (EPIC). Int J Cancer. 2004;111(5):762–771. | ||
Li HL, Gao YT, Li Q, Liu DK. [Anthropometry and female breast cancer: a prospective cohort study in urban Shanghai]. Zhonghua liu xing bing xue za zhi. 2006;27(6):488–493. Chinese. | ||
Lukanova A, Bjor O, Kaaks R, et al. Body mass index and cancer: results from the Northern Sweden Health and Disease Cohort. Int J Cancer. 2006;118(2):458–466. | ||
Mellemkjaer L, Bigaard J, Tjonneland A, et al. Body composition and breast cancer in postmenopausal women: a Danish prospective cohort study. Obesity. 2006;14(10):1854–1862. | ||
Palmer JR, Adams-Campbell LL, Boggs DA, Wise LA, Rosenberg L. A prospective study of body size and breast cancer in black women. Cancer Epidemiol Biomarkers Prev. 2007;16(9):1795–1802. | ||
Rapp K, Schroeder J, Klenk J, et al. Obesity and incidence of cancer: a large cohort study of over 145,000 adults in Austria. Br J Cancer. 2005;93(9):1062–1067. | ||
Reeves GK, Pirie K, Beral V, et al; Million Women Study Collaboration. Cancer incidence and mortality in relation to body mass index in the Million Women Study: cohort study. BMJ. 2007;335(7630):1134. | ||
DerSimonian R, Laird N. Meta-analysis in clinical trials. Control Clin Trials. 1986;7(3):177–188. | ||
Higgins JP, Thompson SG. Quantifying heterogeneity in a meta-analysis. Stat Med. 2002;21(11):1539–1558. | ||
Greenland S, Longnecker MP. Methods for trend estimation from summarized dose-response data, with applications to meta-analysis. Am J Epidemiol. 1992;135(11):1301–1309. | ||
Liu Q, Cook NR, Bergström A, Hsieh C-C. A two-stage hierarchical regression model for meta-analysis of epidemiologic nonlinear dose–response data. Comput Stat Data Anal. 2009;53(12):4157–4167. | ||
Orsini N, Li R, Wolk A, Khudyakov P, Spiegelman D. Meta-analysis for linear and nonlinear dose-response relations: examples, an evaluation of approximations, and software. Am J Epidemiol. 2012;175(1):66–73. | ||
Lo CK, Mertz D, Loeb M. Newcastle-Ottawa Scale: comparing reviewers’ to authors’ assessments. BMC Med Res Methodol. 2014;14:45. | ||
Vainio H, Kaaks R, Bianchini F. Weight control and physical activity in cancer prevention: international evaluation of the evidence. Eur J Cancer Prev. 2002;11(Suppl 2):S94–S100. | ||
Hankinson SE, Willett WC, Manson JE, et al. Alcohol, height, and adiposity in relation to estrogen and prolactin levels in postmenopausal women. J Natl Cancer Inst. 1995;87(17):1297–1302. | ||
Lake JK, Power C, Cole TJ. Women’s reproductive health: the role of body mass index in early and adult life. Int J Obes Relat Metab Disord. 1997;21(6):432–438. | ||
Rimm EB, Stampfer MJ, Colditz GA, Chute CG, Litin LB, Willett WC. Validity of self-reported waist and hip circumferences in men and women. Epidemiology. 1990;1(6):466–473. | ||
Weaver TW, Kushi LH, McGovern PG, et al. Validation study of self-reported measures of fat distribution. Int J Obes Relat Metab Disord. 1996;20(7):644–650. |
 © 2018 The Author(s). This work is published and licensed by Dove Medical Press Limited. The
full terms of this license are available at https://www.dovepress.com/terms
and incorporate the Creative Commons Attribution
- Non Commercial (unported, 3.0) License.
By accessing the work you hereby accept the Terms. Non-commercial uses of the work are permitted
without any further permission from Dove Medical Press Limited, provided the work is properly
attributed. For permission for commercial use of this work, please see paragraphs 4.2 and 5 of our Terms.
© 2018 The Author(s). This work is published and licensed by Dove Medical Press Limited. The
full terms of this license are available at https://www.dovepress.com/terms
and incorporate the Creative Commons Attribution
- Non Commercial (unported, 3.0) License.
By accessing the work you hereby accept the Terms. Non-commercial uses of the work are permitted
without any further permission from Dove Medical Press Limited, provided the work is properly
attributed. For permission for commercial use of this work, please see paragraphs 4.2 and 5 of our Terms.