Back to Journals » Clinical Interventions in Aging » Volume 16
Association Between Blood Pressure Indicators and Stroke in Aged Population: A Community-Based Nested Case-Control Study
Authors Ren L ![]() , Gao Y, Jiang Y, Wang G, Li Q
, Gao Y, Jiang Y, Wang G, Li Q ![]() , Gu Y, Yu H, Li J, Zhang L
, Gu Y, Yu H, Li J, Zhang L
Received 1 February 2021
Accepted for publication 14 May 2021
Published 31 May 2021 Volume 2021:16 Pages 997—1005
DOI https://doi.org/10.2147/CIA.S304847
Checked for plagiarism Yes
Review by Single anonymous peer review
Peer reviewer comments 3
Editor who approved publication: Prof. Dr. Nandu Goswami
Longbing Ren,1,2 Yan Gao,3 Yuting Jiang,3 Gege Wang,1,2 Qi Li,1,2 Yijun Gu,1,2 Han Yu,1,2 Jue Li,1,2 Lijuan Zhang1,2
1Shanghai East Hospital, Key Laboratory of Arrhythmias, Ministry of Education, Tongji University School of Medicine, Tongji University, Shanghai, 200120, People’s Republic of China; 2Institute of Clinical Epidemiology and Evidence-Based Medicine, Tongji University School of Medicine, Shanghai 200092, People’s Republic of China; 3Community Health Service Center of Anting Town Affiliated to Tongji University School of Medicine, Tongji University, Shanghai, 201805, People’s Republic of China
Correspondence: Jue Li; Lijuan Zhang Email [email protected]; [email protected]
Background and Aim: Any single discrete blood pressure (BP) measurement is not enough to estimate adverse cardiovascular events. We aim to comprehensively investigate the association between BP indicators and stroke.
Methods: An observational cohort study was conducted among 2888 Shanghai community-aged residents from 2014 to 2018, and a nested case-control study was designed to identify the association between BP indicators and stroke. In total 415 cases of stroke detected during the study period were selected as the case group and 415 non-stroke subjects, matched with factors of age and gender, were randomly selected from the cohort as control group.
Results: Multivariate logistic regression analysis revealed that systolic blood pressure (SBP) (adjusted odds ratio [AOR] 1.02, 95% confidence interval [CI] 1.02– 1.03), pulse pressure (PP) (AOR 1.03, 95% CI 1.02– 1.04), mean arterial pressure (MAP) (AOR1.02, 95% CI 1.01– 1.04) and pulse pressure index (PPI) (AOR 25.68, 95% CI 3.19– 206.90) increased the risk of stroke, respectively. After fitting both BP indicators and covariates, isolated abnormal SBP (AOR 2.55, 95% CI 1.74– 3.72) or PP ≥ 50 mmHg (AOR 1.66, 95% CI 1.08– 2.56) independently increased risk of stroke.
Conclusion: Besides SBP, PP and multiple factors, assessment should be taken into account comprehensively for stroke prevention and management.
Keywords: blood pressure; BP, stroke, nested case-control study, primary care
Background
Stroke is one of the most prominent health problems and has a high mortality rate. About 15 million people worldwide suffer from stroke, leaving 10 million people dead or permanently disabled every year.1–3 In China, stroke has become the leading cause of death among adults over the age of 204,5 and the prevalence of stroke in Chinese adults was over 1.29%,4 resulting in an estimated healthcare cost of at least US$6 billion annually.4,6 Thus, identifying people at risk and designing an effective medical management strategy are necessary for stroke prevention and management.
Hypertension, the most important modifiable risk factor for stroke, was estimated to affect approximately 28% of adults in China between 2013–2014. Therefore, regular blood pressure (BP) measurement is commonly performed in both clinical treatment and the management of stroke subjects. Systolic blood pressure (SBP) and diastolic blood pressure (DBP) were confirmed as independent risk factors for stroke, and each of them can be used to predict the risk of stroke.7–9 The Framingham cardiovascular disease (CVD) risk model10 also used SBP as one of the main risk factors to predict adverse cardiovascular events. Recent studies further identified other BP indicators, including pulse pressure (PP), mean arterial pressure (MAP)9 and pulse pressure index (PPI) were also as good predictors of stroke. PP increases greatly after 50 years of age as a result of arterial wall stiffening with the associated increase in SBP and decrease in DBP. Studies also indicated that PP was a better predictor than SBP for estimating the risk of coronary heart disease (CHD), heart failure (HF) and stroke.9,11–14 MAP is considered to be the perfusion pressure for the organs of the body, which is used to monitor cerebral blood flow perfusion, and has a significant correlation with the occurrence of stroke.15 Another indicator, PPI, a derivation from the analogy of Ohm’s law,16 was negative correlation with vascular compliance, which can reflect vascular compliance, and predict cardiovascular outcomes as well.16
However, most previous studies have focused on assessment of the effect of a single discrete BP indicator on adverse cardiovascular events, few studies systematically evaluated the effect of different BP indicators on the risk of stroke at the same time.12,17,18 The present nested case-control study was designed to comprehensively evaluate the different BP indicators for the risk of stroke, then provide detailed epidemiological evidence for stroke prevention and management.
Method
Study Participants
A total of 2888 eligible participants (1167 were men) were recruited ibetween January 1st to December 31st, 2014, in Anting Town of Jiading district in Shanghai, China. The study conformed to the provisions in accordance with the Helsinki Declaration as revised in 2013 and approved by the medical ethical review committee of Tongji University. All participants signed informed consent and all programs were implemented in accordance with the relevant regulations.
Participants enrolled in the study met the following conditions: 1) residents aged 65 or older; 2) conventional residents in Anting Town; and 3) individuals without stroke, multiple system organ dysfunction or failure, or serious cardiovascular and cerebrovascular diseases at baseline.
Exclusion criteria included: 1) clinically diagnosed malignant tumor or serious mental diseases; 2) abnormal hearing, vision and speech state; and 3) other diseases with life expectancy less than 5 years.
Participants were recruited by primary care doctors or notified by bulletin boards in community health centers. Among them, 415 participants were diagnosed with stroke during the 4-year follow-up. The definition of stroke is based on ICD-10 of WHO: stroke, not specified as hemorrhage or infarction (I64), include cerebrovascular accident NOS (not otherwise specified) and exclude sequelae of stroke (I69.4). Diagnosis and causes of stroke were adjudicated by two cardiologists; disagreements over stroke diagnosis were settled by consulting a neurologist or obtaining medical documents. And a control group matched by age (±3 years) and gender through propensity score matching was identified from the same cohort for each case subject. The control subject was in survival state when the case subject was diagnosed.
Sociodemographic and Anthropometric Data
Sociodemographic and anthropometric data including gender, age, smoking, drinking, dietary habits, and regular physical exercise were collected at baseline. History of diseases and medications were recorded through self-report, including hypertension, diabetes, dyslipidemia CHD, stroke and other diseases, and medications including antidiabetic, antihypertensive, anticoagulation, lipid lowering drugs and other drugs in current use.
Smoking was defined as having at least one cigarette per day in the past year.19 Drinking was defined as moderate or more alcohol intake according to the Dietary Guidelines for Americans, i.e., more than 7 drinks (14 grams of pure alcohol per drink) per week for women and more than more than 14 drinks per week for men.20 Dietary habit, which refers to whether the high salt intake, is defined as a daily intake of more than 6 grams of salt.21 Exercise habit was defined as having moderate intensity exercise lasting more than 30 minutes at least 3 times a week.
Anthropometric measurements were recorded by physical examination. Weight and height measured by primary care doctors and Body Mass Index (BMI) was calculated as weight/height2 (kg/m2). Waist and hip measured by primary care doctor and waist–hip ratio (WHR) was calculated as waist/hip. BP was measured by a uniform type of a uniform type of instrument (HEM-770A, Omron), and all participants examined the right arm at a sitting position after resting for at least 5 minutes.
All BP measurements were taken in the morning and the average of the twice consecutive BP readings was recorded. PP was calculated as SBP-DBP, MAP was calculated as DBP+PP/3 and PPI calculated as PP/SBP.16
All examinations were performed once a year, new diseases and drug uses were recorded as well.
Laboratory Assessments
Fasting total cholesterol (TC), triglyceride (TG), and fasting blood glucose (FBG) were measured biochemical measurements. Low-density lipoprotein cholesterol (LDL-C) and high-density lipoprotein cholesterol (HDL-C) were determined with homogeneous assay (Daiichi, Tokyo, Japan). Glycated hemoglobin (HbA1c) was analyzed by high-performance liquid chromatography.
Quality Control
All participants received a uniform physical examination and health information collection in Anting Community Health Service Center. All examinations and information collection were completed by clinicians who have received professional training with detailed explanations about purpose of physical examination, inquiry methods, professional clinical and pharmacological terms and items before the examination in order to reduce cognitive errors and omissions.
Relevant information of the research object was saved in the electronic database of Anting Community Health Service Center. The research did not involve the patient’s name or identity information and keeps all information strictly confidential.
Statistical Analyses
Statistical software SPSS20.0 (SPSS Inc., Chicago, IL, USA) and R (version 2.13.2) were used for data management and analyses. Categorical variables were summarized as percentage and the differences between groups were compared by chi-squared (χ2) test. Continuous variables were presented as mean ± standard deviation (SD) for normal distribution, and as medians with interquartile range (skewed distribution), therefore, independent samples t-test and Mann–Whitney U-test were used to comparison between groups. In addition, each BP indicator was formed into four categories according to Guidelines for the prevention and treatment of hypertension in China 201722 and percentage from the lowest to the highest value. A conditional logistic regression model was established to analyze the association related indicators and stroke. Receiver operating characteristic (ROC) curve was used to study the effectiveness of different BP indicators in predicting the risk of stroke and determine the boundary value of BP indicators for predicting the risk of stroke according to the Youden´s index. RMS package of R was used to build nomogram model.23,24 All statistical tests were two-tailed with type I error of 0.05, and were significant if P-value was less than 0.05.
Results
Eight hundred and thirty subjects were included in the investigation. The average age was 69.29±5.68 years, and approximately 45% were men. The characteristics of study participants are presented in Table 1. Indicators of BP, SBP, DBP, PP, MAP and PPI levels were significantly higher in stroke group than those in control group (All P<0.05). Stroke patients were more likely to have previous hypertension, diabetes mellitus, dyslipidemia, CHD, higher HDL-C level and usage of antihypertensive drugs, antidiabetic drugs and lipid lowering drugs than controls (All P <0.05); while, a lower proportion of participants in stroke group had a history of alcohol consumption and regular physical exercise (All P <0.05); otherwise, the differences in the remaining characteristics were not distinct (All P>0.05).
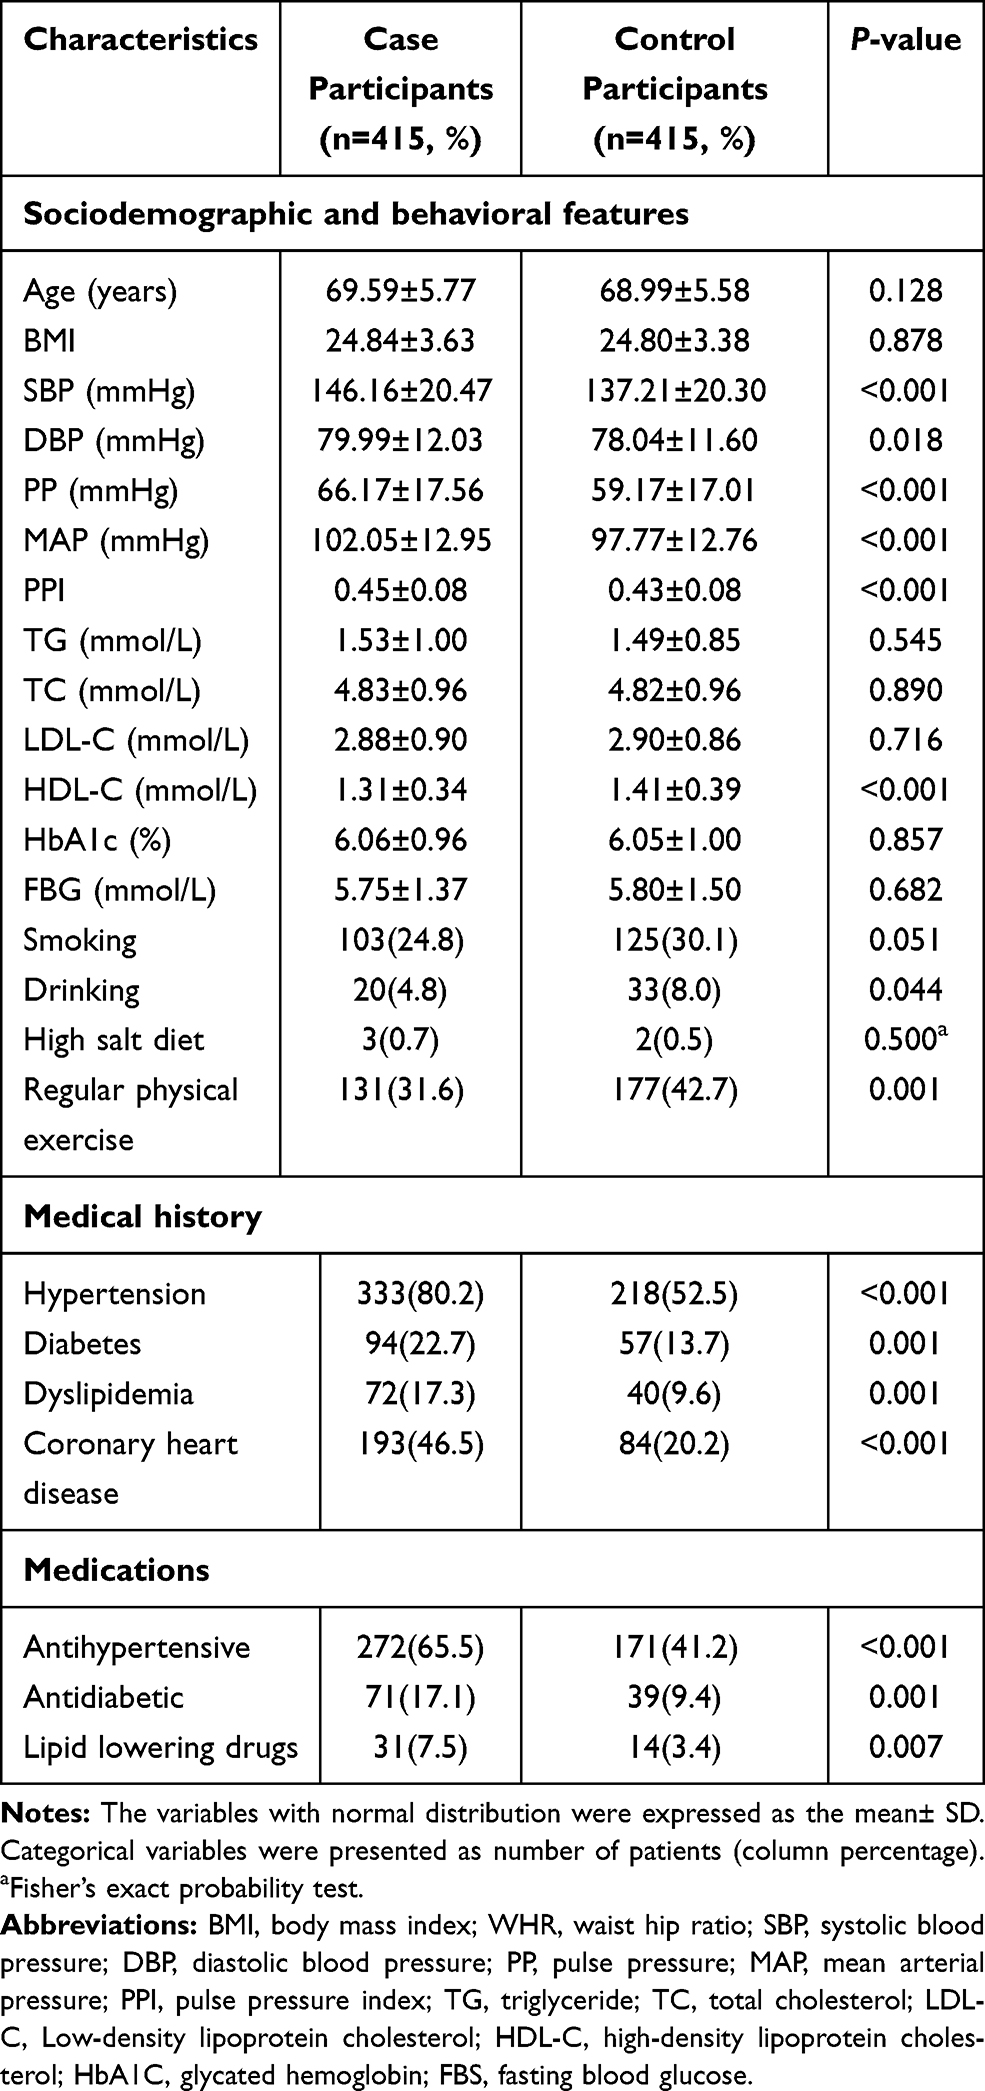 |
Table 1 Characteristics of Study Participants |
The marked association between BP indicators including SBP, PP, MAP and PPI and incident stroke still remained after adjustment for covariates (All P<0.05) (Table 2). SBP ≥ 140 mmHg (SBP [140–160 mmHg], AOR 1.60, 95% confidence interval (CI) 1.15–2.23; SBP [160–180 mmHg], AOR 2.26, 95% CI 1.44–3.56; SBP [>180 mmHg], AOR 16.709, 95% CI 3.79–73.66), the fourth quartile of PP (AOR 3.71, 95% CI 2.39–5.78), the third quartile (AOR 1.66, 95% CI 1.08–2.55) and the fourth quartile (AOR 2.14, 95% CI 1.38–3.30) of MAP and the third quartile (AOR 1.78, 95% CI 1.17–2.71) and the fourth quartile (AOR 1.74, 95% CI 1.14–2.66) of PPI markedly increased the risk of stroke.
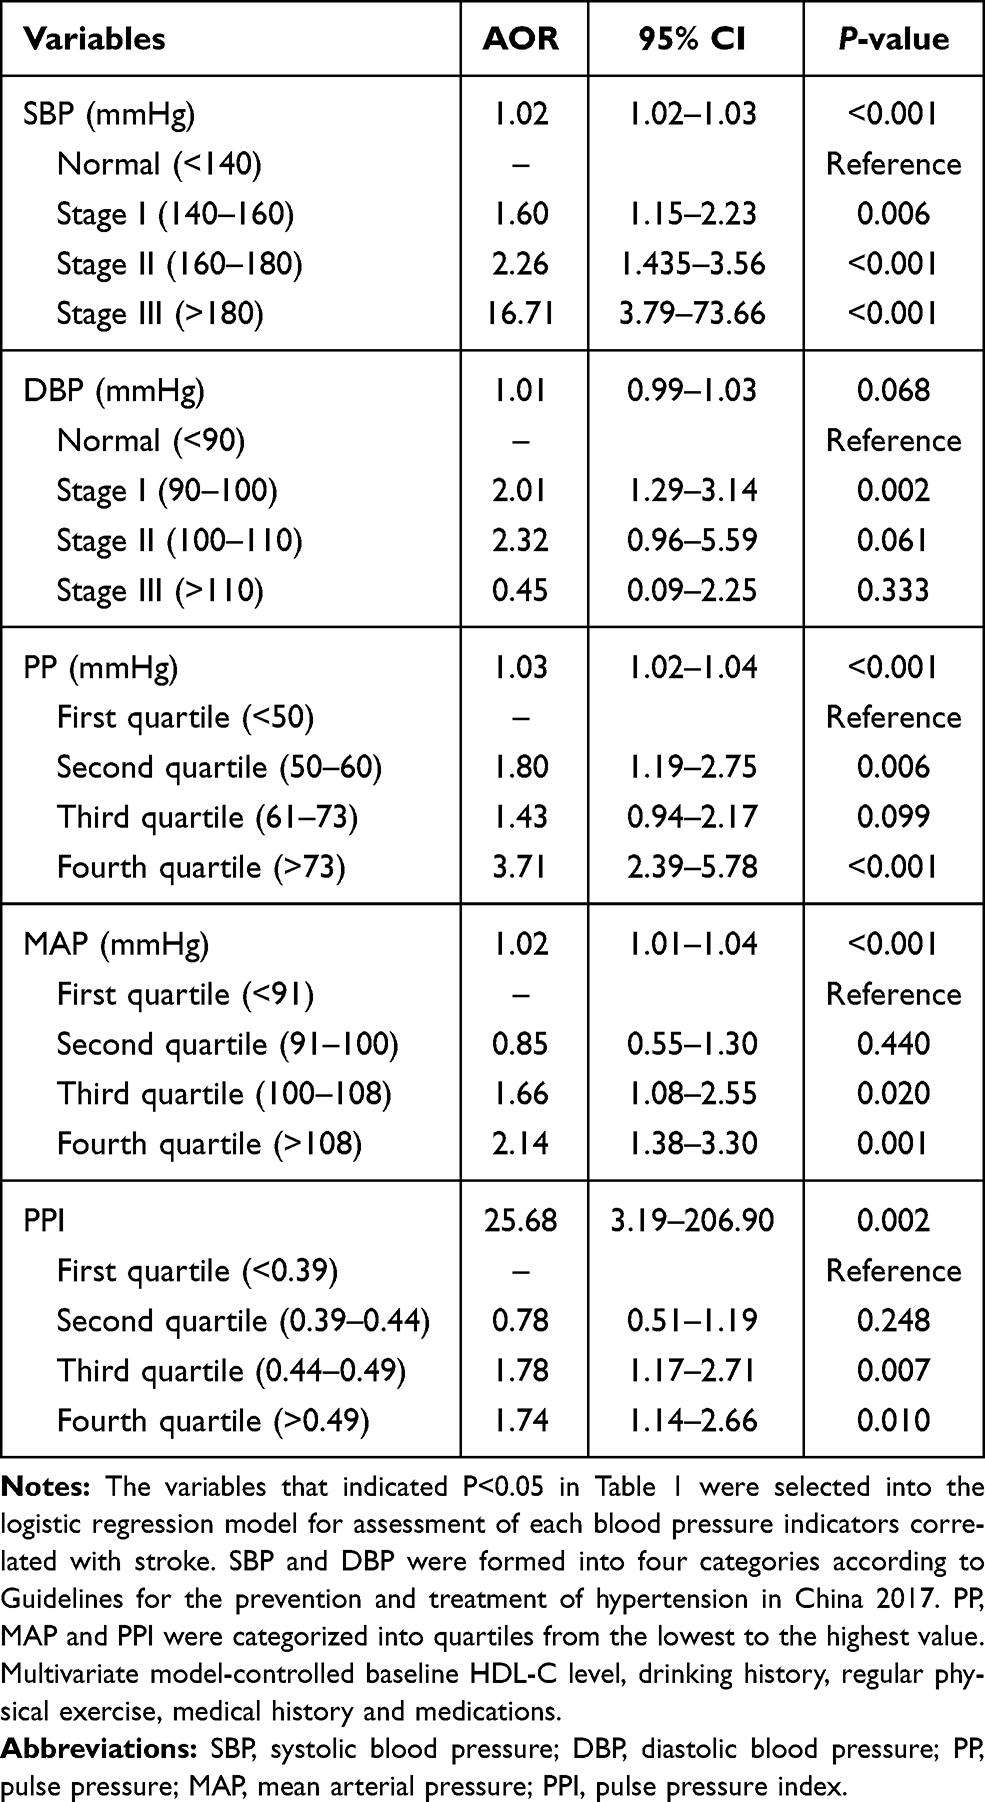 |
Table 2 Relationship Between Different Blood Pressure Indicators and the Risk of Stroke |
The ROC curve was further used to detect the effect of different BP indicators on stroke and the areas under curve (AUC) of each individual BP item were shown in Table S1. Furthermore, the significant variables (P<0.05) in Table 1 were selected into the nomogram model construction, excluded attenuated influence on stroke by multicollinearity with other variables, eventually independent prognostic factors including BP indicators, HDL-C, regular physical exercise, previous hypertension and CHD were enrolled to develop the prognostic nomogram model (Figure 1). By locating and summing the points for each prognostic factor and projecting the total score onto the bottom scale, the 4-year probability of stroke can be predicted. Detailed scores for each prognostic factor in the graph are shown in Table S2. Calibration curve were used to evaluate whether the nomograms were credible via internal validation for each BP indicators. The results revealed that the C-index values of SBP: 0.742, 95% CI 0.707–0.773 (Figure 2A), DBP: 0.721, 95% CI 0.686–0.755 (Figure 2B), MAP: 0.732, 95% CI 0.697–0.765 (Figure 2C), PP: 0.740, 95% CI 0.705–0.772 (Figure 2D) and PPI: 0.729, 95% CI 0.694–0.762 (Figure 2E), respectively.
 |
Figure 1 Nomogram constructed from baseline related indicators. Abbreviations: SBP, systolic blood pressure; DBP, diastolic blood pressure; PP, pulse pressure; MAP, mean arterial pressure; PPI, pulse pressure index. Notes: To calculate participants’ stroke incident probability, points for each parameter are assigned by corresponding values from the “Points” axis, and sum of the points is plotted on “Total points” axis. The stroke incident probability is the value at a vertical line from corresponding total points. |
 |
Figure 2 Internal calibration plots of nomogram calibration curves for each blood pressure indicators: (A) SBP, (B) DBP, (C) MAP, (D) PP, and (E) PPI. Abbreviations: SBP, systolic blood pressure; DBP, diastolic blood pressure; PP, pulse pressure; MAP, mean arterial pressure; PPI, pulse pressure index. Notes: The 45°line represents a perfect match between the actual survival outcome (y-axis) and nomogram-predicted survival (x-axis). Closer distance from the points to the 45°line indicates higher prediction accuracy. |
Further analysis of the risk for stroke by SBP and PP built by multivariate logistic regression model showed that isolated abnormal SBP (AOR 2.55, 95% CI 1.74–3.72) or PP ≥ 50 mmHg (AOR 1.66, 95% CI 1.08–2.56) can significantly increase the risk of stroke. Abnormal SBP combined with increased PP increased the risk of stroke by 2.7 times (AOR 2.72, 95% CI 1.84–4.03) (Figure 3).
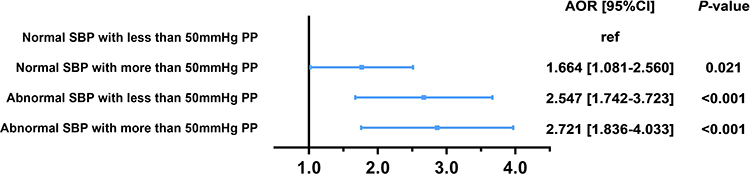 |
Figure 3 Forest plots for different SBP and PP conditions. Abbreviations: AOR, adjusted odds ratio; SBP, systolic blood pressure; PP, pulse pressure. Notes: SBP was formed into normal group and abnormal group according to 140mmHg, PP was formed into group according to 50mmHg. Multivariate model-controlled baseline HDL-C level, drinking history, regular physical exercise, medical history and medications. |
Discussion
As the leading cause of CVD deaths in China, stroke not only impacted greatly on life quality, but caused an significantly increased in economic burden of society.25 A community-based nested case-control study was designed in this study to reveal the association between BP indicators and stroke. We revealed approximately 14.4% of participants experienced a stroke event during a 4-year follow-up. SBP, PP, MAP, PPI, HDL-C, daily physical exercise, previous hypertension and CHD were independent risk factors for stroke, which is consistent with the results of Domanski et al26 We also found that besides SBP, PP was another powerful predictor for stroke even in the presence of normal SBP.
PP affected the stability of arterial plaque and therefore is the strongest independent predictor of arterial plaque ulcer.27 The damage of vascular endothelial function and the increase of arterial stiffness might lead to a vulnerable inner wall of blood vessel. The pressure on the artery rises with the increase of PP, which makes it easier for blood to exude from the wall of blood vessel and aneurysm wall to rupture and form cerebral hemorrhage as well. In addition, the increase of PP will make the carotid plaque unstable and thus lead to cerebral infarction. According to the hypertension guidelines issued by the European Society of Cardiology and European Society of Hypertension in 2013, PP≥ 60 mmHg in the elderly population is thought to significantly increase cardiovascular mortality.14,28 While, PP greater than 50 or 55 mmHg might be a risk factor for cardiovascular events29,30 and our results are consistent with this recommendation. The simple nomogram model showed PP more than 50 mmHg was considered to increase the risk to stroke, as the aged population is more prone to atherosclerosis and stroke, lower PP levels are needed to reduce the risk.
Many factors related to stroke have been well clarified, such as age, hypertension, diabetes mellitus, dyslipidemia and other cardiovascular risk factors can damage vascular endothelial function.31,32 In this study, we found that single BP indicator was not enough to predict stroke events well. One possible explanation is that the antihypertensive drugs use reduces the predictive power of BP. Therefore, multiple factors were used to predict stroke in this study. HDL level, history of hypertension and CHD, daily physical exercise and BP indicators were finally set together into the nomogram prediction model and each of the fitting blood indicators can predict stroke event better than before. Our results gave details that PP might as important as SBP in predict the accident of stroke among Chinese community aged population, and for primary care workers, PP less than 50 mmHg was suggested as the best management standard, especially when the SBP and DBP of community residents are not up to the standard of hypertension, e.g., resting BP of 130/65 mmHg, health care workers should pay attention to it and carry out a closer follow-up. In addition, for patients with PP greater than 50 mmHg, proper antihypertensive drugs should be used in antihypertensive treatment to avoid cardiovascular risk caused by excessive PP. Finally, controlling the HDL level and daily physical exercise education of elders should be promoted among primary care workers, and for patients with hypertension and CHD history, stricter BP and blood lipid control should be performed to avoid the occurrence of stroke.
This study has several strengths. First, a matched case-control design with extreme phenotype was used to maximize the efficiency of the study and minimize potential confounders. Second, data and results of the investigation were obtained at the follow-up, avoiding the recall bias of the case-control study. Third, although subgroups of stroke were not further identified, we gave a detailed evaluation for the association between various BP indicators and stroke among a community-based population, which provided epidemiological evidence for the prevention of stroke and relative adverse events in primary care.
Our study also has several limitations. First, the clinical types of stroke were not subdivided, the risk of ischemic stroke may not be exactly the same as hemorrhagic stroke. Second, we have adjusted for all known covariates, but it is possible that some residual confounding covariates may remain especially in a secondary analysis. Third, although the potential influence of physical exercises, smoking and drinking levels were taken into account when estimated the association between BP indicators and stroke, the results may not be accurate because self-report-based estimation offer inaccurate basis for scientific conclusions.
Conclusion
This community-based study of a geriatric population demonstrated that beyond SBP, PP more than 50 mmHg should be paid more attention in the primary stroke management. Further cohort study is warranted to verify PP in prediction of the risk for incident stroke.
Data Sharing Statement
The data sets used and/or analyzed during the current study are available from the corresponding author upon request.
Acknowledgments
This work was supported by the National Natural Science Foundation of China (grant no. 81872720) and Shanghai Municipal Commission of Health and Family Planning (grant no. 201840066) to Pro. Lijuan Zhang. The funders had no role in study design, data collection and analysis, decision to publish, or preparation of the manuscript.
Disclosure
The authors report no conflicts of interest in this work.
References
1. Thrift AG, Cadilhac DA, Thayabaranathan T, et al. Global stroke statistics. Int J Stroke. 2014;9(1):6–18. doi:10.1111/ijs.12245
2. Feigin VL, Norrving B, Mensah GA. Global burden of stroke. Circ Res. 2017;120(3):439–448. doi:10.1161/CIRCRESAHA.116.308413
3. Katan M, Luft A. Global burden of stroke. Semin Neurol. 2018;38(2):208–211. doi:10.1055/s-0038-1649503
4. Zhou M, Wang H, Zeng X, et al. Mortality, morbidity, and risk factors in China and its provinces, 1990–2017: a systematic analysis for the global burden of disease study 2017. Lancet. 2019;394:1145–1158. doi:10.1016/S0140-6736(19)30427-1
5. Wang WZ, Jiang B, Sun HX, et al. Prevalence, incidence, and mortality of stroke in China results from a nationwide population-based survey of 480 687 adults. Circulation. 2017;135(8):759. doi:10.1161/CIRCULATIONAHA.116.025250
6. Zhai Y, Hu JP, Kong LZ, Zhao WH, Chen CM. [Economic burden of coronary heart disease and stroke attributable to hypertension in China]. Zhonghua Liu Xing Bing Xue Za Zhi. 2006;27(9):744–747. Chinese.
7. Penn AM, Croteau NS, Votova K, et al. Systolic blood pressure as a predictor of transient ischemic attack/minor stroke in emergency department patients under age 80: a prospective cohort study. BMC Neurol. 2019;19(1):251. doi:10.1186/s12883-019-1466-4
8. Gosmanova EO, Mikkelsen MK, Molnar MZ, et al. Association of systolic blood pressure variability with mortality, coronary heart disease, stroke, and renal disease. J Am Coll Cardiol. 2016;68(13):1375–1386. doi:10.1016/j.jacc.2016.06.054
9. Strandberg TE, Pitkala K. What is the most important component of blood pressure: systolic, diastolic or pulse pressure? Curr Opin Nephrol Hypertens. 2003;12(3):293–297. doi:10.1097/00041552-200305000-00011
10. D’Agostino RB, Vasan RS, Pencina MJ, et al. General cardiovascular risk profile for use in primary care: the Framingham Heart Study. Circulation. 2008;117(6):743–753. doi:10.1161/CIRCULATIONAHA.107.699579
11. Agyemang C, Bhopal R, Redekop WK. Does the pulse pressure in people of European, African and South Asian descent differ? A systematic review and meta-analysis of UK data. J Hum Hypertens. 2007;21(8):598–609. doi:10.1038/sj.jhh.1002191
12. Chuang SY, Cheng HM, Bai CH, Yeh WT, Chen JR, Pan WH. Blood pressure, carotid flow pulsatility, and the risk of stroke: a community-based study. Stroke. 2016;47(9):2262–2268. doi:10.1161/STROKEAHA.116.013207
13. Liu FD, Shen XL, Zhao R, et al. Pulse pressure as an independent predictor of stroke: a systematic review and a meta-analysis. Clin Res Cardiol. 2016;105(8):677–686. doi:10.1007/s00392-016-0972-2
14. Millar JA, Lever AF, Burke V. Pulse pressure as a risk factor for cardiovascular events in the MRC mild hypertension trial. J Hypertens. 1999;17(8):1065–1072. doi:10.1097/00004872-199917080-00004
15. Zheng L, Sun Z, Li J, et al. Pulse pressure and mean arterial pressure in relation to ischemic stroke among patients with uncontrolled hypertension in rural areas of China. Stroke. 2008;39(7):1932–1937. doi:10.1161/STROKEAHA.107.510677
16. Peng-Lin Y, Yue-Chun L. Pulse pressure index (pulse pressure/systolic pressure) may be better than pulse pressure for assessment of cardiovascular outcomes. Med Hypotheses. 2009;72(6):729–731. doi:10.1016/j.mehy.2008.12.041
17. Verdecchia P, Schillaci G, Reboldi G, Franklin SS, Porcellati C. Different prognostic impact of 24-hour mean blood pressure and pulse pressure on stroke and coronary artery disease in essential hypertension. Circulation. 2001;103(21):2579–2584. doi:10.1161/01.CIR.103.21.2579
18. Du X, Wang CL, Ni JX, et al. Association of blood pressure with stroke risk, stratified by age and stroke type, in a low-income population in China: a 27-year prospective cohort study. Front Neurol. 2019;10. doi:10.3389/fneur.2019.00564
19. Centers for Disease Control and Prevention (CDC). Current cigarette smoking prevalence among working adults–United States, 2004–2010. MMWR Morb Mortal Wkly Rep. 2011;60(38):1305–1309.
20. Research, Alcohol, and Current Reviews Editorial Staff. Drinking patterns and their definitions. Alcohol Res. 2018;39(1):17–18.
21. Migdal KU, Babcock MC, Robinson AT, et al. The impact of high dietary sodium consumption on blood pressure variability in healthy, young adults. Am J Hypertens. 2020;33(5):422–429. doi:10.1093/ajh/hpaa014
22. Liu M, Committee of cardio‐cerebro‐vascular Disease of China Association of Gerontology and Geriatrics, Chinese College of Cardiovascular Physician of Chinese Medical Doctor Association. Chinese expert consensus on the diagnosis and treatment of hypertension in the elderly (2017). Aging Med (Milton). 2018;1(2):106–116. doi:10.1002/agm2.12020
23. Berry BB, Geary DL, Jaff MR. A model for collaboration in quality improvement projects: implementing a weight-based heparin dosing nomogram across an integrated health care delivery system. Jt Comm J Qual Improv. 1998;24(9):459–469. doi:10.1016/s1070-3241(16)30395-9
24. Bianchi L, Borghesi M, Schiavina R, et al. Predictive accuracy and clinical benefit of a nomogram aimed to predict (68)Ga-PSMA PET/CT positivity in patients with prostate cancer recurrence and PSA < 1 ng/mL external validation on a single institution database. Eur J Nucl Med Mol Imaging. 2020.
25. Ma LY, Wang W, Wu YZ, Chen WW. Outline of the report on cardiovascular diseases in China, 2017. J Hypertens. 2018;36:E322–E322. doi:10.1097/01.hjh.0000549315.86869.59
26. Domanski MJ, Davis BR, Pfeffer MA, Kastantin M, Mitchell GF. Isolated systolic hypertension - Prognostic information provided by pulse pressure. Hypertension. 1999;34(3):375–380. doi:10.1161/01.HYP.34.3.375
27. Lovett JK, Howard SC, Rothwell PM. Pulse pressure is independently associated with carotid plaque ulceration. J Hypertens. 2003;21(9):1669–1676. doi:10.1097/00004872-200309000-00016
28. Mancia G, Fagard R, Narkiewicz K, et al. 2013 Esh/Esc Guidelines for the Management of Arterial Hypertension.
29. Mancia G, De Backer G, Dominiczak A, et al. 2007 guidelines for the management of arterial hypertension: the task force for the management of arterial hypertension of the European Society of Hypertension (ESH) and of the European Society of Cardiology (ESC). Eur Heart J. 2007;28(12):1462–1536. doi:10.1093/eurheartj/ehm236
30. Sesso HD, Stampfer MJ, Rosner B, et al. Systolic and diastolic blood pressure, pulse pressure, and mean arterial pressure as predictors of cardiovascular disease risk in Men. Hypertension. 2000;36(5):801–807. doi:10.1161/01.HYP.36.5.801
31. Amery A, Fagard R, Staessen J, Thijs L, Vanhoof R. Isolated systolic blood-pressure elevation in the elderly - mechanisms, risk, and the need for further-studies. J Cardiovasc Pharm. 1989;14:S14–S20. doi:10.1097/00005344-198914100-00004
32. Holmes MV, Millwood IY, Kartsonaki C, et al. Lipids, lipoproteins, and metabolites and risk of myocardial infarction and stroke. J Am Coll Cardiol. 2018;71(6):620–632. doi:10.1016/j.jacc.2017.12.006
 © 2021 The Author(s). This work is published and licensed by Dove Medical Press Limited. The
full terms of this license are available at https://www.dovepress.com/terms
and incorporate the Creative Commons Attribution
- Non Commercial (unported, 3.0) License.
By accessing the work you hereby accept the Terms. Non-commercial uses of the work are permitted
without any further permission from Dove Medical Press Limited, provided the work is properly
attributed. For permission for commercial use of this work, please see paragraphs 4.2 and 5 of our Terms.
© 2021 The Author(s). This work is published and licensed by Dove Medical Press Limited. The
full terms of this license are available at https://www.dovepress.com/terms
and incorporate the Creative Commons Attribution
- Non Commercial (unported, 3.0) License.
By accessing the work you hereby accept the Terms. Non-commercial uses of the work are permitted
without any further permission from Dove Medical Press Limited, provided the work is properly
attributed. For permission for commercial use of this work, please see paragraphs 4.2 and 5 of our Terms.