Back to Journals » Diabetes, Metabolic Syndrome and Obesity » Volume 13
Association Between Atherosclerosis and Diabetic Retinopathy in Chinese Patients with Type 2 Diabetes Mellitus
Authors Zhang C, Wang S ![]() , Li M, Wu Y
, Li M, Wu Y ![]()
Received 18 January 2020
Accepted for publication 12 May 2020
Published 8 June 2020 Volume 2020:13 Pages 1911—1920
DOI https://doi.org/10.2147/DMSO.S246497
Checked for plagiarism Yes
Review by Single anonymous peer review
Peer reviewer comments 3
Editor who approved publication: Prof. Dr. Antonio Brunetti
Chenghui Zhang, Suyuan Wang, Mingxia Li, Yunhong Wu
Department of Endocrinology and Metabolism, Hospital of Chengdu Office of People’s Government of Tibetan Autonomous Region, Chengdu, People’s Republic of China
Correspondence: Yunhong Wu
Department of Endocrinology and Metabolism, Hospital of Chengdu Office of People’s Government of Tibetan Autonomous Region, No. 20 Ximianqiao Street, Chengdu, Sichuan 610041, People’s Republic of China
Email [email protected]
Aim: To explore the association between the atherosclerosis and diabetic retinopathy (DR) in Chinese patients with type 2 diabetes mellitus (T2DM).
Methods: This hospital-based cross-sectional study included 949 patients (700 males and 249 females) with T2DM. The atherosclerotic parameters were assessed using the cardio-ankle vascular index (CAVI), ankle-brachial index (ABI), and carotid plaque. DR was assessed and graded using digital retinal photography and fundus fluorescein angiography as either nonproliferative DR (NPDR) or proliferative DR (PDR). Multiple logistic regression analysis was performed to identify the associations between the atherosclerotic parameters and DR status.
Results: The prevalence of DR was 23.6% in total patients, including 167 (17.6%) patients with NPDR and 57 (6.0%) patients with PDR. Patients with NPDR and PDR were more likely to have higher prevalence of increased CAVI, increased ABI, and carotid plaque than those without DR. In multivariable adjusted logistic regression analysis, patients with NPDR showed an odds ratio (OR) of 2.59 [95% confidence interval (CI), 1.61– 4.19] for increased CAVI, 1.99 (0.62– 6.34) for increased ABI, and 1.75 (1.13– 2.71) for carotid plaque. Patients with PDR showed an OR of 7.83 (3.52– 17.41) for increased CAVI, 10.65 (3.33– 34.04) for increased ABI, and 11.40 (2.67– 48.63) for carotid plaque.
Conclusion: Both NPDR and PDR were independently associated with increased CAVI and presence of carotid plaque in Chinese patients with T2DM.
Keywords: atherosclerosis, cardio-ankle vascular index, diabetic retinopathy, ankle-brachial index, carotid plaque
Introduction
Diabetic retinopathy (DR) is the leading cause of vision impairment and blindness in the working-age population.1 The global prevalence of DR and vision-threatening DR is estimated to be 35% and 10%, respectively.2,3 DR has become a serious public health issue in China. The pooled prevalence rates of any DR, nonproliferative DR (NPDR) and proliferative DR (PDR) in China are 18.45%, 15.05%, and 0.99%, respectively.4 Apart from the devastating effects on vision that could result in depression and a poor quality of life, patients with DR demonstrate a high risk for cardiovascular disease and mortality.5–7
Atherosclerosis, a disease of the large arteries, is the primary cause of cardiocerebral diseases8 and is associated with cardio-cerebrovascular risk in patients with type 2 diabetes mellitus (T2DM).9,10 Atherosclerosis comprises two different processes, namely structural changes (atherosis) presenting as carotid plaque, increased carotid intima-media thickness (CIMT) and ankle-brachial index (ABI), and functional changes (sclerosis) presenting as increased arterial stiffness.11 Several studies have investigated the association between atherosclerosis and presence of DR. In most previous studies, the analyses were performed using either the structural or functional markers of atherosclerosis.12–14 Few studies have reported the association between DR and atherosclerosis using both the structural and functional markers.15,16 Furthermore, studies on the relationship between atherosclerosis and DR have yielded inconsistent results.16,17
Arterial stiffness is considered to be an accurate reflection of atherosclerosis and vascular function.18 The relationship between arterial stiffness and DR has been established.13,19 In these studies, pulse wave velocity (PWV) is used as a parameter for arterial stiffness. Although PWV is a common marker of arterial stiffness and reflects vascular damage,20 it is reported to be affected by several factors, including blood pressure at the time of measurement and autonomic nerve function.21 Recently, the cardio-ankle vascular index (CAVI) has emerged as a new indicator to estimate the degree of stiffness of the systemic arteries and a convenient measure of functional changes in early atherosclerosis.22 Evidence shows that CAVI is superior to PWV mainly because it is not affected by blood pressure.23–25 In addition, CAVI has been applied in the clinical practice to measure arterial stiffness in subjects with cardiovascular diseases, hypertension, and obesity.26–28
However, few studies have reported the relationship between DR and arterial stiffness measured by CAVI in patients with diabetes. Therefore, using carotid plaque, ABI, and CAVI as indicators of atherosclerosis, we designed this study to explore the association between atherosclerosis and DR in Chinese patients with T2DM.
Materials and Methods
Subjects
In this hospital-based cross-sectional study, 1578 consecutive T2DM patients aged 18–79 years who were hospitalized for either poor blood glucose control or further screening of microvascular and macrovascular complications at the Department of Endocrinology and Metabolism of our hospital from May 2017 to December 2018 were selected. Of them, 629 patients were excluded for the following reasons: (1) patients with ABI < 0.9 and reported history of cardiocerebral vascular disease (n = 70); (2) presence of systemic inflammatory or infectious disease (n = 58); (3) presence of malignant tumor (n = 29); and (4) incomplete data on carotid plaque, ABI, CAVI, and fundus photography (n = 472). Subsequently, 949 patients were analyzed in this study. This study was approved by the ethics committee of Hospital of Chengdu Office of People’s Government of Tibetan Autonomous Region, and the study was conducted in accordance with the Declaration of Helsinki. The need for written informed consent was waived owing to the retrospective nature of the study. We have confirmed of patient data confidentiality.
Assessment of DR
In accordance with a standardized protocol, high-quality fundus photographs were taken of both eyes after pupillary dilation using a digital retinal camera (Visucam 500, Carl Zeiss Meditec AG, Jena, Germany). If needed, fundus fluorescein angiography was performed. DR was assessed and graded using digital retinal photography and fluorescein angiography, as either NPDR or PDR by ophthalmologists, according to the Early Treatment Diabetic Retinopathy Study (ETDRS) retinopathy severity scale.29
Assessment of Atherosclerosis
The atherosclerotic markers used in this study were carotid plaque, ABI, and CAVI. Carotid arteries were measured at the levels of the internal carotid artery, common carotid artery, and at the bifurcation using a high-resolution B-mode ultrasonography system (IU22, Philips, Eindhoven, Netherlands) with an electric linear array transducer of 7.5 MHz, which was operated by a trained and certified sonographer.30 Carotid plaque was considered to be present when a focal structure was seen encroaching more than 0.5 mm or 50% of the surrounding CIMT into the arterial lumen or demonstrating a thickness >1.5 mm, according to the Mannheim consensus.30
CAVI was measured by trained technical staff using the VaseraVS-1500A instrument (Fukuda Denshi, Tokyo, Japan) with patients resting in the supine position at least 5 minutes. Electrocardiogram electrodes were placed on both wrists, and the cuffs were wrapped around the four extremities. A microphone was placed on the sternal angle for detecting heart sounds. Blood pressure (BP) and waveforms of the brachial and ankle arteries were measured. Data obtained were analyzed using the 1500A vascular screening system software (Fukuda Denshi, Tokyo, Japan). The CAVI value was obtained automatically using the following formula: CAVI = a [{2ρ ×1/(SBP-DBP)} × {In (SBP/DBP) ×PWV2}] + b (ρ: density of blood; a and b: constants; SBP, systolic blood pressure; DBP, diastolic blood pressure).24 Increased CAVI was defined as a value ≥9 as per the manufacturer’s instructions and previous studies.22,31
Measurements for calculation of ABI were obtained using the VaseraVS-1500A instrument (Fukuda Denshi, Tokyo, Japan). Blood pressure cuffs were applied to both arms and both ankles and SBP measurements were automatically obtained from bilateral brachial, dorsalis pedis, and posterior tibial arteries. The ABI was calculated by the ratio of the ankle SBP divided by the arm SBP. Increased ABI was defined as a value ≥1.3.32
Data Collection
We evaluated both the clinical characteristics (age, weight, height, diabetes duration, smoking status, history of hypertension, medications and BP) and the laboratory parameters (levels of hemoglobin A1c[HbA1c], triglycerides[TG], total cholesterol[TC], low-density lipoprotein cholesterol[LDL-C], high-density lipoprotein cholesterol[HDL-C], serum creatinine[SCr], and uric acid, urinary albumin-creatinine ratio[ACR]) from the electronic medical records. HbA1c level was measured using high-performance liquid chromatography (HPLC). Serum lipid-profile, SCr, and uric acid were measured using an automatic biochemistry analyzer (Modular P800, Roche Diagnostics GmbH, Germany). Urinary albumin and creatinine were used to calculate ACR.
Definitions
The body mass index (BMI) was calculated as the weight in kilogram (Kg) divided by the square of height in meter (m2). The estimated glomerular filtration rate (eGFR) was calculated using the abbreviated Modification of Diet in Renal Disease Study Group formula modified for Chinese subjects.33 Hypertension was defined as three documented measurements ≥140/90 mmHg at rest, history of hypertension reported by the patient, or history of treatment with antihypertensive agents. Microalbuminuria was defined as a value for urinary ACR ranged from 30 to 299 mg/g and macroalbuminuria was defined as ACR ≥ 300 mg/g.34
Statistical Analysis
The continuous variables were checked using the Kolmogorov–Smirnov test. Data were presented as number (percentage) for categorical variables, and continuous data were expressed as mean ± standard deviation (SD) when normally distributed or median (interquartile range) when not. According to the DR status, patients were divided into three groups: without DR, with NPDR, and with PDR. Differences between the three groups were compared using one-way analysis of variance (ANOVA) for continuous variables and chi-square test for categorical data. Univariate logistic regression models were performed to evaluate the relations between atherosclerosis markers and presence of DR with sex, age, smoking status, diabetic duration, hypertension, SBP, DBP, BMI, TG, TC, HDL-C, LDL-C, HbA1c, and statin exposure. Multiple logistic regression analysis was performed to investigate the associations between the status of DR with increased CAVI, increased ABI, and presence of carotid plaque. The results were showed as odds ratio (OR) with 95% confidence interval (95% CI). The covariates entered into the model were based on univariate analyses and previous literature.3 Interaction and stratified analysis were conducted according to sex, age, diabetic duration, history of hypertension, LDL-C, HbA1c, and statin exposure. P value less than 0.05 was considered statistically significant. Statistical analyses were performed using the Empower software (www.empowerstats.com; X&Y Solutions, Inc., Boston, MA, USA).
Results
A total of 949 patients (700 males and 249 females) were included in the present study. The mean age was 54.8 ± 9.5 years (range: 24–78 years). The mean diabetic duration was 7.0 (4.0–12.0) years. The prevalence of DR was 23.6% (224) in total patients, including 167 (17.6%) patients with NPDR and 57 (6.0%) patients with PDR. Table 1 presents the general characteristics of the patients divided into three groups according to DR status. There was no difference in sex, BMI, smoking status, uric acid, TC, TG, HDL-C, and LDL-C among three groups. Patients with PDR were older and showed longer diabetic duration and higher prevalence of hypertension than those with NRDR and without DR. The mean levels of SBP, DBP, and HbA1c were higher than those in other two groups.
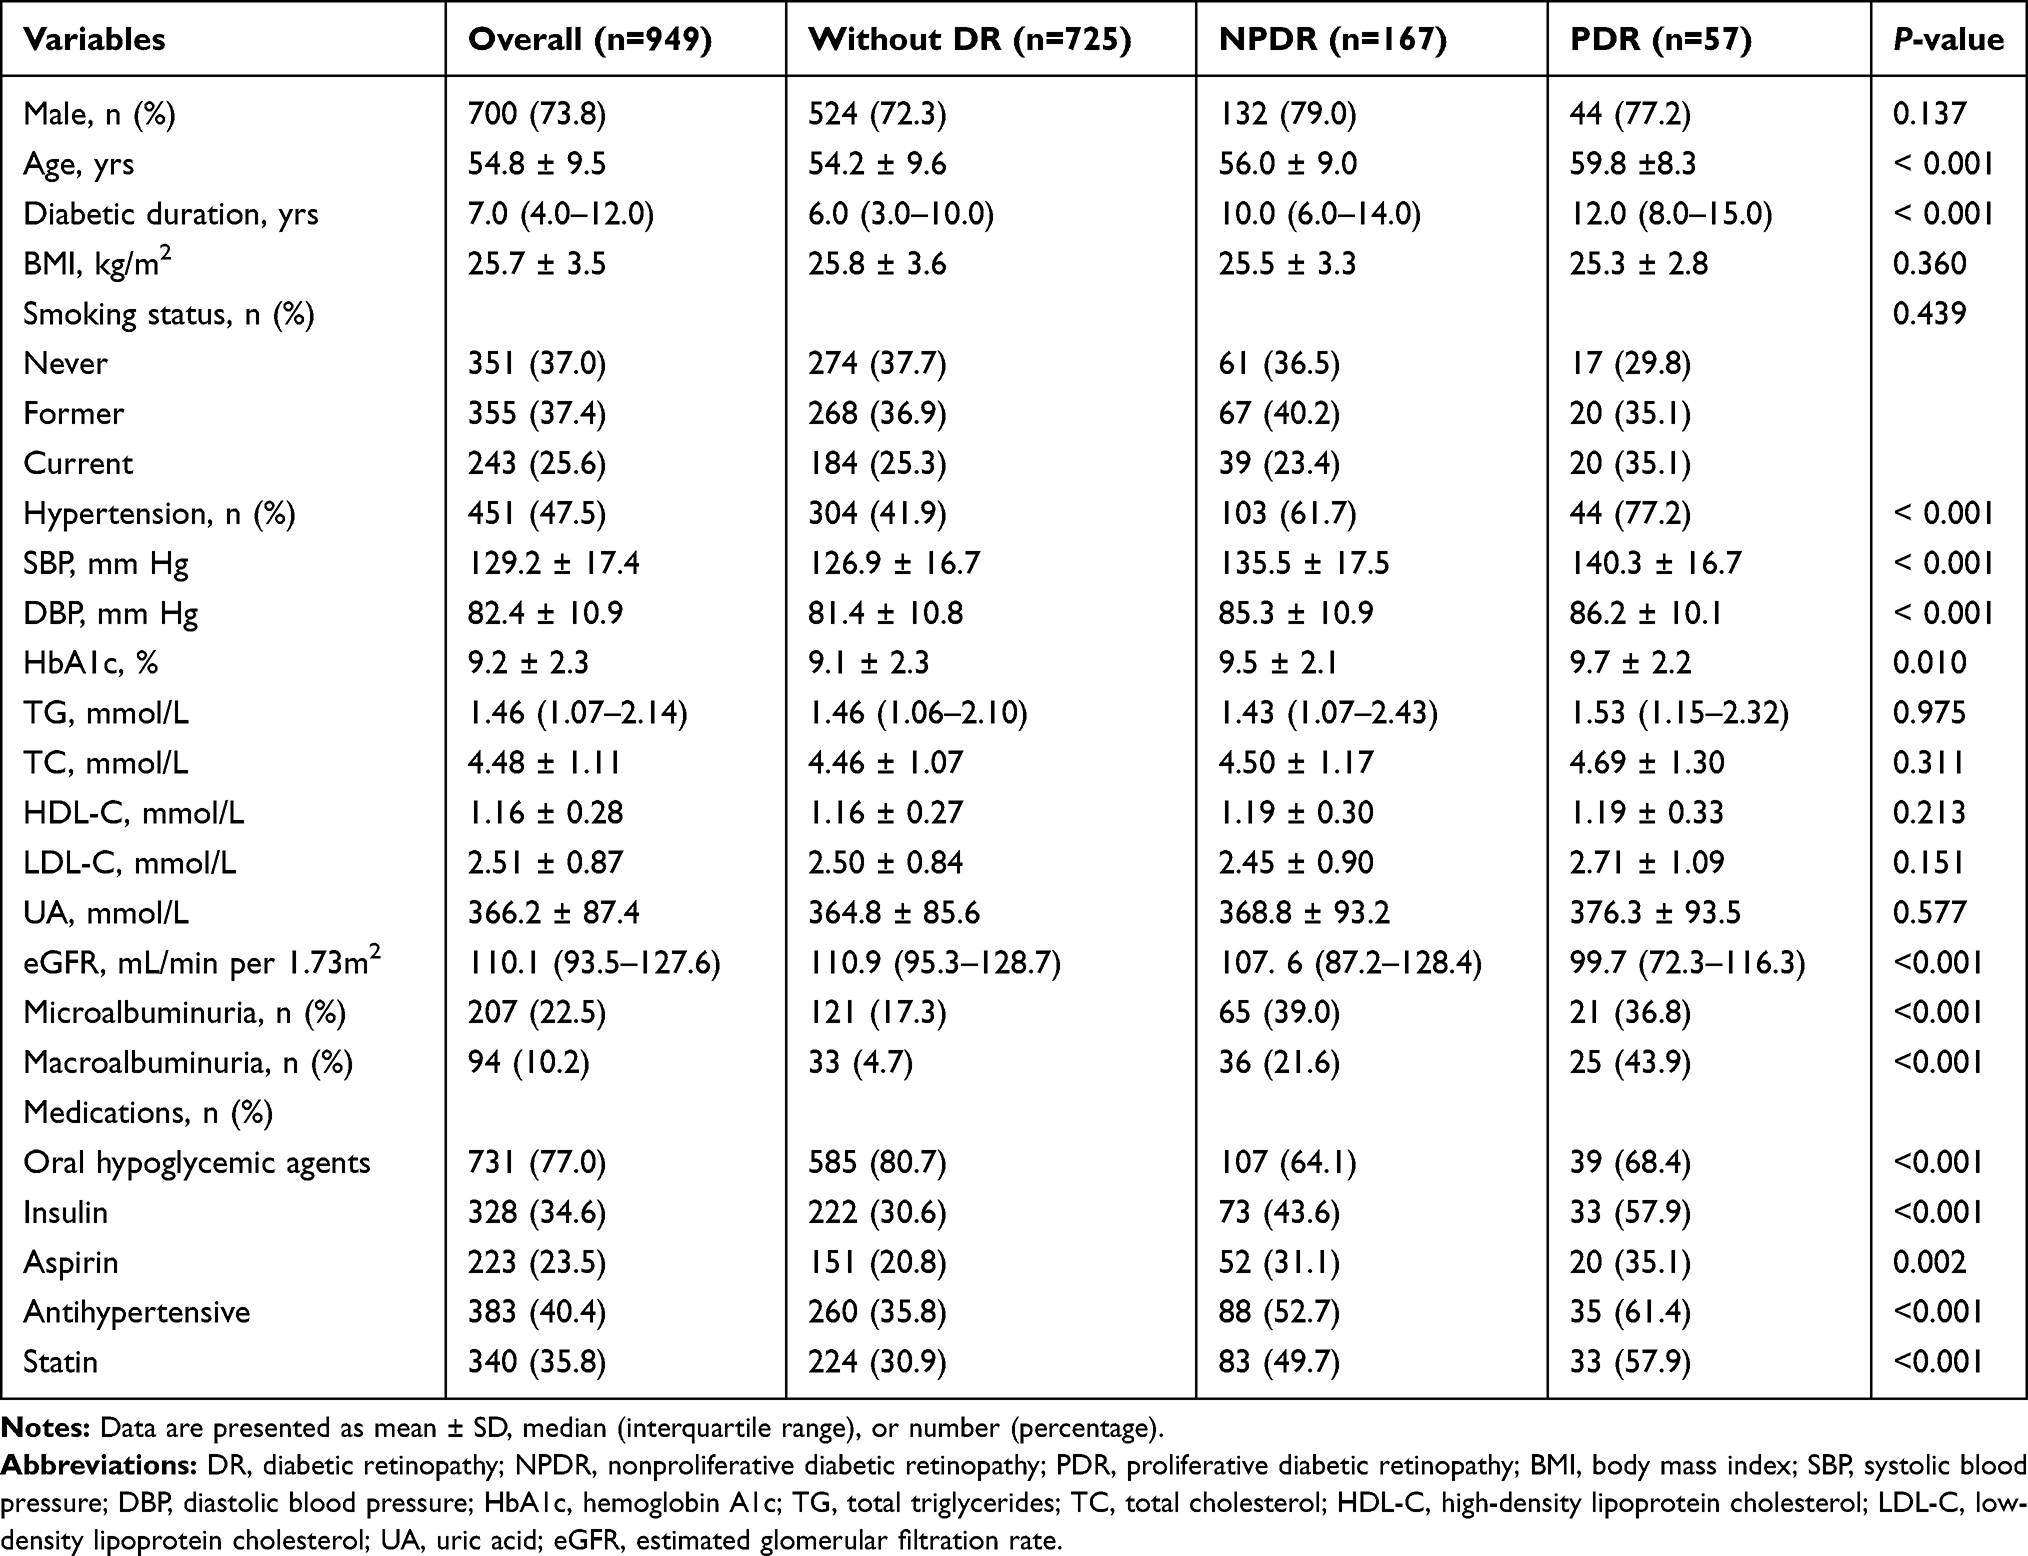 |
Table 1 Characteristics of the Study Subjects Grouped by Stage of DR |
The prevalence of increased CAVI was significantly higher in patients with PDR and NPDR than those without DR (77.2% and 44.9 versus 21.5%, P <0.001). Patients with PDR and NPDR had a higher prevalence of increased ABI than those without DR (10.5% and 3.0% versus 1.9%, P <0.001). Patients with PDR and NPDR were more likely to have carotid plaque than those without DR (86.0% and 74.9% versus 60.3%, P < 0.001) (Figure 1).
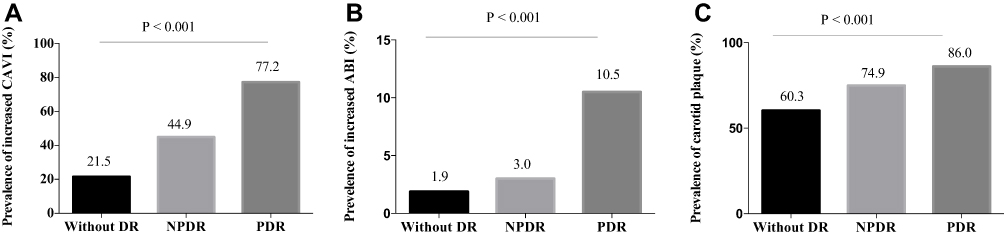 |
Figure 1 Prevalence of increased CAVI, increased ABI, and carotid plaque in subjects without DR, with NPDR, and with PDR. (A). The prevalence of increased CAVI in three groups. (B) The prevalence of increased ABI in three groups. (C). The prevalence of carotid plaque in three groups. Abbreviation: DR, diabetic retinopathy; NPDR, nonproliferative diabetic retinopathy; PDR, proliferative diabetic retinopathy; CAVI, carotid ankle vascular index; ABI, ankle-brachial index. |
In order to analyse other factors that have an influence on DR and atherosclerosis markers, we performed univariate logistic regression analysis to evaluate the relations between increased CAVI, increased ABI, presence of carotid plaque, and presence of DR with clinical variables (Table 2). Our results showed that DR was positively related to age, diabetic duration, hypertension, SBP, DBP, HbA1c, and statin exposure. Increased CAVI was positively related to age, diabetic duration, hypertension, SBP, DBP, HDL-C, TG, and statin exposure. Increased ABI was positively related to sex and BMI. The presence of carotid plaque was positively related to age, diabetic duration, hypertension, SBP, DBP, TC, HDL-C, LDL-C and statin exposure. Both increased CAVI and presence of carotid plaque were negatively related to BMI.
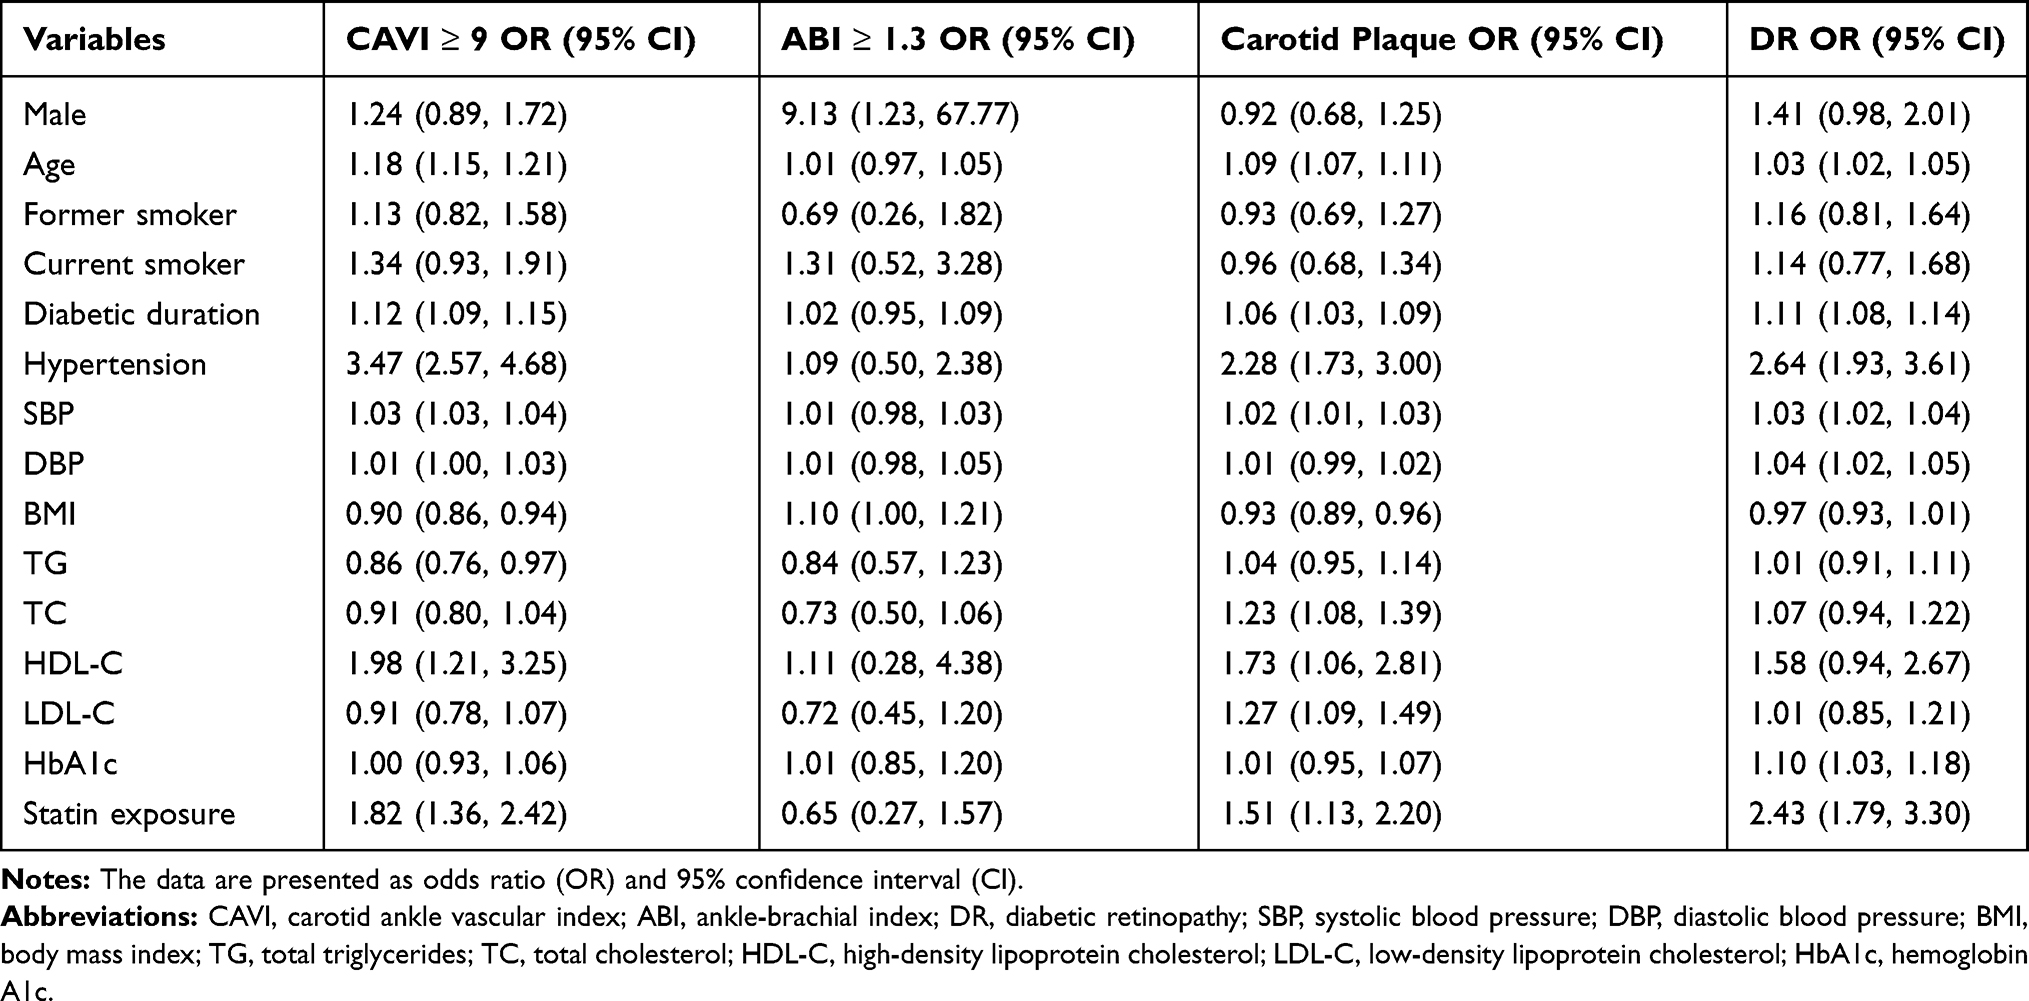 |
Table 2 The Relations Between Atherosclerosis Markers and DR with Various Factors by Univariate Analysis |
In multivariable logistic regression analysis (Table 3 and Figure 2), after adjusting for other variables (sex, age, diabetic duration, BMI, smoking status, presence of hypertension, SBP, LDL-C, HDL-C, HbA1c, and statin exposure), patients with NPDR showed an OR of 2.59 (1.61–4.19) for increased CAVI, 1.99 (0.62–6.34) for increased ABI, and 1.75 (1.13–2.71) for presence of carotid plaque. Patients with PDR showed an OR of 7.83 (3.52–17.41) for increased CAVI, 10.65 (3.33–34.04) for increased ABI, and 11.40 (2.67–48.63) for presence of carotid plaque.
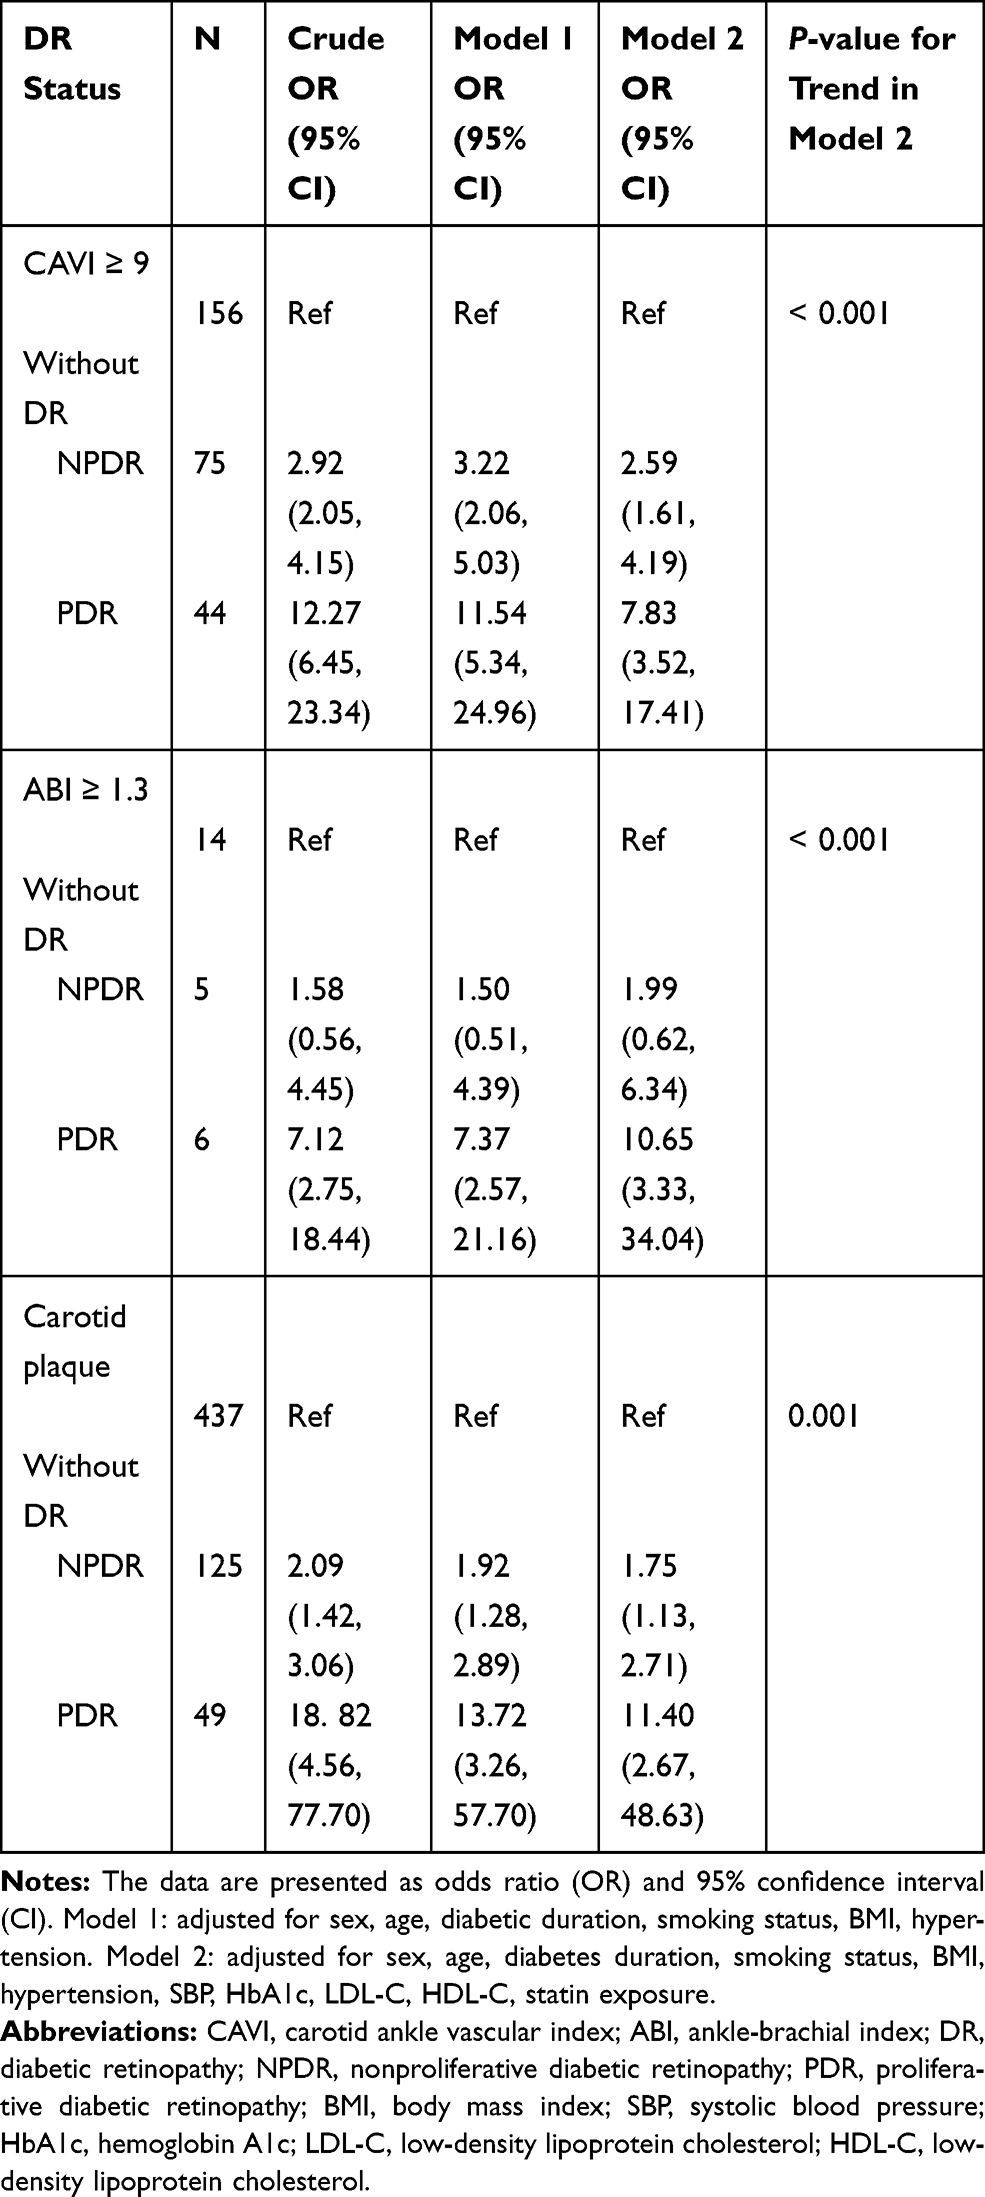 |
Table 3 Odds Ratios for Atherosclerosis Markers According to DR Status |
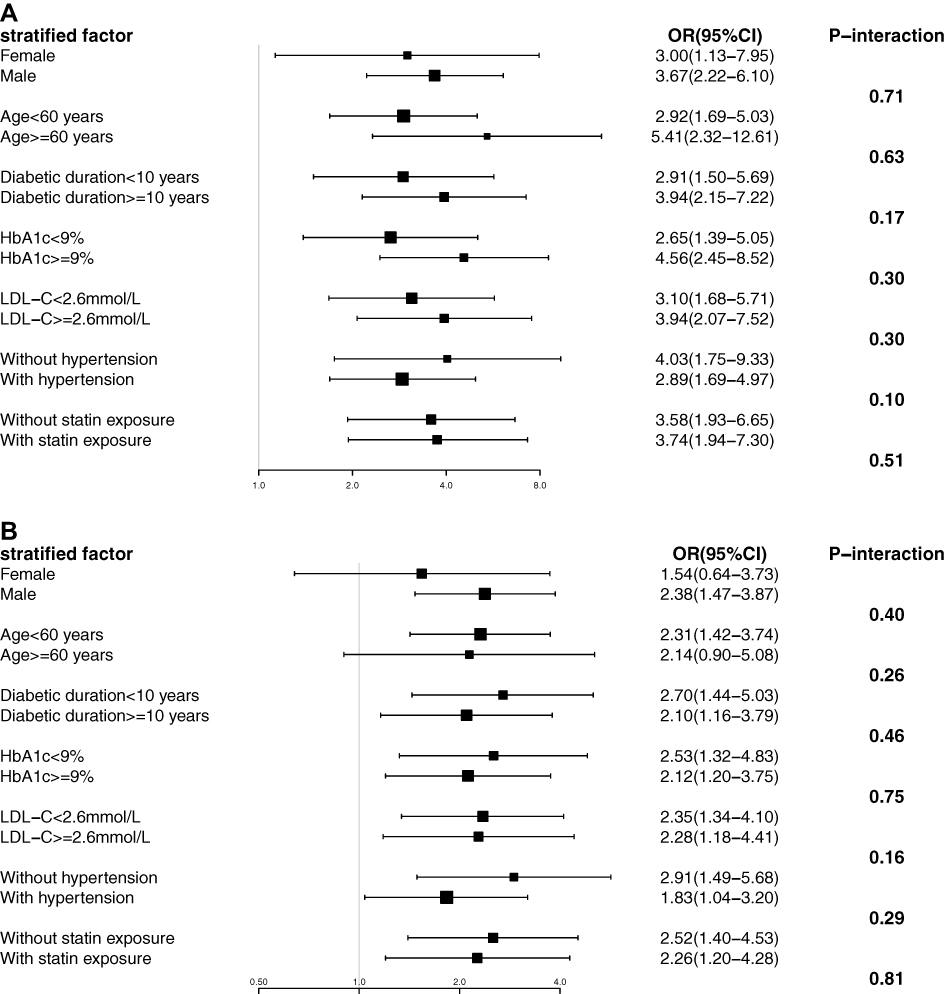 |
Figure 2 Association of atherosclerosis markers and DR in different subgroup. (A) Association of increased CAVI and DR in different subgroup. (B) Association of carotid plaque and DR in different subgroup. The data are presented as OR (95% CI). Each stratification adjusted for all the factors (sex, age, diabetic duration, history of hypertension, LDL-C, HbA1c, and statin exposure) expect the stratification factor itself. Abbreviation: CAVI, carotid ankle vascular index; DR, diabetic retinopathy; LDL-C, low-density lipoprotein cholesterol; HbA1c, hemoglobin A1c. |
To further confirm whether there were possible interaction effects on the association between atherosclerosis markers (CAVI and carotid plaque) with DR, stratifies analysis were performed according to the different subgroup, include sex (female and male), age (<60 years and ≥60 years), diabetic duration (<10 years and ≥10 years), history of hypertension (without and with hypertension), LDL-C (<2.6 mmol/L and ≥2.6 mmol/L), HbA1c (<9% and ≥9%), and statin exposure (with and without statin exposure). All analysis were adjusted for sex, age, diabetic duration, history of hypertension, LDL-C, HbA1c, and statin exposure except for the variable that was stratified. As shown in Figure 2, sub-group analysis stratified by different subgroups showed that there was no interaction term between increased CAVI and carotid plaque with DR.
Discussion
In this cross-sectional study, we examined the association between atherosclerosis and DR. Our results showed NPDR was significantly associated with increased odds of carotid plaque and increased of CAVI, and PDR was associated with increased odds of carotid plaque, increased of CAVI, and increased ABI after adjustment for sex, age, diabetic duration, and other traditional cardiovascular factors.
In the global DR study, longer duration of T2DM, higher level of HbA1c, and poorer blood pressure control were strongly associated with DR.3,35 In the present study, we showed a similar result, in that, diabetic duration, HbA1c, SBP, and DBP were significantly associated with DR in the univariate analysis. It has been previously reported that dyslipidemia was associated with DR.36 While the relationship between DR and plasma lipid levels was not significant in our study. Lee37 did not find a significant correlation between the TG/HDL-C ratio and DR. They have hypothesized that serum lipids were involved more in the later stages of DR than the early stages. Unexpectedly, we found there was positive correlation between increased CAVI and carotid plaque with HDL-C. Many large cohort studies and randomized trails have showed that HDL-C is a strong, independent, inverse predictor of the risk of atherosclerotic cardiovascular disease.38,39 However, there still remains a debate.40 HDL have pleiotropic beneficial effect on the atherogenesis and promote the removal of excess cholesterol from lipid laden macrophages to liver. These effects are only weakly correlated with HDL-C levels. Besides, mendelian randomization does not support a link of causality and intervention of raising HDL-C has not yielded the expected outcomes.40,41 In this present study, the positive correlation was found in univariate analysis, therefore potential confounders may exist.
Several previous studies have assessed the association between atherosclerosis and DR in patients with T2DM. A study suggested that DR was associated with higher atherosclerosis burden (described as presence and number of carotid plaques).42 Carotid plaque and increased CIMT were associated with increased odds of the presence of DR among Chinese population.14 Saif investigated the correlation between the severity of DR and CIMT in 140 normotensive Egyptian patients with T2DM and DR and proved that both NPDR and PDR are strong determinants of CIMT and atherosclerosis.43 Consistent with the findings of previous studies, our results showed that both NPDR and PDR were independently associated with the presence of carotid plaque. Chen12 reported that an abnormally low or high ABI was associated with proliferative DR in T2DM. In the present study, we excluded patients with ABI <0.9 and our results showed only PDR but not NPDR was associated with increased ABI. However, because of relatively small number of patients with increased ABI (24/949), the statistical power may be affected. Therefore it should be further explored when new eligible study appears.
Arterial stiffness is considered as a marker of atherosclerosis and vascular function. PWV is widely used as a common index of arterial stiffness and one of the markers for assessing vascular damage.20 Several studies have reported associations between DR and arterial stiffness measured using PWV.13,15,44 PWV could be influenced by BP during the measurement, and it is higher in hypertensive patients.23 Besides, any stimulus that puts pressure on the artery may interfere the results.21 In addition, PWV could not accurately reflect the pathological changes in the early development of atherosclerosis until calcification developed in the atherosclerotic plaque.23 CAVI, however, is unaffected by arterial BP. Increased CAVI indicates not only arterial stiffness caused by pathological changes in the arterial wall, but also an increased vascular tone caused by smooth muscle cell contracture. Thus, it represents both “functional” and “organic” stiffness the arteries.45 Herein we used CAVI as the indictor of arterial stiffness, which is superior to PWV. Miyamoto reported that CAVI had a positive correlation with CIMT or plaque score, but not with DR.16 However, a positive association between CAVI and DR (both NPDR and PDR) was found in this study. This might be owing to the difference in the study population. Although their study included lesser number of patients (n=102), the prevalence of DR (47%) was higher than that in our study. To the best of our knowledge, this is the first study to explore the relationship between CAVI and DR in Chinese patients with T2DM.
Vascular-related complications, like coronary heart disease and peripheral arterial occlusive disease, are the leading cause of morbidity and mortality in patients with DM. Atherosclerosis is the central pathological change in macrovascular disease, which leads to narrowing of arterial walls throughout the body.46 Yokoyama found that elevation of albuminuria was an independent determinant of IMT and PWV in T2DM.47 They suggested a possible link in the pathogenesis between atherosclerosis and diabetic nephropathy. In a population cohort of individuals with T2DM from the UK, significant associations were observed for the first major cardiovascular event (a priori composite of cardiovascular death, non-fatal myocardial infarction, or nonfatal ischaemic stroke) individually for retinopathy (HR: 1.39, 95% CI: 1.09–1.76), peripheral neuropathy (1.40, 1.19–1.66) and nephropathy (1.35, 1.15–1.58). The findings showed that the cumulative burden of microvascular disease is a determinant of future cardiovascular risk.48 This present study adds to the evidence that atherosclerosis is associated with diabetic microvascular complications. The exact mechanisms underlying the association between the two remains unclear. A possible explanation is that atherosclerosis and microvascular complication share same physiopathologic mechanism (for example, endothelial injury, chronic inflammation and enhanced oxidative stress) and other independent accelerating risk factors (for example, smoking, hypertension and hyperlipidemia).49
There are several limitations in this study. First, this was a retrospective cross-sectional study, which did not confirm the causal relationship between atherosclerosis and DR. Second, there may be a selection bias as hospitalized patients usually present a more severe form of the disease. Third, the study was performed at a single institution and only involved Chinese patients; therefore, the results might not be generalized to populations of different ethnicities. While we acknowledge these limitations, we must consider the strength of the present study. In most previous studies, the analyses were conducted using either the structural or functional markers of atherosclerosis. Herein, we evaluated both, the structural and functional markers of atherosclerosis and provided useful evidence to show that atherosclerosis was associated with DR in patients with T2DM.
In conclusion, we used the ABI and carotid plaque as markers of structural change and CAVI as a marker of functional change of atherosclerosis. Our results revealed that both the structural and functional markers of atherosclerosis were associated with DR in patients with T2DM.
Acknowledgments
The abstract of this paper was presented at the Advanced Technologies & Treatments for Diabetes Conference (Madrid, Spain–February 19–22, 2020) as an abstract presentation with interim findings. The poster’s abstract was published in “E-Poster Viewing Abstracts” in Journal “Diabetes Technology & Therapeutics, Vol. 22, No.S1” (https://doi.org/10.1089/dia.2020.2525.abstracts).
Disclosure
The authors report no conflicts of interest in this work.
References
1. Heng LZ, Comyn O, Peto T, et al. Diabetic retinopathy: pathogenesis, clinical grading, management and future developments. Diabet Med. 2013;30(6):640–650. doi:10.1111/dme.12089
2. Leasher JL, Bourne RR, Flaxma SR, et al. Global estimates on the number of people blind or visually impaired by diabetic retinopathy: a meta-analysis from 1990–2010. Diabetes Care. 2016;39(9):1643–1649. doi:10.2337/dc15-2171
3. Yau JW, Rogers SL, Kawasaki R, et al. Global prevalence and major risk factors of diabetic retinopathy. Diabetes Care. 2012;35(3):556–564. doi:10.2337/dc11-1909
4. Song P, Yu J, Chan KY, et al. Prevalence, risk factors and burden of diabetic retinopathy in China: a systematic review and meta-analysis. J Glob Health. 2018;8(1):010803. doi:10.7189/jogh.08.010803
5. Cheung N, Wong TY. Diabetic retinopathy and systemic vascular complications. Prog Retin Eye Res. 2008;27(2):161–176. doi:10.1016/j.preteyeres.2007.12.001
6. Juutilainen A, Lehto S, Ronnemaa T, et al. Retinopathy predicts cardiovascular mortality in type 2 diabetic men and women. Diabetes Care. 2007;30(2):292–299. doi:10.2337/dc06-1747
7. Kramer CK, Rodrigues TC, Canani LH, et al. Diabetic retinopathy predicts all-cause mortality and cardiovascular events in both type 1 and 2 diabetes: meta-analysis of observational studies. Diabetes Care. 2011;34(5):1238–1244. doi:10.2337/dc11-0079
8. Lusis AJ. Atherosclerosis. Nature. 2000;407(6801):233–241. doi:10.1038/35025203
9. DeFronzo RA. Insulin resistance, lipotoxicity, type 2 diabetes and atherosclerosis: the missing links. The claude bernard lecture 2009. Diabetologia. 2010;53(7):1270–1287. doi:10.1007/s00125-010-1684-1
10. Li MF, Zhao CC, Li TT, et al. The coexistence of carotid and lower extremity atherosclerosis further increases cardio-cerebrovascular risk in type 2 diabetes. Cardiovasc Diabetol. 2016;15(1):43. doi:10.1186/s12933-016-0360-2
11. Blankenhorn DH, Kramsch DM. Reversal of atherosis and sclerosis. The two components of atherosclerosis. Circulation. 1989;79(1):1–7. doi:10.1161/01.CIR.79.1.1
12. Chen SC, Hsiao PJ, Huang JC, et al. Abnormally low or high ankle-brachial index is associated with proliferative diabetic retinopathy in type 2 diabetic mellitus patients. PLoS One. 2015;10(7):e0134718. doi:10.1371/journal.pone.0134718
13. Ogawa O, Hayashi C, Nakaniwa T, et al. Arterial stiffness is associated with diabetic retinopathy in type 2 diabetes. Diabetes Res Clin Pract. 2005;68(2):162–166. doi:10.1016/j.diabres.2004.09.008
14. Liu Y, Teng X, Zhang W, et al. Association between diabetic retinopathy and subclinical atherosclerosis in China: results from a community-based study. Diab Vasc Dis Res. 2015;12(5):366–372. doi:10.1177/1479164115591744
15. Yun YW, Shin MH, Lee YH, et al. Arterial stiffness is associated with diabetic retinopathy in Korean type 2 diabetic patients. J Prev Med Public Health. 2011;44(6):260–266. doi:10.3961/jpmph.2011.44.6.260
16. Miyamoto M, Kotani K, Okada K, et al. The correlation of common carotid arterial diameter with atherosclerosis and diabetic retinopathy in patients with type 2 diabetes mellitus. Acta Diabetol. 2012;49(1):63–68. doi:10.1007/s00592-011-0287-8
17. Van Hecke MV, Dekker JM, Nijpels G, et al. Are retinal microvascular abnormalities associated with large artery endothelial dysfunction and intima-media thickness? The hoorn study. Clin Sci (Lond). 2006;110(5):597–604. doi:10.1042/CS20050270
18. Palombo C, Kozakova M. Arterial stiffness, atherosclerosis and cardiovascular risk: pathophysiologic mechanisms and emerging clinical indications. Vascul Pharmacol. 2016;77:1–7. doi:10.1016/j.vph.2015.11.083
19. Cardoso CR, Ferreira MT, Leite NC, et al. Microvascular degenerative complications are associated with increased aortic stiffness in type 2 diabetic patients. Atherosclerosis. 2009;205(2):472–476. doi:10.1016/j.atherosclerosis.2008.12.027
20. Yamashina A, Tomiyama H, Takeda K, et al. Validity, reproducibility, and clinical significance of noninvasive brachial-ankle pulse wave velocity measurement. Hypertens Res. 2002;25(3):359–364. doi:10.1291/hypres.25.359
21. Yambe T, Yoshizawa M, Saijo Y, et al. Brachio-ankle pulse wave velocity and cardio-ankle vascular index (CAVI). Biomed Pharmacother. 2004;58(Suppl 1):S95–S98. doi:10.1016/S0753-3322(04)80015-5
22. Nakamura K, Tomaru T, Yamamura S, et al. Cardio-ankle vascular index is a candidate predictor of coronary atherosclerosis. Circ J. 2008;72(4):598–604. doi:10.1253/circj.72.598
23. Takaki A, Ogawa H, Wakeyama T, et al. Cardio-ankle vascular index is superior to brachial-ankle pulse wave velocity as an index of arterial stiffness. Hypertens Res. 2008;31(7):1347–1355. doi:10.1291/hypres.31.1347
24. Shirai K, Utino J, Otsuka K, et al. A novel blood pressure-independent arterial wall stiffness parameter; cardio-ankle vascular index (CAVI). J Atheroscler Thromb. 2006;13(2):101–107. doi:10.5551/jat.13.101
25. Ibata J, Sasaki H, Kakimoto T, et al. Cardio-ankle vascular index measures arterial wall stiffness independent of blood pressure. Diabetes Res Clin Pract. 2008;80(2):265–270. doi:10.1016/j.diabres.2007.12.016
26. Satoh-Asahara N, Kotani K, Yamakage H, et al. Cardio-ankle vascular index predicts for the incidence of cardiovascular events in obese patients: a multicenter prospective cohort study (Japan Obesity and Metabolic Syndrome Study: JOMS). Atherosclerosis. 2015;242(2):461–468. doi:10.1016/j.atherosclerosis.2015.08.003
27. Hitsumoto T. Clinical usefulness of the cardio-ankle vascular index as a predictor of primary cardiovascular events in patients with chronic kidney disease. J Clin Med Res. 2018;10(12):883–890. doi:10.14740/jocmr3631
28. Shirai K, Utino J, Saiki A, et al. Evaluation of blood pressure control using a new arterial stiffness parameter, cardio-ankle vascular index (CAVI). Curr Hypertens Rev. 2013;9(1):66–75. doi:10.2174/1573402111309010010
29. Wilkinson CP, Ferris FL, Klein RE, et al. Proposed international clinical diabetic retinopathy and diabetic macular edema disease severity scales. Ophthalmology. 2003;110(9):1677–1682. doi:10.1016/S0161-6420(03)00475-5
30. Touboul PJ, Hennerici MG, Meairs S, et al. Mannheim carotid intima-media thickness and plaque consensus (2004-2006-2011). An update on behalf of the advisory board of the 3rd, 4th and 5th watching the risk symposia, at the 13th, 15th and 20th European stroke conferences, Mannheim, Germany, 2004, Brussels, Belgium, 2006, and Hamburg, Germany, 2011. Cerebrovasc Dis. 2012;34(4):290–296. doi:10.1159/000343145
31. CAVI. Fukuda-Denshi Company L, Tokyo, Japan. Available from: http://www.fukuda.co.jp/english/products/special_features/vasera/cavi.html.
32. Chinese Diabetes Society. Chinese Society of Infectious Disease, Chinese Society or tissue repair and regeneration. Chinese guideline on prevention and management of diabetic foot (2019 edition). Chin J Diabetes Mellitus. 2019;11:92–108.
33. Ma YC, Zuo L, Chen JH, et al. Modified glomerular filtration rate estimating equation for Chinese patients with chronic kidney disease. J Am Soc Nephrol. 2006;17(10):2937–2944. doi:10.1681/ASN.2006040368
34. Levey AS, Eckardt KU, Tsukamoto Y, et al. Definition and classification of chronic kidney disease: a position statement from Kidney Disease: improving Global Outcomes (KDIGO). Kidney Int. 2005;67(6):2089–2100. doi:10.1111/j.1523-1755.2005.00365.x
35. Stratton IM, Kohner EM, Aldington SJ, et al. UKPDS 50: risk factors for incidence and progression of retinopathy in Type II diabetes over 6 years from diagnosis. Diabetologia. 2001;44(2):156–163. doi:10.1007/s001250051594
36. Chew EY, Davis MD, Danis RP, et al. The effects of medical management on the progression of diabetic retinopathy in persons with type 2 diabetes: the Action to Control Cardiovascular Risk in Diabetes (ACCORD) Eye Study. Ophthalmology. 2014;121(12):2443–2451. doi:10.1016/j.ophtha.2014.07.019
37. Lee MY, Hsiao PJ, Huang JC, et al. Associations between triglyceride/high-density lipoprotein cholesterol ratio and micro- and macroangiopathies in type 2 diabetes mellitus. Endocr Pract. 2018;24(7):615–621. doi:10.4158/EP-2017-0254
38. Di Angelantonio E, Sarwar N, et al.; Emerging Risk Factors Collaboration. Major lipids, apolipoproteins, and risk of vascular disease. JAMA. 2009;302:1993–2000.
39. Barter P, Gotto AM, LaRosa JC, et al. HDL cholesterol, very low levels of LDL cholesterol, and cardiovascular events. N Engl J Med. 2007;357(13):1301–1310. doi:10.1056/NEJMoa064278
40. Barter P, Genest J. HDL cholesterol and ASCVD risk stratification: a debate. Atherosclerosis. 2019;283:7–12. doi:10.1016/j.atherosclerosis.2019.01.001
41. Holmes MV, Asselbergs FW, Palmer TM. Mendelian randomization of blood lipids for coronary heart disease. Eur Heart J. 2015;36(9):539–550. doi:10.1093/eurheartj/eht571
42. Alonso N, Traveset A, Rubinat E, et al. Type 2 diabetes-associated carotid plaque burden is increased in patients with retinopathy compared to those without retinopathy. Cardiovasc Diabetol. 2015;14(1):33. doi:10.1186/s12933-015-0196-1
43. Saif A, Karawya S, Abdedhamid A. Retinopathy is a strong determinant of atherosclerosis in type 2 diabetes: correlation with carotid intima media thickness. Endocr Pract. 2015;21(3):226–230. doi:10.4158/EP14390.OR
44. Ogawa O, Hiraoka K, Watanabe T, et al. Diabetic retinopathy is associated with pulse wave velocity, not with the augmentation index of pulse waveform. Cardiovasc Diabetol. 2008;7(1):11. doi:10.1186/1475-2840-7-11
45. Shirai K. Analysis of vascular function using the cardio-ankle vascular index (CAVI). Hypertens Res. 2011;34(6):684–685. doi:10.1038/hr.2011.40
46. Fowler MJ. Microvascular and macrovascular complications of diabetes. Clin Diabetes. 2008;26(2):77–82. doi:10.2337/diaclin.26.2.77
47. Yokoyama H, Aoki T, Imahori M, et al. Subclinical atherosclerosis is increased in type 2 diabetic patients with microalbuminuria evaluated by intima-media thickness and pulse wave velocity. Kidney Int. 2004;66(1):448–454. doi:10.1111/j.1523-1755.2004.00752.x
48. Brownrigg JR, Hughes CO, Burleigh D, et al. Microvascular disease and risk of cardiovascular events among individuals with type 2 diabetes: a population-level cohort study. Lancet Diabetes Endocrinol. 2016;4(7):588–597. doi:10.1016/S2213-8587(16)30057-2
49. Brownlee M. The pathobiology of diabetic complications: a unifying mechanism. Diabetes. 2005;54(6):1615–1625. doi:10.2337/diabetes.54.6.1615
 © 2020 The Author(s). This work is published and licensed by Dove Medical Press Limited. The
full terms of this license are available at https://www.dovepress.com/terms
and incorporate the Creative Commons Attribution
- Non Commercial (unported, 3.0) License.
By accessing the work you hereby accept the Terms. Non-commercial uses of the work are permitted
without any further permission from Dove Medical Press Limited, provided the work is properly
attributed. For permission for commercial use of this work, please see paragraphs 4.2 and 5 of our Terms.
© 2020 The Author(s). This work is published and licensed by Dove Medical Press Limited. The
full terms of this license are available at https://www.dovepress.com/terms
and incorporate the Creative Commons Attribution
- Non Commercial (unported, 3.0) License.
By accessing the work you hereby accept the Terms. Non-commercial uses of the work are permitted
without any further permission from Dove Medical Press Limited, provided the work is properly
attributed. For permission for commercial use of this work, please see paragraphs 4.2 and 5 of our Terms.