Back to Journals » Diabetes, Metabolic Syndrome and Obesity » Volume 13
Association Between Abnormal Glycemic Phenotypes and Microvascular Complications of Type 2 Diabetes Mellitus Outpatients in China
Authors Liu G ![]() , Dou J, Zheng D, Zhang J, Wang M, Li W, Wen J, Lu J, Ji L, He Y
, Dou J, Zheng D, Zhang J, Wang M, Li W, Wen J, Lu J, Ji L, He Y
Received 12 December 2019
Accepted for publication 29 April 2020
Published 27 November 2020 Volume 2020:13 Pages 4651—4659
DOI https://doi.org/10.2147/DMSO.S242148
Checked for plagiarism Yes
Review by Single anonymous peer review
Peer reviewer comments 2
Editor who approved publication: Prof. Dr. Juei-Tang Cheng
Guangxu Liu,1,2 Jingtao Dou,3,4 Deqiang Zheng,1,2 Jie Zhang,1,2 Meiping Wang,1,2 Wei Li,1,2 Jing Wen,1,2 Juming Lu,3 Linong Ji,5 Yan He1,2
1Department of Epidemiology and Biostatistics, School of Public Health, Capital Medical University, Beijing, People’s Republic of China; 2Beijing Municipal Key Laboratory of Clinical Epidemiology, Beijing, People’s Republic of China; 3Department of Endocrinology, Chinese PLA General Hospital, Beijing, People’s Republic of China; 4Department of Endocrinology, Hainan Branch of Chinese PLA General Hospital, Sanya, People’s Republic of China; 5Department of Endocrinology and Metabolism, Peking University People’s Hospital, Beijing, People’s Republic of China
Correspondence: Yan He; Jingtao Dou Email [email protected]; [email protected]
Purpose: The objective of this study was to investigate the association of abnormal glycemic phenotypes with microvascular complications in type 2 diabetes patients.
Participants and Methods: A total of 24,266 participants who were from the multicenter cross-sectional survey of China National HbA1c Surveillance System across China were included in the present study. Diabetes patients with abnormal glucose were divided into three groups according to phenotype: isolated fasting hyperglycemia (IFH), isolated postprandial hyperglycemia (IPH), or combined hyperglycemia (CH). The main outcomes were isolated diabetic retinopathy, isolated diabetic nephropathy, and combined diabetic retinopathy with nephropathy. Multivariate logistic regression was used to assess the association of abnormal glycemic phenotypes with microvascular complications.
Results: The CH phenotype had the highest prevalence of isolated diabetic retinopathy, isolated diabetic nephropathy and combined diabetic retinopathy with nephropathy, followed by IPH. Multivariate analysis showed that the CH phenotype was associated with the highest risk of isolated diabetic retinopathy (OR: 1.20, 95% CI: 1.02– 1.41), isolated diabetic nephropathy (OR: 1.59, 95% CI: 1.27– 2.01) and combined diabetic retinopathy with nephropathy (OR: 1.93, 95% CI: 1.44– 2.59). More importantly, participants with IPH phenotype also showed significantly higher risks of isolated diabetic retinopathy (OR: 1.16, 95% CI: 1.05– 1.28), isolated diabetic nephropathy (OR: 1.37, 95% CI: 1.09– 1.37) and combined diabetic retinopathy with nephropathy (OR:1.64, 95% CI: 1.21– 2.21) compared to the IFH phenotype. After stratifying by age, sex, diabetes duration and BMI, the higher risks of isolated diabetic retinopathy, isolated diabetic nephropathy and combined diabetic retinopathy with nephropathy were confirmed in IPH phenotype group, compared to the IFH phenotype group.
Conclusion: Diabetic patients with IPH phenotype had higher risks of isolated diabetic retinopathy, isolated diabetic nephropathy and combined diabetic retinopathy with nephropathy compared with the participants phenotype of IFH, but lower than the phenotype of CH.
Keywords: abnormal glycemic phenotype, diabetic nephropathy, diabetic retinopathy, type 2 diabetes mellitus
Introduction
Type 2 diabetes mellitus (T2DM) has become a substantial threat to human health in the past decades. According to the estimation from World Health Organization (WHO), the worldwide number of diabetic people would exceed 366 million by 2030.1 In China, the prevalence of diabetes has also risen from 0.67% in 1980 to 10.9% in 20132 and the number is expected to exceed 129.7 million by the year 2030.3 T2DM could lead to microvascular complications which include diabetic nephropathy and diabetic retinopathy. More than 40% of T2DM patients have diabetic nephropathy4 and 18% ~ 43% patients have diabetic retinopathy.5 Furthermore, nephropathy or retinopathy is a major risk factor for end-stage renal disease4 and vision loss6 for the diabetic population, which makes diabetes mellitus a most alarming public health problem.
T2DM is characterized by chronic abnormal glucose metabolism which includes abnormal fasting plasma glucose (FPG) and/or abnormal postprandial plasma glucose (PPG). Many previous studies focused on the association between glucose metabolism and risk of microvascular disease. Some findings showed that elevated FPG or PPG were related to the onset risk of retinopathy and nephropathy.7–9 However, it is inconsistent regarding which type of abnormal glucose metabolism is associated with higher risk of nephropathy and retinopathy. A clinical trial of 151 Japanese T2DM patients showed that only PPG was significantly correlated with the progression of retinopathy and is a stronger predictive factor than FPG,10 whereas another study showed that there was no difference in the predictive value of retinopathy between FPG and PPG.11 For nephropathy, a cross-sectional study showed that FPG was a factor related to positive proteinuria and impaired glomerular filtration rate,12 but one study based on the Systolic Blood Pressure Intervention Trial (SPRINT) found that FPG was not associated with the development of kidney disease.13 The data from a cohort study demonstrated that PPG was a more important determinant of onset and development of nephropathy in T2DM patients.14 Nevertheless, McCance et al reported PPG was equally predictive of nephropathy in T2DM.11 The existing evidence indicates a certain association between the elevation of fasting or postprandial glucose and increasing risk of microvascular disease, however, the type of hyperglycemia that has a larger effect on microvascular complications has not been uniformly addressed. The inconsistency may be explained by the difference in sample size and ethnic group in different studies. To our knowledge, few studies were performed to investigate the contribution of FPG and PPG to the risk of retinopathy and nephropathy in a Chinese population.
To clarify these issues, we extracted a T2DM population to assess the association between abnormal glycemic phenotypes and the risk of microvascular diseases in a Chinese population. This population was collected from a nationwide multicenter study of China National HbA1c Surveillance System (CNHSS).
Participants and Methods
Study Population
The CNHSS project was a cross-sectional large population survey conducted from April to June in 2013 in Mainland China, which was launched by the Chinses Diabetes Society. The CNHSS was established to monitor glycemic control among adult patients with T2DM. The survey recruited a total of 238,639 participants with T2DM from 602 hospitals located in all provincial administrative regions (except Guangxi Zhuang Autonomous Region and Tibet) in China mainland. The inclusion and exclusion criteria have been described previously.15 Briefly, the inclusion criteria were: 1) T2DM outpatients who were 18 years or more; 2) diagnosed by 1999 WHO’s criteria;16 3) treated with antidiabetic agents, diet or lifestyle therapy. The exclusion criteria included: 1) diabetes secondary to other diseases; 2) retinopathy or nephropathy diagnosed prior to diabetes diagnosis; 3) being treated with Chinese herbal medicine only; 4) being pregnant or breast-feeding; and 5) unconsciousness or being unable to communicate. In each workday during the survey period, the first consecutive 7 participants who entered each hospital’s endocrinology outpatient department and had medical records and met the eligibility criteria, were invited to participate in involved hospitals, until 400 participants were recruited in each involved hospital during the whole recruitment period unless the recruitment period had ended. In order to select a representative population whose key features were similar to those of the national T2DM population,2 we randomly selected the sample using a three-stage stratification-random clustering sampling method, based on the distribution proportion of T2DM participants in geographic distribution, economic status and age. Furthermore, the T2DM participants whose date of diagnosis was later than the date of occurrence of microvascular disease were excluded. Finally, 24,266 participants were included in this analysis. All the T2DM participants provided written informed consent before entering the study. Ethics approval was obtained from the Ethics Committee for Clinical Research of the People’s Liberation Army General Hospital, and also accepted by all the participating hospitals.
Data Collection
Information such as age, sex, height, weight, and blood pressure, was collected using a structured form through face-to-face interview by trained fieldworkers or measured through physical examination in the involved hospitals. Clinical characteristics were obtained by checking the medical records, which included glucose level at diagnosis of diabetes, the history of disease, as well as diagnosis date. Participants were required to confirm again whether they were diagnosed with any concomitant diseases or diabetes complications, including hypertension, coronary heart disease, cerebrovascular disease, dyslipidemia, diabetic retinopathy, and diabetic nephropathy, and diagnosis date, and this was checked via medical records of local hospital or diagnosis certificate by secondary or tertiary hospital. They were also required to report treatment information of management of T2DM, including the use of oral antidiabetic drugs (OADs), and different types of insulin, as well as diet or lifestyle therapy. Heights and weights were measured, in light clothing, with the use of standardized stadiometers and scales, respectively. Blood pressure was measured on the right arm using a standard mercury sphygmomanometer or an electronic sphygmomanometer with the subjects resting for at least 5 minutes in a sitting position. All laboratory examinations for FPG, 2-hour PPG (2hPPG), HbA1c and lipids such as triglyceride, total cholesterol and low-density lipoprotein, were performed in local hospital during the survey period. Blood sample was collected in local hospital after overnight 10h fasting for biochemical analyses. The 2hPPG was measured after the participants had completed the 75 g oral glucose tolerance test. All designated researchers were trained on basics of T2DM, procedures of data collection and entry, and details of the face-to-face interview. In addition, quality supervisors checked the reliability of the data by randomly re-interviewing some participants. All the data were entered and uploaded to the central database of CNHSS by experienced fieldworkers.
Definitions of Key Variables
According to FPG and 2hPPG level at diagnosis of diabetes, the abnormal glycemic phenotype included isolated fasting hyperglycemia (IFH) defined as FPG≥7.0 mmol/L and 2hPPG<11.1 mmol/L, isolated postprandial hyperglycemia (IPH) defined as 2hPPG≥11.1 mmol/L and FPG<7.0 mmol/L and combined hyperglycemia (CH) defined as FPG≥7.0 mmol/L and 2hPPG≥11.1 mmol/L. The economic development level was defined as undeveloped region, intermediately developed and developed region based on the Gross Domestic Product (GDP) of each province in 2013. The blood pressure control target was defined as systolic blood pressure<140 mmHg and diastolic blood pressure <90 mmHg. HbA1c control target was defined as <7.0% (53 mmol/mol). The diagnosis of microvascular diseases was confirmed by the medical recordings. Diabetic retinopathy was diagnosed by ophthalmologist based on typical changes of retinopathy on funduscopic examination due to diabetes, including background, pre-proliferative, proliferative or maculopathy. Diabetic nephropathy was defined as having persistent proteinuria, such as urinary albumin excretion rate ≥20 μg/min or urinary albumin ≥30 mg/24h after excluding other causes of kidney damage, urinary system infection, and blood in urine. In this study, the outcomes mainly included isolated diabetic retinopathy (IDR) defined as only diabetic retinopathy not diabetic nephropathy, isolated diabetic nephropathy (IDN) defined as only diabetic nephropathy not diabetic retinopathy and combined diabetic retinopathy and nephropathy (CRN) defined as both of them.
Statistical Analysis
Continuous variables of clinical characteristics were presented as mean with standard deviation or median with interquartile range (IQR). Categorical variables were described as frequency with proportion. Analysis of variance (ANOVA) test or Kruskal–Wallis rank test was applied to compare continuous variables among T2DM participants with different phenotypes. The Bonferroni or Nemenyi test was used for pairwise comparison among three groups. Chi-squared test and Fisher’s exact test were used to compare categorical variables.
Unconditional logistic regression analysis was used to estimate odds ratios (ORs) and 95% confidence intervals (CI) for the association between abnormal glycemic phenotypes (IFH group as reference) and microvascular complications, which were adjusted for potential confounding factors by four step forward multivariable-adjusted models. Model 1 was no adjustment of covariates. Model 2 was adjusted for age and sex. Model 3 was adjusted for age, sex, and diabetes duration. Model 4 was adjusted for age, sex, diabetes duration, BMI, self-monitoring of blood glucose, diabetes treatment, the target of blood pressure control, the target of lipid control, HbA1c and economic development level. Kaplan-Meier analysis was used to plot cumulative incidence of microvascular disease of different abnormal glycemic phenotypes. Then the Log rank test was used to compare the difference of cumulative incidence among abnormal glycemic phenotypes. When we compared the cumulative incidence of microvascular diseases among abnormal glycemic phenotypes, the cross-sectional survey was transformed into a retrospective cohort. The follow-up time was calculated as time in years from the date of diagnosis of diabetes to the date of occurrence of the disease or the date of the survey, whichever came first.
All statistical analyses were performed by the statistical analysis system (SAS) version 9.4 (SAS Institute Inc., Cary, NC, USA). A two-sided value of P <0.05 was considered statistically significant. Kaplan-Meier plot and forest plot were drawn by Graphpad Prism 7 (Graphpad Software Company, CA, USA).
Results
Clinical Characteristics of T2DM Participants
Among the 24,266 participants included in this study, the mean age was 58.9 years (SD 11.3 years). About 54% of participants were male. The number of IFH participants, IPH participants, CH participants was 4493 (18.5%), 10,453 (43.1%) and 9320 (38.4%), respectively. The participants in CH group were more likely to be older; had slightly higher BMI, triglyceride, glucose indices and longer duration of diabetes; had higher proportion of treatment with OADs plus insulin and treatment with insulin only; and had a lower proportion of participants in economically developed region, blood pressure control target and HbA1c control target (Table 1).
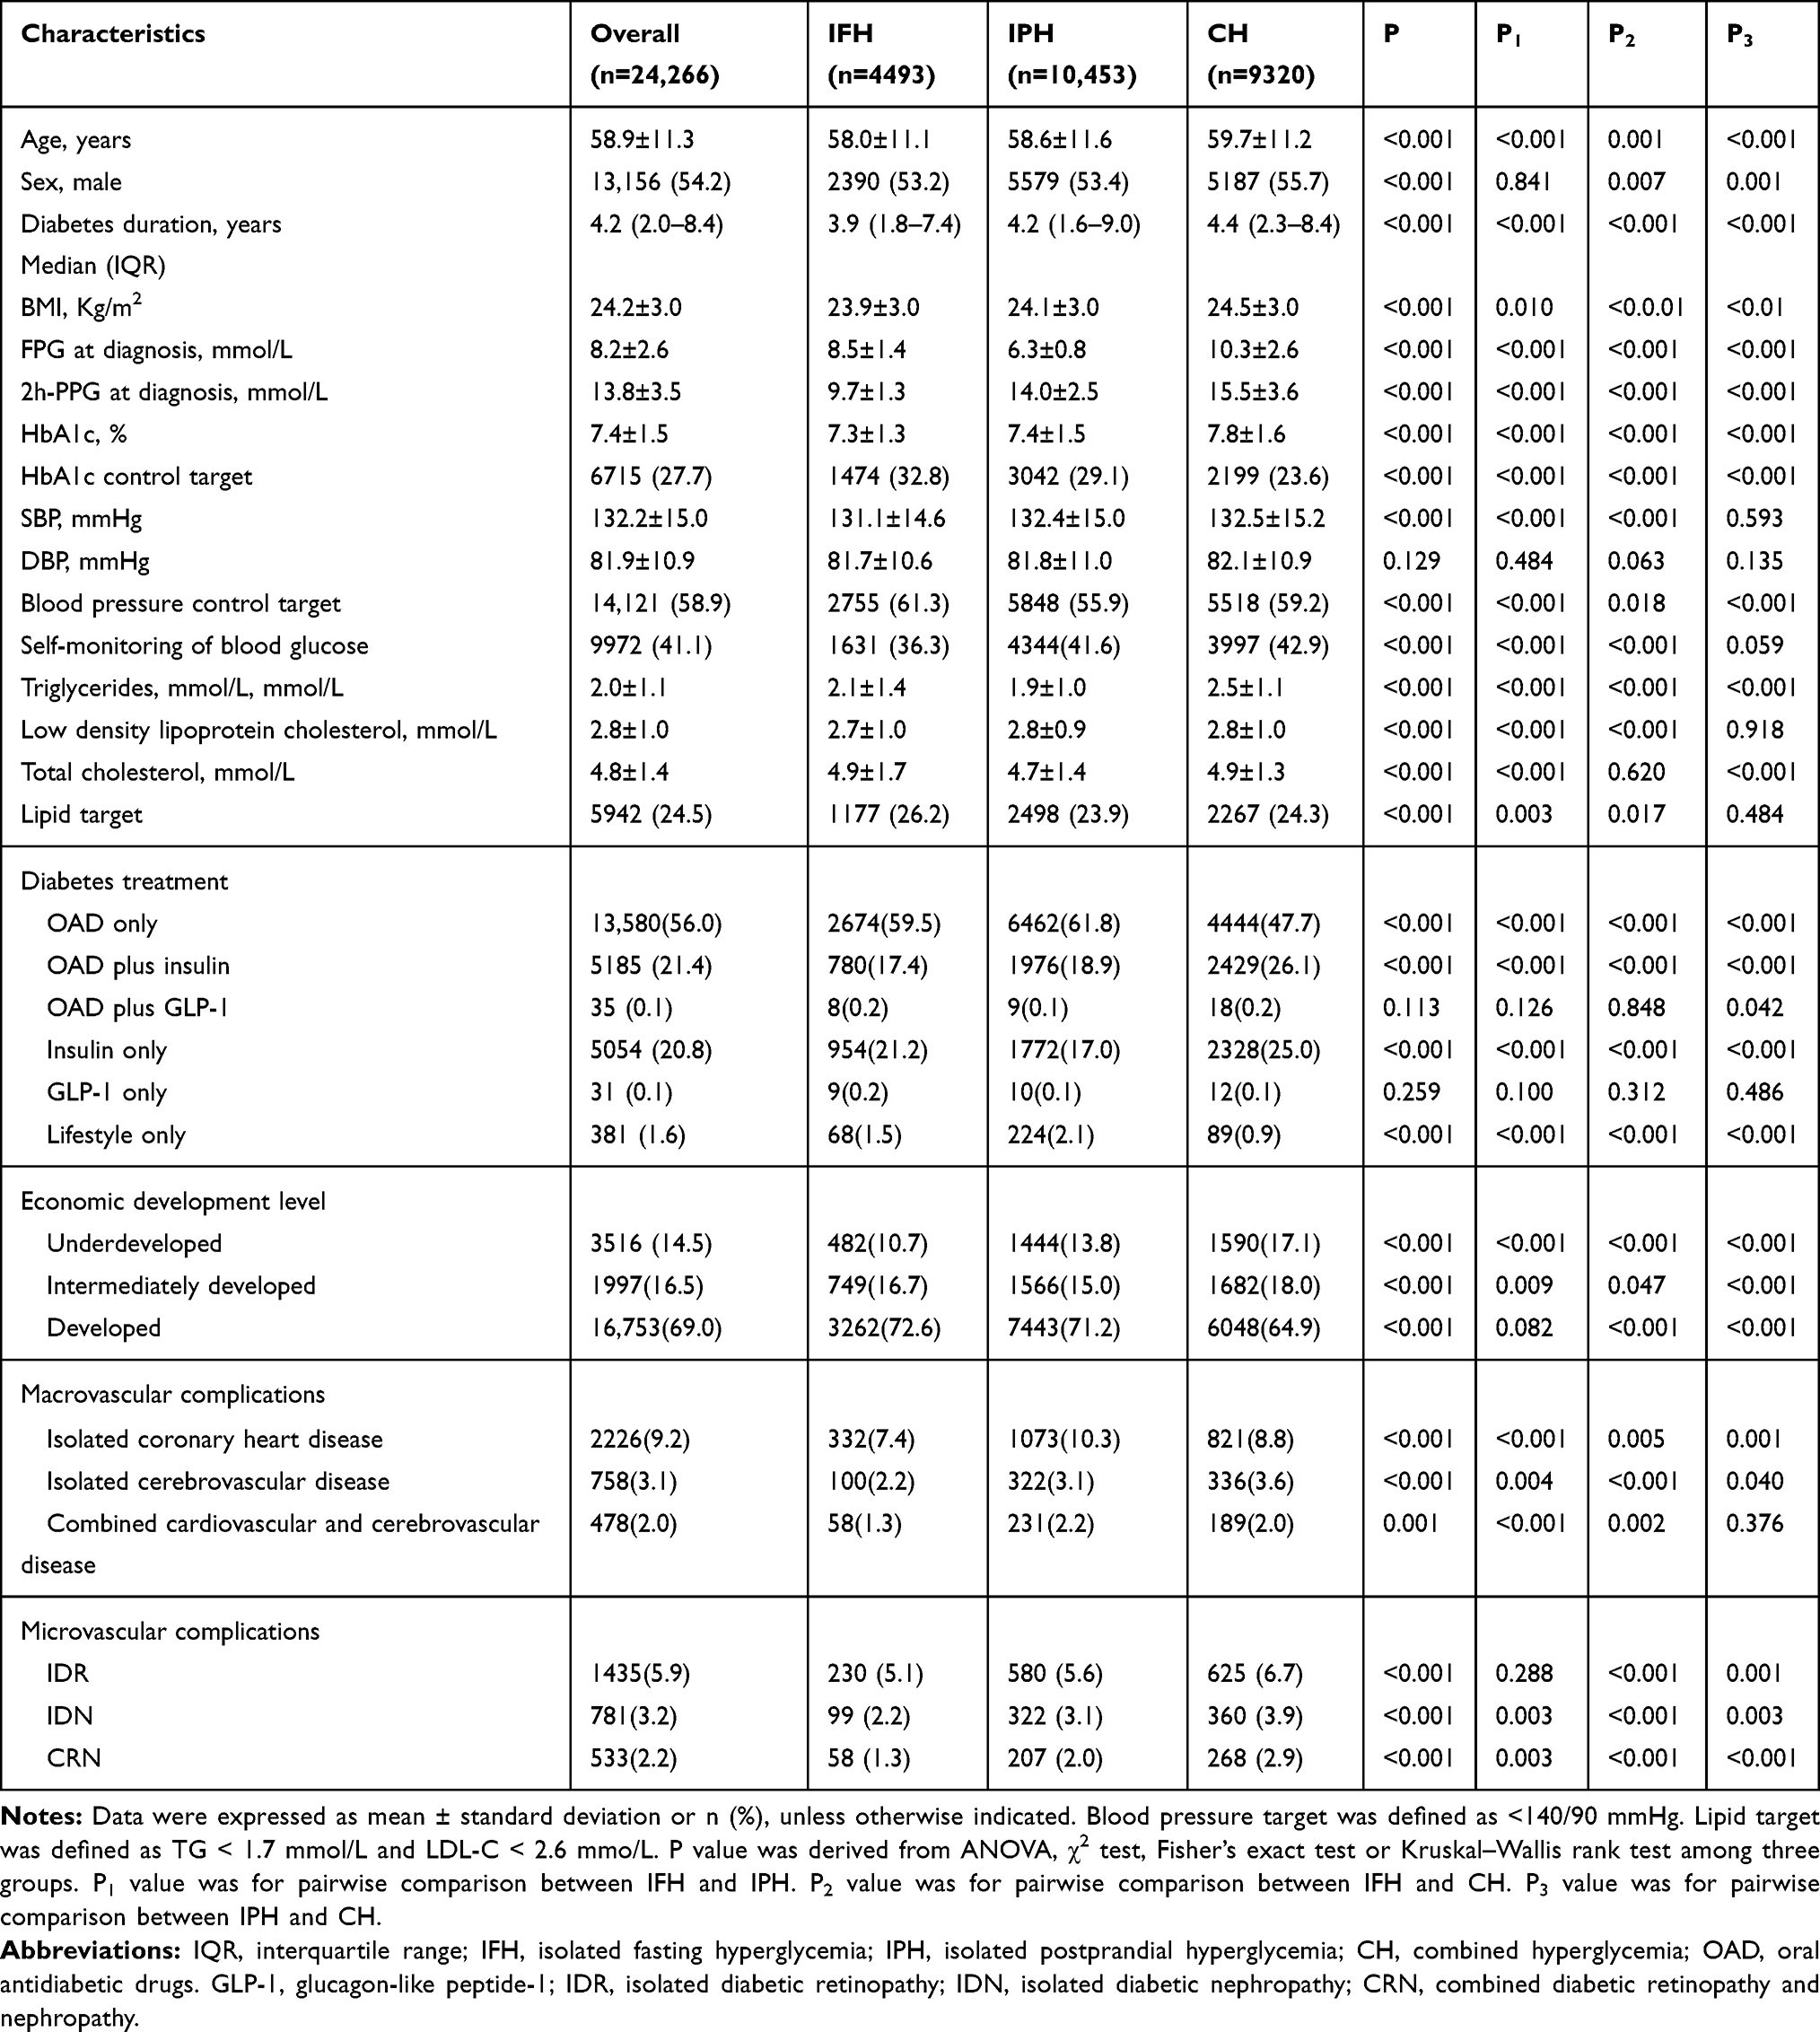 |
Table 1 Characteristics of T2DM Participants with Different Abnormal Glycemic Phenotypes |
Cumulative Incidence of Microvascular Diseases Among T2DM Participants with Different Abnormal Glycemic Phenotypes
In different phenotype groups of IFH, IPH and CH, the cumulative incidences of IDR were 5.1%, 5.5% and 6.7%, the cumulative incidences of IDN were 2.2%, 3.1% and 3.9%, and the cumulative incidences of CRN were 1.3%, 2.0% and 2.9% (Table 1). Kaplan-Meier curves in three phenotype groups appeared slightly different within diabetes duration of 5 years and started to separate and continued to diverge with increasing diabetes duration (Figure 1). Participants with CH phenotype showed the highest cumulative incidences of IDR, IDN and CRN, followed by IPH phenotype (Log rank test P<0.001). Through pairwise comparison, the phenotype of IPH showed a significantly higher cumulative incidence of IDR, IDN and CRN than IFH phenotype group, but lower cumulative incidence compared to those in the CH phenotype group (All P for pairwise comparison <0.001).
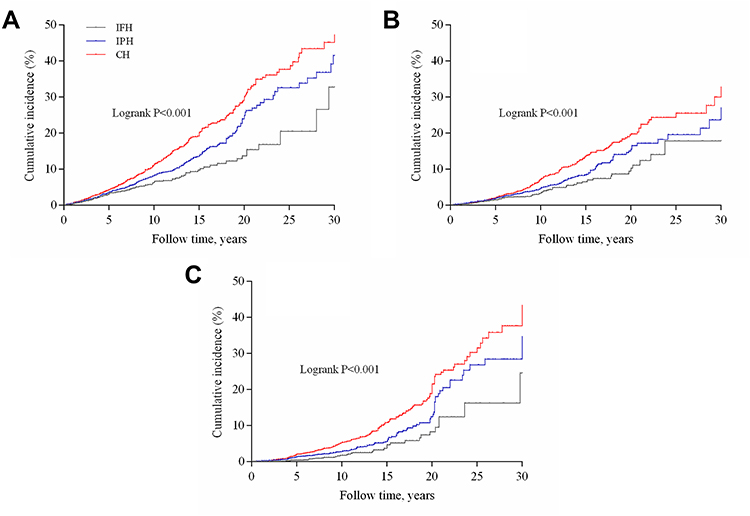 |
Figure 1 Cumulative incidence of microvascular diseases stratified by abnormal glycemic phenotype for T2DM participants: (A) isolated diabetic retinopathy (IDR), (B) isolated diabetic nephropathy (IDN), (C) combined diabetic retinopathy and nephropathy (CRN). Log rank test for microvascular diseases of T2DM participants with different abnormal glycemic phenotype (all P<0.05 in pairwise comparison among three phenotypes: IDR, IDN and CRN). |
Association Between Abnormal Glycemic Phenotypes and Microvascular Diseases in T2DM Participants
In the multivariable-adjusted model, after step forward adjustment for age, sex, diabetes duration, BMI, self-monitoring of blood glucose, diabetes treatment, the target of blood pressure control, the target of lipid control, HbA1c and economic development level, the results were similar across different models. The full adjusted covariate model, using the phenotype of IFH as reference, showed that participants with IPH phenotype presented a significantly higher risk of IDR (OR: 1.16, 95% CI: 1.05–1.28), IDN (OR: 1.37, 95% CI: 1.09–1.37) and CRN (OR:1.64, 95% CI: 1.21–2.21). Understandably, the phenotype of CH was associated with the highest risk of IDR (OR: 1.20; 95% CI: 1.02–1.41), IDN (OR: 1.59; 95% CI: 1.27–2.01) and CRN (OR: 1.93, 95% CI: 1.44–2.59) (Table 2). After stratifying the participants by age, sex, duration of diabetes, and BMI, the subgroup analysis still indicated similar results of the higher risks of IDR, IDN and CRN in IPH compared with the phenotype of IFH (Figure 2).
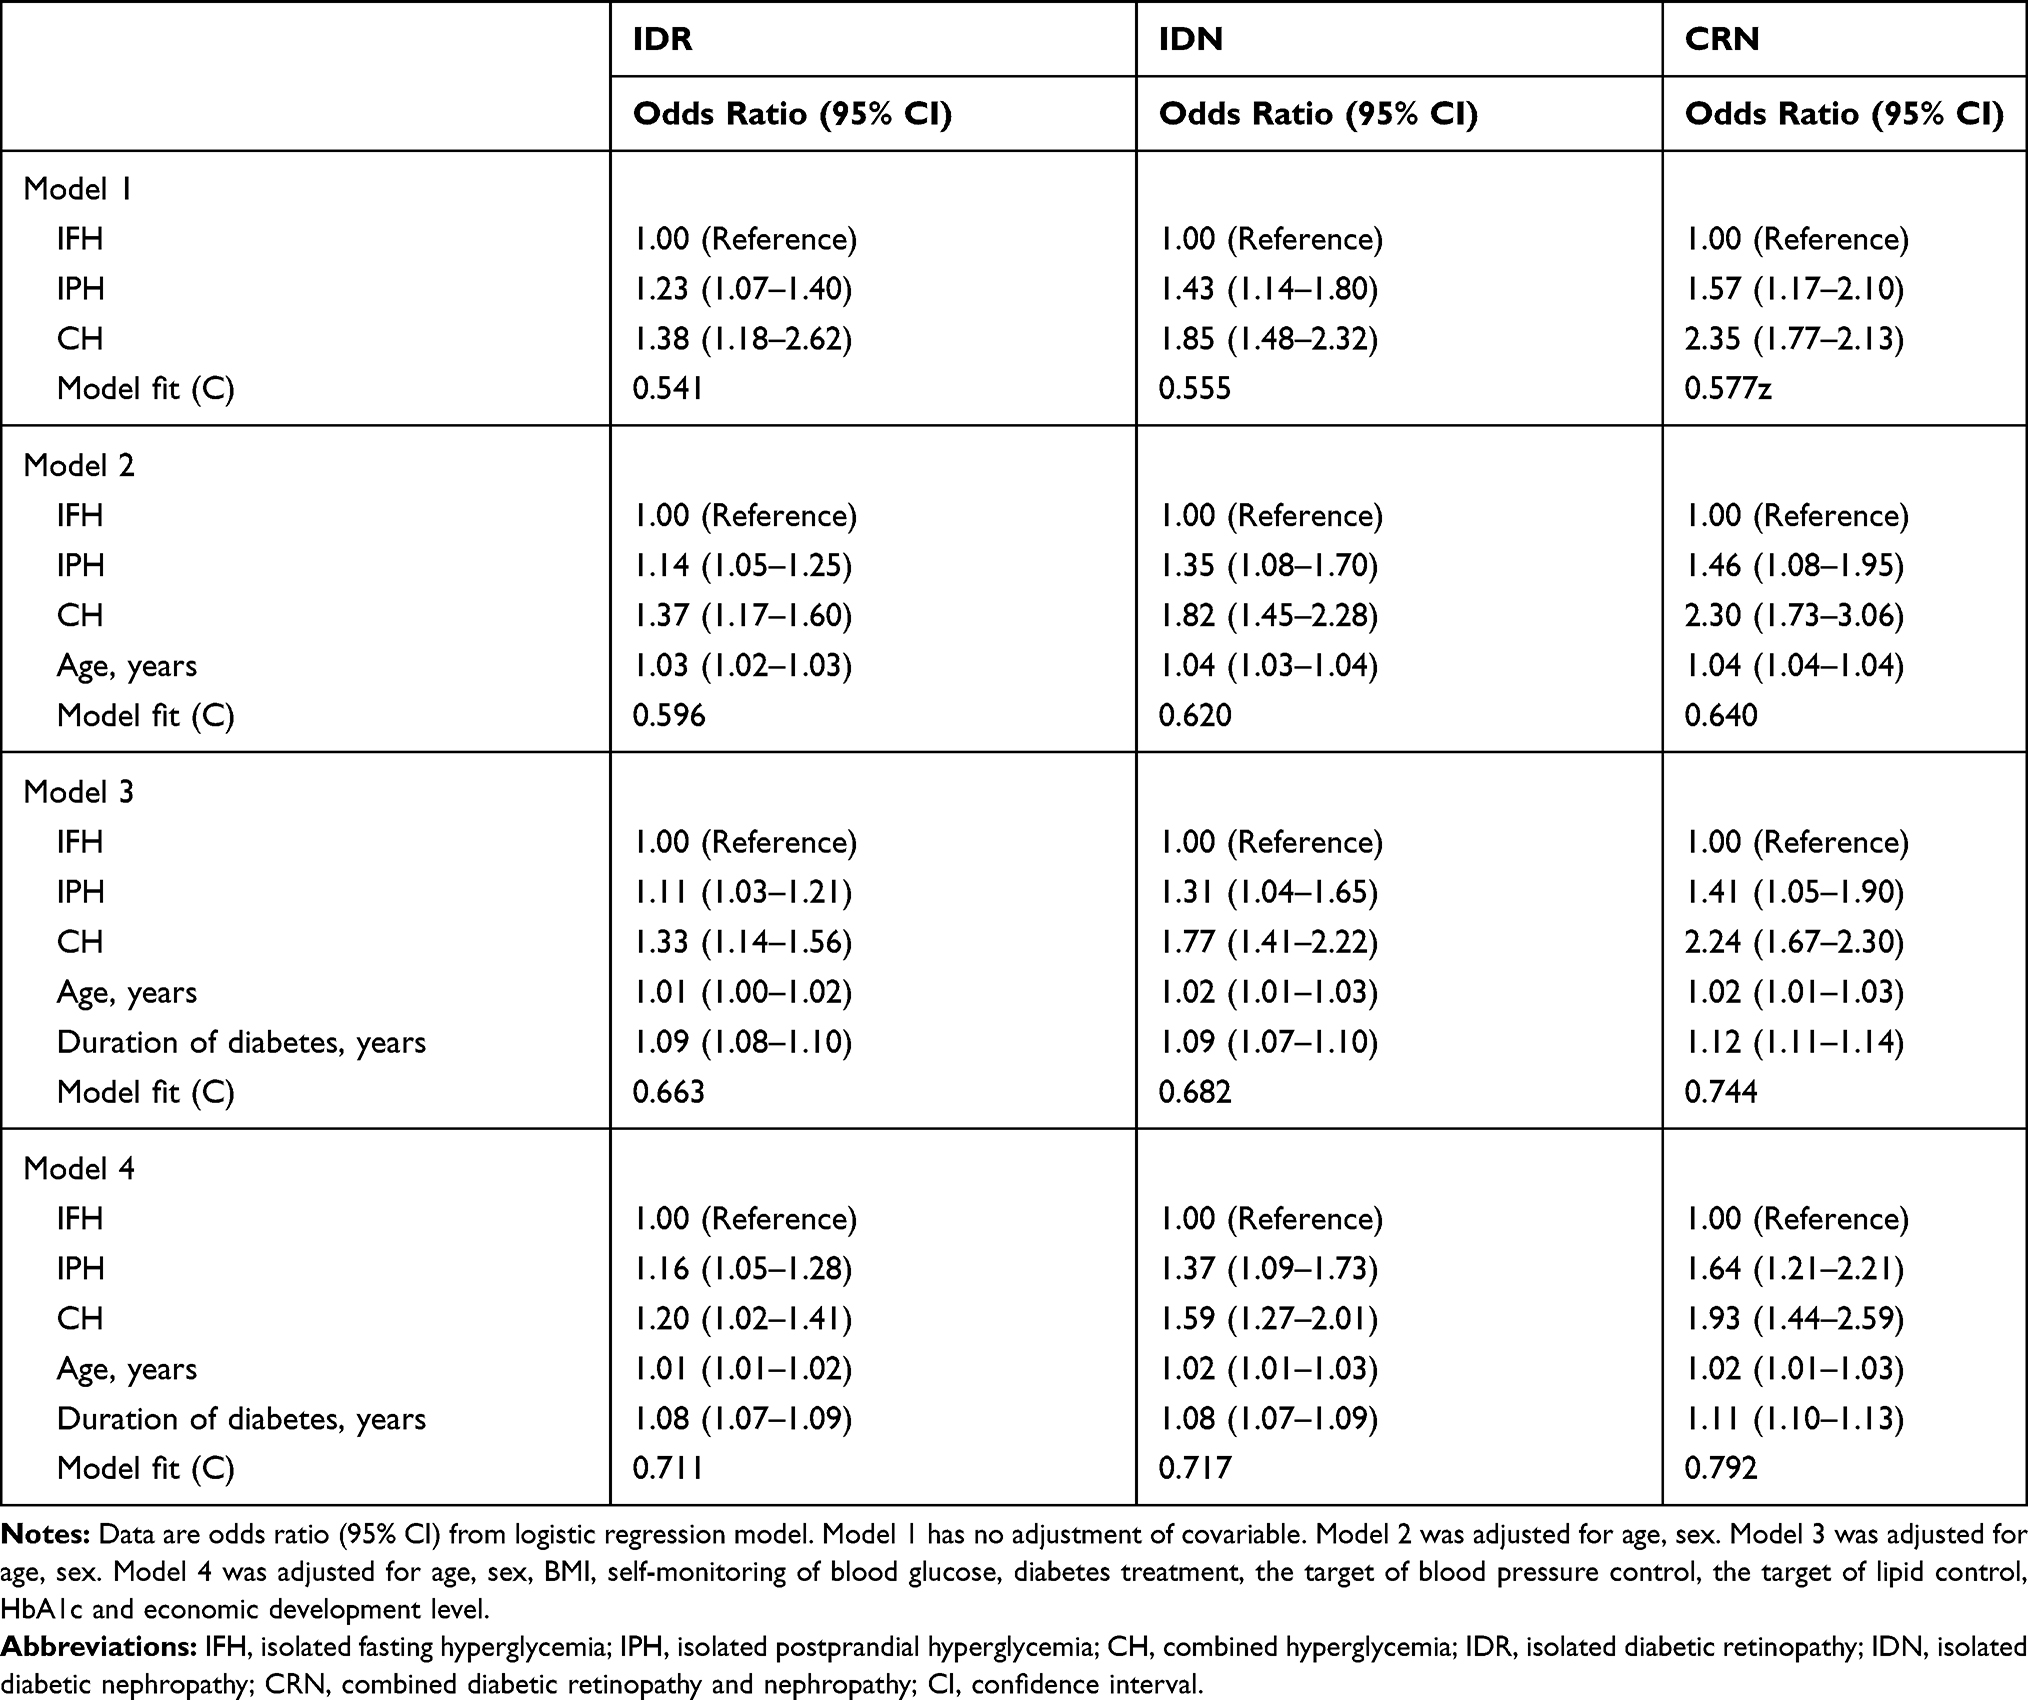 |
Table 2 Association Between Abnormal Glycemic Phenotypes and Microvascular Disease in Type 2 Diabetes Mellitus Participants |
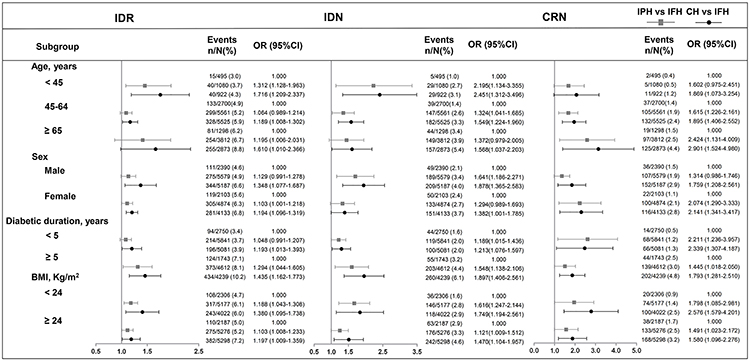 |
Figure 2 Subgroup analysis of association between abnormal glycemic phenotypes and microvascular complication for type 2 diabetes mellitus participants. |
Discussion
In the present study, we demonstrated that participants with IPH phenotype had higher cumulative occurrence and onset risks of IDR, IDN and CRN compared with the participants with IFH phenotype, but lower cumulative onset risks and onset risks of IDR, IDN and CRN compared with the CH phenotype group. These results further occurred in the subgroup analysis stratified by age, sex, duration of diabetes and BMI. To the best of our knowledge, this is the first population-based study to demonstrate the association between abnormal glycemic phenotypes and the onset risk of diabetic microvascular complications in Chinese T2DM population.
Several reasons might account for the higher risk of microvascular complications in IPH phenotype group in our study. Firstly, HbA1c elevation has been accepted as an independent risk factor for diabetic microvascular disease. Several clinical trials previously demonstrated that intensive glucose control (mostly HbA1c target < 7%) can prevent the development or slow down the progress of microvascular complications.17–19 It was reported that postprandial glucose exceeded 50% or fasting glucose for the contribution of HbA1c when HbA1c < 8.4% or 5.1%-7.4%, respectively.20 Furthermore, compared with Caucasians, postprandial blood glucose has a more prominent contribution to HbA1c for Chinese or Asian people.21 A national diabetes epidemiology survey showed nearly half of newly diagnosed diabetes patients had IPH phenotype in China.22 A meta-analysis also reported that PPG had a closer association with HbA1c than FPG, and had a better predictive performance in predicting overall glycemic control.23 As a result, we speculated that intensive HbA1c control caused by decreasing postprandial glucose would obtain more benefit in preventing microvascular disease. Additionally, the mean level of HbA1c was 7.4% in our study, and the participants with IPH phenotype had a worse HbA1c, so the IPH phenotype group presented a greater risk of microvascular complications in this study. In addition, postprandial hyperglycemia is characterized by a rapid and large increase in blood glucose concentrations, which produce an increase in glomerular filtration rate in diabetic patients.24 The hyperperfusion results in a greater stimulus for hyperproduction of collagen which was considered as an important event for pathogenesis of diabetic nephropathy.25 Simultaneously, blood flow was also closely parallel with plasma glucose concentrations,26 which are both pathogenetic factors that are important in the occurrence and progression of retinopathy in diabetic patients.27 For CH phenotype, T2DM patients presented the characteristic of combined fasting and postprandial hyperglycemia, so it had the worst HbA1c control and the highest risks of IDR, IDN or CRN.
The strength of our study is the relatively large sample size, and the participants were recruited from almost all the provinces of China, representing people with T2DM throughout China to some extent. Moreover, the targeted study population was proportionally randomly selected using a three-stage stratification-random clustering sampling method, resulting in the utmost reduction of selection bias. However, there were several limitations in this study. Firstly, diabetes complication cases were ascertained by reviewing medical records, not by systematical screening. Some medical records were not exactly available and therefore some microvascular disease cases might have been missed, especially for T2DM participants in economically disadvantaged regions. As a result, the true prevalence of diabetes complication might have been underestimated. Secondly, lifestyle information such as smoking, drinking, physical exercise and dietary intake, which are associated with vascular disease, was not collected. Thirdly, the study design was cross-sectional, so competing risks could not be considered, and the causal association between phenotypes and complication was not investigated. Fourth, considering the feasibility of the study, the sampling approach of including the first 7 consecutive patients was not completely random, which may have led to bias.
Conclusion
In summary, our data suggest that T2DM participants with IPH phenotype have higher risk of microvascular disease than T2DM patients with IFH phenotype. Through analyzing the differences in the risks of microvascular diseases including IDR, IDN, and CRN, in participants with abnormal glycemic phenotypes, this study could help endocrinologists better identify the high-risk population. Special focus should be directed on T2DM patients with IPH phenotype for the prevention of microvascular diseases in the early stage of diabetes.
Acknowledgments
We appreciate the support of Novo Nordisk Company (Beijing, China) and the efforts of all participants who contributed to the study design and data collection. This study was supported by grant of National Natural Science Foundation of China (31672375) to Yan He. All authors agreed to the content of the manuscript and its submission for publication.
Disclosure
The authors report no conflicts of interest in this work.
References
1. Rathmann W, Giani G. Global Prevalence of Diabetes: estimates for the Year 2000 and Projections for 2030: response to Wild et al.. Diabetes Care. 2004;27(10):2568–2569. doi:10.2337/diacare.27.10.2568
2. Wang L, Gao P, Zhang M, et al. Prevalence and Ethnic Pattern of Diabetes and Prediabetes in China in 2013. JAMA. 2017;317(24):2515–2523. doi:10.1001/jama.2017.7596
3. Whiting DR, Guariguata L, Weil C, et al. IDF diabetes atlas: global estimates of the prevalence of diabetes for 2011 and 2030. Diabetes Res Clin Pract. 2011;94(3):311–321. doi:10.1016/j.diabres.2011.10.029
4. Go AS, Chertow GM, Fan D, et al. Chronic kidney disease and the risks of death, cardiovascular events, and hospitalization. N Engl J Med. 2004;351(13):1296–1305. doi:10.1056/NEJMoa041031
5. Cheung N, Mitchell P, Wong TY. Diabetic retinopathy. Lancet. 2010;376(9735):124–136. doi:10.1016/S0140-6736(09)62124-3
6. Yau JW, Rogers SL, Kawasaki R, et al. Global prevalence and major risk factors of diabetic retinopathy. Diabetes Care. 2012;35(3):556–564. doi:10.2337/dc11-1909
7. Gabir MM, Hanson RL, Dabelea D, et al. Plasma glucose and prediction of microvascular disease and mortality: evaluation of 1997 American Diabetes Association and 1999 World Health Organization criteria for diagnosis of diabetes. Diabetes Care. 2000;23(8):1113–1118. doi:10.2337/diacare.23.8.1113
8. Liu Y, Yang J, Tao L, et al. Risk factors of diabetic retinopathy and sight-threatening diabetic retinopathy: a cross-sectional study of 13 473 patients with type 2 diabetes mellitus in mainland China. BMJ Open. 2017;7(9):e016280. doi:10.1136/bmjopen-2017-016280
9. Patel YR, Kirkman MS, Considine RV, et al. Retinopathy predicts progression of fasting plasma glucose: an Early Diabetes Intervention Program (EDIP) analysis. J Diabetes Complications. 2017;31(3):605–610. doi:10.1016/j.jdiacomp.2016.11.005
10. Shiraiwa T, Kaneto H, Miyatsuka T, et al. Postprandial hyperglycemia is a better predictor of the progression of diabetic retinopathy than HbA1c in Japanese type 2 diabetic patients. Diabetes Care. 2005;28(11):2806–2807. doi:10.2337/diacare.28.11.2806
11. Hsieh M-H, Yang J-F, Lin W-Y, et al. Fasting sugar, blood pressure, and uric acid are factors related to positive proteinuria and an impaired eGFR. J Chin Med Assoc. 2017;80(12):782–789. doi:10.1016/j.jcma.2016.11.011
12. Shichiri M, Kishikawa H, Ohkubo Y, et al. Long-term results of the Kumamoto Study on optimal diabetes control in type 2 diabetic patients. Diabetes Care. 2000;23(Suppl 2):B21–29.
13. Vieira MB, Neves JS, Leitão L, et al. Impaired Fasting Glucose and Chronic Kidney Disease, Albuminuria, or Worsening Kidney Function: A Secondary Analysis of SPRINT. J Clin Endocrinol Metab. 2019;104(9):4024–4032. doi:10.1210/jc.2019-00073
14. McCane DR, Hanson RL, Charles MA, et al. Comparison of tests for glycated haemoglobin and fasting and two hour plasma glucose concentrations as diagnostic methods for diabetes. BMJ. 1994;308(6940):1323–1328. doi:10.1136/bmj.308.6940.1323
15. Liu G, Dou J, Pan Y, et al. Comparison of the Effect of Glycemic Control in Type 2 Diabetes Outpatients Treated With Premixed and Basal Insulin Monotherapy in China. Front Endocrinol (Lausanne). 2018;9:639. doi:10.3389/fendo.2018.00639
16. Alberti KG, Zimmet PZ. Definition, diagnosis and classification of diabetes mellitus and its complications. Part 1: diagnosis and classification of diabetes mellitus. Provisional report of a WHO Consultation. Diabetic Med. 1998;15(7):539–553. doi:10.1002/(SICI)1096-9136(199807)15:7<539::AID-DIA668>3.0.CO;2-S
17. Hayward RA, Reaven PD, Wiitala WL, et al. Follow-up of glycemic control and cardiovascular outcomes in type 2 diabetes. N Engl J Med. 2015;372(23):2197–2206. doi:10.1056/NEJMoa1414266
18. Holman RR, Paul SK, Bethel MA, et al. 10-year follow-up of intensive glucose control in type 2 diabetes. N Engl J Med. 2008;359(15):1577–1589. doi:10.1056/NEJMoa0806470
19. Patel A, MacMahon S, Chalmers J, et al. Intensive blood glucose control and vascular outcomes in patients with type 2 diabetes. N Engl J Med. 2008;358(24):2560–2572.
20. Monnier L, Lapinski H, Colette C. Contributions of Fasting and Postprandial Plasma Glucose Increments to the Overall Diurnal Hyperglycemia of Type 2 Diabetic Patients: variations with increasing levels of HbA1c. Diabetes Care. 2003;26(3):881–885. doi:10.2337/diacare.26.3.881
21. UK Prospective Diabetes Study (UKPDS) Group. Intensive blood-glucose control with sulphonylureas or insulin compared with conventional treatment and risk of complications in patients with type 2 diabetes (UKPDS 33). Lancet. 1998;352(9131):837–853. doi:10.1016/S0140-6736(98)07019-6
22. Yang W, Lu J, Weng J, et al. Prevalence of diabetes among men and women in China. N Engl J Med. 2010;362(12):1090–1101. doi:10.1056/NEJMoa0908292
23. Ketema EB, Kibret KT. Correlation of fasting and postprandial plasma glucose with HbA1c in assessing glycemic control; systematic review and meta-analysis. Arch Public Health. 2015;73(1):43. doi:10.1186/s13690-015-0088-6
24. Skott P, Vaag A, Hother-Nielsen O, et al. Effects of hyperglycaemia on kidney function, atrial natriuretic factor and plasma renin in patients with insulin-dependent diabetes mellitus. Scand J Clin Lab Invest. 1991;51(8):715–727.
25. Steffes MW, Bilous RW, Sutherland DE, et al. Cell and matrix components of the glomerular mesangium in type I diabetes. Diabetes. 1992;41(6):679–684. doi:10.2337/diab.41.6.679
26. Rassam SM, Patel V, Kohner EM. The effect of experimental hypertension on retinal vascular autoregulation in humans: a mechanism for the progression of diabetic retinopathy. Exp Physiol. 1995;80(1):53–68. doi:10.1113/expphysiol.1995.sp003834
27. Kohner EM, Patel V, Rassam SM. Role of blood flow and impaired autoregulation in the pathogenesis of diabetic retinopathy. Diabetes. 1995;44(6):603–607. doi:10.2337/diab.44.6.603
 © 2020 The Author(s). This work is published and licensed by Dove Medical Press Limited. The
full terms of this license are available at https://www.dovepress.com/terms
and incorporate the Creative Commons Attribution
- Non Commercial (unported, 3.0) License.
By accessing the work you hereby accept the Terms. Non-commercial uses of the work are permitted
without any further permission from Dove Medical Press Limited, provided the work is properly
attributed. For permission for commercial use of this work, please see paragraphs 4.2 and 5 of our Terms.
© 2020 The Author(s). This work is published and licensed by Dove Medical Press Limited. The
full terms of this license are available at https://www.dovepress.com/terms
and incorporate the Creative Commons Attribution
- Non Commercial (unported, 3.0) License.
By accessing the work you hereby accept the Terms. Non-commercial uses of the work are permitted
without any further permission from Dove Medical Press Limited, provided the work is properly
attributed. For permission for commercial use of this work, please see paragraphs 4.2 and 5 of our Terms.