")
Back to Journals » Clinical Interventions in Aging » Volume 13
Association between a frailty index based on common laboratory tests and QTc prolongation in older adults: the Rugao Longevity and Ageing Study
Authors Ma T, Cai J , Zhu Y, Chu X, Wang Y, Shi G, Wang Z, Yao S, Wang X, Jiang XY
Received 23 August 2017
Accepted for publication 19 February 2018
Published 27 April 2018 Volume 2018:13 Pages 797—804
DOI https://doi.org/10.2147/CIA.S149791
Checked for plagiarism Yes
Review by Single anonymous peer review
Peer reviewer comments 3
Editor who approved publication: Dr Zhi-Ying Wu
Teng Ma,1–3,* Jian Cai,4,* Yin-Sheng Zhu,5 Xue-Feng Chu,5 Yong Wang,5 Guo-Ping Shi,5 Zheng-Dong Wang,5 Shun Yao,1–3 Xiao-Feng Wang,1–3 Xiao-Yan Jiang6–8
1Unit of Epidemiology, Ministry of Education Key Laboratory of Contemporary Anthropology, Fudan University, Shanghai, People’s Republic of China; 2State Key Laboratory of Genetic Engineering, School of Life Sciences, Fudan University, Shanghai, People’s Republic of China; 3National Clinical Research Center for Aging and Medicine (Huashan), Huashan Hospital, Fudan University, Shanghai, People’s Republic of China; 4Department of Neurology, Renji Hospital, Shanghai Jiao Tong University School of Medicine, Shanghai, People’s Republic of China; 5Rugao People’s Hospital, Rugao, Jiangsu, People’s Republic of China; 6Key Laboratory of Arrhythmias of the Ministry of Education of China, Tongji University School of Medicine, Shanghai, People’s Republic of China; 7Department of Pathology and Pathophysiology, Tongji University School of Medicine, Shanghai, People’s Republic of China; 8Institute of Medical Genetics, Tongji University, Shanghai, People’s Republic of China
*These authors contributed equally to this work
Background: Risk factors for heart rate-corrected QT interval (QTc) proglongation should be explored to stratify high-risk individuals to aid the prevention of incident cardiovascular events and mortality. The diversity of risk factors for QTc prolongation suggests that use of the frailty index (FI), indicating general health deficits, may be an effective approach, especially in the elderly, to identify the risk of QTc prolongation.
Methods: We used the data of 1,780 individuals aged 70–87 years from the Rugao Longevity and Ageing Study (RuLAS), a community-based longitudinal study. The FI was constructed using 20 routine laboratory tests, plus the body mass index and measures of systolic and diastolic blood pressures (FI-Lab).
Results: The mean FI-Lab value was 0.24±0.09. The mean heart rate-corrected QT interval (QTc) was 407±38 ms. The prevalence of QTc prolongation was 5.2% in elderly community populations aged 70–87 years. A higher FI-Lab value was associated with a higher risk for QTc prolongation. Each 10% increase in the FI-Lab value increased the odds ratio (OR) by 33% (OR: 1.33; 95% CI: 1.07–1.64). Compared with the lowest quartile, the top quartile FI-Lab score was associated with a 2.50-fold QTc prolongation risk in elderly individuals (95% CI: 1.21–5.19).
Conclusion: An FI based on routine laboratory data can identify older adults at increased risk for QTc prolongation. The FI approach may therefore be useful for the risk stratification of QTc prolongation.
Keywords: QTc prolongation, frailty, frailty index, Chinese elderly
Introduction
Large population data from the US National Health and Nutrition Examination Survey (NHANES) II and III studies reported that heart rate-corrected QT interval (QTc) variance on an electrocardiogram (ECG) increases with age, and specifically, prolonged QTc is more prevalent in older individuals.1 In addition, the prolonged QTc is associated with an increased risk of incident cardiovascular event2,3 or cardiovascular death4–6 in populations of older adults. Approximately 28% of patients admitted to cardiac care units may present with QTc prolongation.7 Thus, it is important to identify risk factors and pay special attention to high-risk patients to prevent serious cardiovascular events for individuals with QT prolongation. A number of risk factors for QT prolongation have been recognized, such as hypokalemia, age ≥65 years, thyroid disturbances, hypertension, liver failure, QT prolongation drugs, and so on.8,9 The diversity of risk factors in highly prevalent QT prolongation suggests that this condition is most likely observed in people with a broadly constituted decline in health, especially in older adults. In addition, traditional cardiovascular disease risk markers gradually lose their predictive value with age.10,11 In addition, recent data suggest that frailty-related phenotypes are associated with QTc prolongation. Michishita et al12 reported that inactivity and light-intensity physical activity were associated with QTc in older adults.
Since most traditional risk factors of QT prolongation moderately discriminate individual people at risk,8 there is merit in modeling QT prolongation risk using an integrative approach, especially among older people, and a more comprehensive view of health should be considered. The frailty approach operationalizes frailty based on a range of accumulated general health deficits in an index, to consider how health outcomes may be altered by the combination of a large number of small effects, instead of using the traditional risk factors of an illness. Previous studies have shown that the statistical properties of the frailty index (FI), such as age distribution and its effect on other outcomes, are largely insensitive to differences in study designs and the precise items that constitute the FI.13,14 An FI of deficits unrelated to dementia, as well as traditional risk factors, was shown as a risk factor for dementia and coronary heart disease (CHD).15
Therefore, we hypothesized that laboratory test abnormalities, which fit into a FI, broadly constituted a decline in health-contained subclinical deficits and were associated with ECG abnormalities in older adults. This model of the FI, recently constructed using routine laboratory tests, plus the body mass index (BMI) and measures of systolic and diastolic blood pressures (FI-Lab),16 identified older adults at increased risk of death,16–19 doctor visits, medication use, and self-reported health18 in a community population, an institution, and patients hospitalized in geriatric wards.20,21 The laboratory deficits of the FI, which precede clinically evident health deficits, reflect a range of general subclinical deficits that originate at the molecular or cellular level and eventually scale up to visible macroscopic organ dysfunction.
Methods
Study design and participants
We used data from the aging arm of the Rugao Longevity and Ageing Study (RuLAS), a population-based observational two-arm cohort study conducted in Rugao, Jiangsu Province, China. As previously described,22 1,788 elderly adults aged 70–84 years were recruited at baseline (2014.11–2014.12) from 31 communities of Jiang’an Township, Rugao City, according to 5-year age and gender strata. From April 2016 through June 2016, the second-wave examination of the aging arm was conducted, excluding 297 subjects (55 died and 242 did not come in or were hospitalized for other diseases) and including an additional 333 subjects recruited for cohort attrition, with 1,824 participants forming the second-wave cohort. Among these individuals, 1,780 subjects aged 70–87 years with data on ECG parameters and laboratory data were included in the present study.
Ethical approval
The Human Ethics Committee of the School of Life Sciences, Fudan University, Shanghai, People’s Republic of China, approved the present study. Written informed consent was obtained from all participants prior to the study.
Construction of the FI
The factors included in the FI were based on the following previous criteria:18,23,24 1) must increase with age; 2) must be health related; 3) must be present in at least 1% of the study population; and 4) must not be present in 80% of the study population prior to the age of 80.
We constructed an FI-Lab panel using 23 variables based on 20 routine laboratory blood tests plus BMI, as well as the systolic and diastolic blood pressures. As reported in previous studies,16–18 all variables were coded according to normal reference intervals, and the code “zero” indicates that the values are within the normal range, while “one” indicates any values outside of the normal reference range (Table S1). The FI-Lab score was calculated only if >80% of the variables were available for each subject. For each subject, the FI-Lab score was calculated as the number of deficits divided by the total number of tests. The FI-Lab score is a continuous variable, and for presentation purposes, the FI-Lab scores were empirically presented as four quartile grades: Q1: ≤0.174; Q2: 0.175–0.217; Q3: 0.218–0.304; and Q4: ≥0.305.
Outcomes
Resting ECGs were recorded with a standard 12-lead MECG-200 electrocardiograph (MedEx, Beijing, China) at a paper speed of 25 mm/s after standardization (10 mm =1 mV) with filter settings. All individuals were initially requested to have 5–10 minutes of rest before and after examination by a physician. We collected the ECG parameters, including heart rate, PR intervals (the time elapsing between the beginning of the P wave and the beginning of the next QRS complex), QRS duration (a series of waveforms on an electrocardiogram that represents depolarization of ventricular muscle cells), S wave in V1 (SV1), R wave in V5 (RV5), and QTc, via the interpretation programs of the ECG machine. All ECG parameters and abnormalities were identified by another cardiac physician. To adjust for heart rate, the Bazett formula (QTc = QT/vRR) was used in the present study.25 An abnormal QTc prolongation was defined as a QTc >450 ms in males and a QTc >470 ms in females.4
Covariates
The following sociodemographic and lifestyle characteristics were included in the present study: age (70–74 years, 75–79 years, 80–84 years, and 85–87 years), gender (male and female), smoking habits (never smoked, current smoker, or former smoker), drinking habits (never drank, current drinker, or former drinker), occupation (farmers and others), marital status (currently married, other [never married, divorced, separated, or widowed]), and literacy (illiterate, literate (≥1 year of education)). The BMI was calculated by dividing the weight (in kilograms) by the square of the body height (in square meters). Depression symptoms were measured by the Chinese version of the 15-item Geriatric Depression Scale (GDS-15), consisting of 15 “yes” or “no” questions.26–28 The Hasegawa Dementia Scale-Revised (HDS-R) includes 11 items that are used to measure orientation, memory, attention/calculation, and verbal fluency and is a widely used, brief, and reliable measurement for evaluating global cognitive function.29 Self-rated health was assessed by asking the participants the following question: “In general, compared with other people of the same age, would you say that your health is excellent, very good, good, fair, or poor?” HDS-R was used as a categorical variable, distinguishing between good (excellent, very good, or good, as the reference group) and poor (fair or poor).
Statistical analysis
The data were presented as either the mean values ± SD or the percentages, with comparisons between groups made using the independent t-test or the Mann–Whitney U-test (for the former) and the chi-square test (for the latter), if appropriate. Logistic regressions were used to examine the relationships between FI-Lab results and QTc prolongation. Crude ORs were calculated in Model 1. Model 2 contained demographic variables, eg, age, gender, occupation, marital status, education, smoking status, and drinking status, added to Model 1. Model 3 included HDS-R score, GDS-15 score, and self-rated health status and medication use (drug use for at least 1 month from the baseline investigation) to Model 2. Statistical analyses were performed using SPSS statistical software 19.0 (IBM Corporation, Armonk, NY, USA), and in all statistical analyses, a two-sided p<0.05 was considered significant.
Results
The studied 1,780 participants (mean age: 77.1±4.0 years) included 839 men. The mean FI-Lab value was 0.24±0.09. The mean values ± SD of the QTc was 407±39 ms. The prevalence of abnormal QTc prolongation was 5.3% in old community populations aged 70–87 years (Table 1).
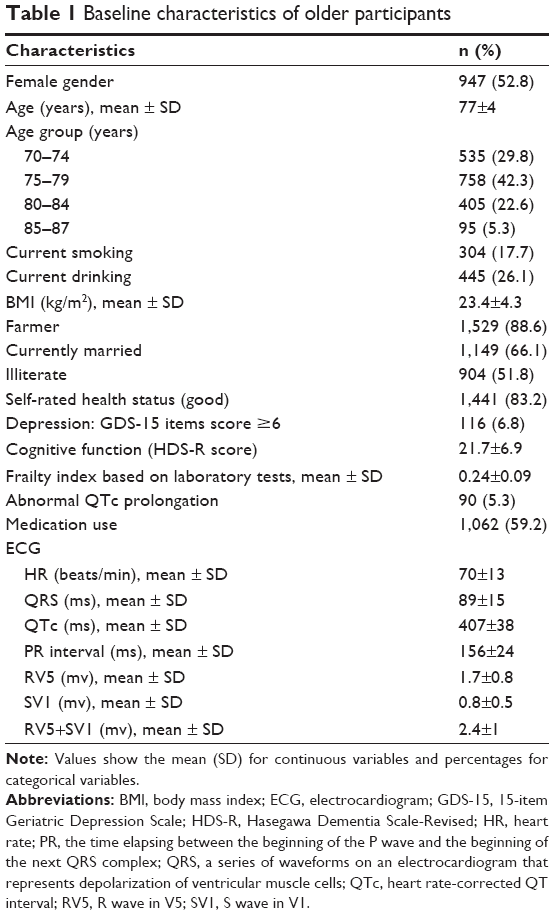 | Table 1 Baseline characteristics of older participants |
There were no significant differences in gender, age group, and occupation among the four quartile groups of FI-Lab. The QTc and SV1 were significantly shorter, and the heart rate was higher in the order of Q4> Q3> Q2> Q1 of FI-Lab, p<0.05 (Table 2). In the general linear regression analysis, FI-Lab was associated with QTc (crude model, β=3.1, p=0.001, Table 3). After adjustment for age groups, gender, occupation, marital status, education, smoking status, drinking status, depression status, HDS-R scores, self-rated health status, and medication history, the significance remained. In addition, higher FI-Lab value was associated with an increase in heart rate and SVI (β=2.57, 95% CI: 1.92–3.22; β=0.04, 95% CI: 0.01–0.06), respectively.
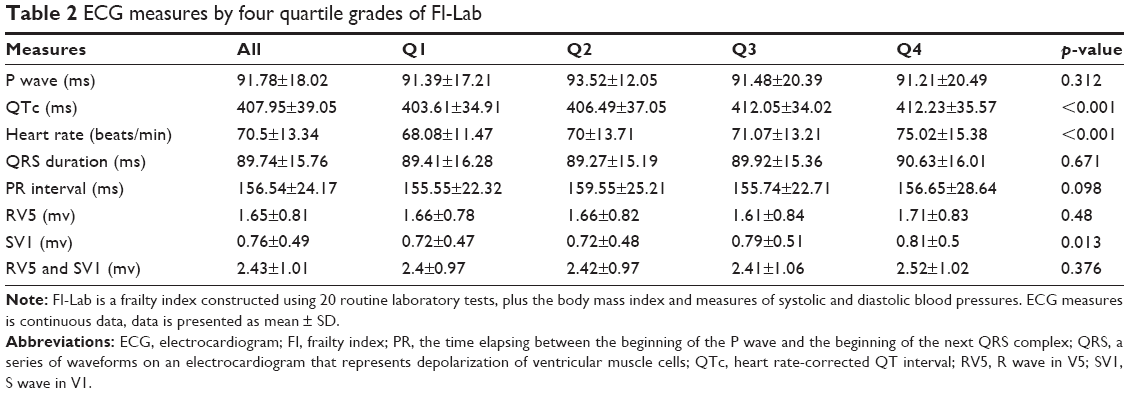 | Table 2 ECG measures by four quartile grades of FI-Lab |
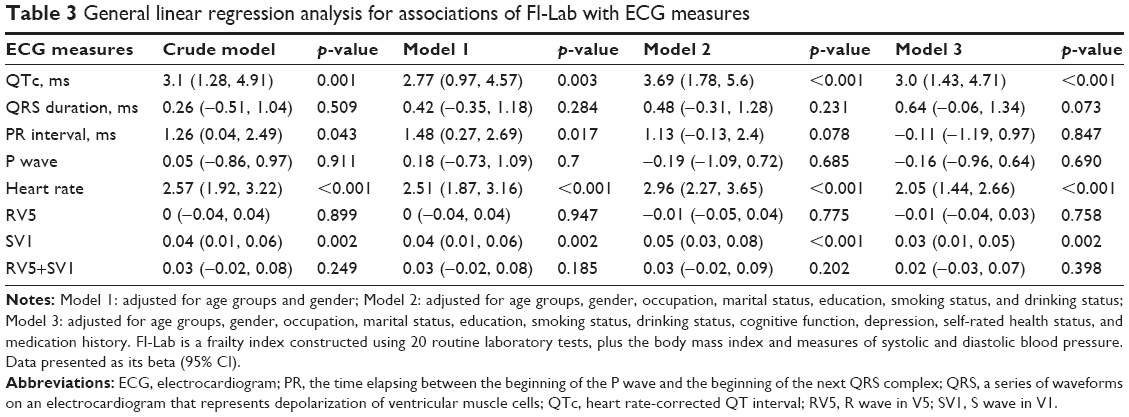 | Table 3 General linear regression analysis for associations of FI-Lab with ECG measures |
Although heart rate was significantly associated with FI-Lab, this factor was used as an adjusted variate for the QTc phenotype. In addition, the sole association of SV1 with FI-Lab, instead of RV5 and SV1+RV5 simultaneously, did not suggest that the ECG measured left ventricular hypertrophy associated with FI-Lab. Therefore, we did not conduct further analysis for heart rate and SV1. A higher value for FI-Lab was associated with a higher risk of abnormal QTc prolongation. Each 10% increase in the FI-Lab value increased the OR of abnormal QTc prolongation by 33% (95% CI: 1.07–1.64) (Table 4). A significant increase in the risk of abnormal QTc prolongation of Q4 was observed compared with Q1 (OR: 1.91; 95% CI: 1.02–3.55), and the association remained in the fully adjusted model (OR: 2.5; 95% CI: 1.21–5.19). In addition, we categorized the QTc into three groups: normal men ≤430 ms and women ≤450 ms; borderline men 431–450 ms and women 451–470 ms; and abnormal men ≥451 ms and women ≥471 ms. We also observed statistically significant associations of FI-Lab with the risk of abnormal QTc prolongation compared with those of the normal group (data not shown). Significant associations between FI-Lab and abnormal QRS duration and PR interval were not observed in the present study.
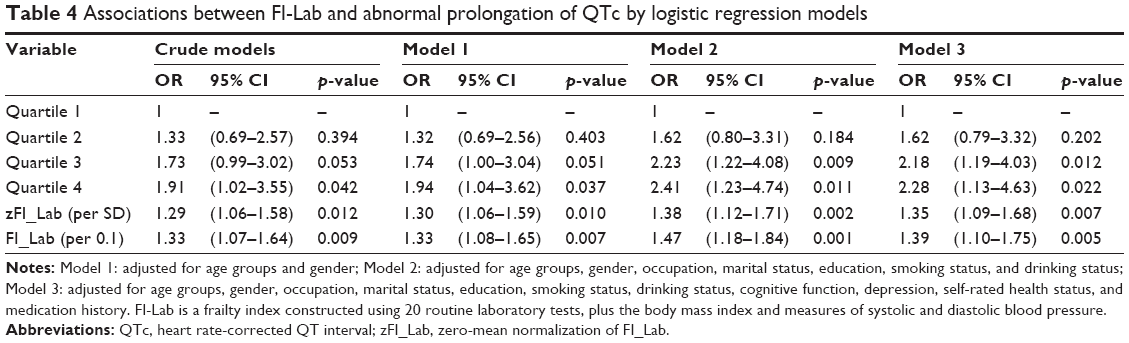 | Table 4 Associations between FI-Lab and abnormal prolongation of QTc by logistic regression models |
Discussion
In the present study, we provided the first evidence that a FI-quantified general health status is associated with the QTc and risk of QTc prolongation. With an increasing FI level, the length of the QTc increases. With an increasing FI degree, the odds of QTc prolongation occurrence increased. The present study highlights an independent effect of frailty in the risk stratification of QTc prolongation in the general elderly population. These associations should be validated in prospective studies.
The data for the associations between frailty and ECG indicators are scarce. Recently, among an observational hospital-based cohort of 41 chronic dialysis patients of advanced age (68.4±10.8 years), Chao and Huang30 found that among chronic hemodialysis patients, severity of frailty, as assessed by the Edmonton Frailty Scale, is inversely associated with the QRS duration. Individuals with QRS >120 ms had significantly lower severity of frailty than those with QRS <120 ms. These authors proposed that end-stage renal disease patients with more severe frailty exhibit higher levels of fluid accumulation than those with less severe frailty, leading to a shorter QRS duration on their ECGs.30 In 586 elderly volunteers recruited from a community dwelling, Michishita et al12 found that decreased physical activity level, especially inactivity and light-intensity physical activity, were associated with prolonged QTc. The authors assumed that the association between reduction in physical activity and a prolonged QTc might be caused by cardiac autonomic nervous system dysfunction and/or electrolyte imbalance, although the outcome of the present study is the intensity of physical activity instead of frailty, and frail patients in the present study may correspond to greater degree of inactivity, which is related to prolonged QTc.
In 2015, Song et al,31 in the Canadian Study of Health Aging, constructed an FI consisting of 19 deficits, proposing that a decline in general health status in features that are not known as traditional cognitive risk factors (eg, eye trouble or ear trouble) predicts the incidence of dementia. In the field of cardiovascular disease, a similar approach was also explored in the elderly population. Wallace et al15 developed a nontraditional risk score, including 17 nontraditional risk factors (eg, sinusitis and arthritis), and found that this score was independently associated with incident CHD events. In addition, an FI constructed using this nontraditional risk score and nine traditional risk factors (eg, hypertension, diabetes) was associated with incident CHD.15
In addition to a diverse range of deficits that result in the functional decline of multiple physiological systems, the association of FI-Lab with QTc prolongation might reflect the coexistence of frailty and prolonged QTc, which may be a reflection of common pathological pathways that link frailty with cardiovascular damages. 1) The aging process is different for different people. Beyond normal aging, different people accumulate different categories and degrees of deficits with different adverse outcomes due to different genetic and environmental stresses. At the preclinical/microscopic level, the pathobiology of the wasting and weakness process has been correlated with dysregulated immune, endocrine, and neurohormonal systems,32,33 as manifested by increased levels of inflammatory cytokines (eg, interleukin [IL]-6 and C-reactive protein [CRP]). These inflammatory cytokines may affect cellular senescence and body composition to promote frailty, in addition to exerting malignant effects on the arterial wall to promote atherosclerosis and damage to the myocardium and cardiac autonomic system function to promote QTc prolongation.12,34 In addition, elevated levels of inflammatory cytokines lead to a decline in muscle mass and strength through promotion of catabolic processes, which may indirectly mediate the association between frailty and myocardial damage.15,35 2) FI-Lab not only reflects a general amount of deficits that impair physiological reserves but also reflects shared mechanisms that cross a clinical threshold of one system (eg, CHD outcome), which may indicate subclinical disease in another system.36 Accumulated deficits, measured by FI-Lab, may cross the threshold of the cardiovascular system, in general, but may be clinically and specifically manifested as QTc prolongation in some elderly individuals. Recently, Parks et al37 developed an FI (including 31 variables that reflect different aspects of health, such as metabolic status and body composition) for murine models in which age-associated changes in myocytes (myocyte hypertrophy and peak contractions) are more prominent in animals with a high FI value.37 3) The diversity of traditional risk factors of QTc prolongation suggests that a broadly constituted marker representing general health decline, especially in elderly individuals, is informative. FI-Lab satisfies this scenario. FI-Lab, from another perspective, may reflect the overall effects of traditional risk factors for QTc prolongation in elderly individuals.
Conclusion
The observations of the present study suggest a general health assessment, as indicated by FI-Lab, providing risk stratification information to subjects with QTc prolongation. Constructing an FI from laboratory data commonly collected in routine clinical practice is an easy and convenient way to complete this analysis. Additionally, the FI does not generate extra burden for patients and physicians. Although the cross-sectional nature of the present data prohibits causal inference, frailty may more likely be a predisposition to QTc prolongation mediated by mechanisms such as inflammation. Since this report is the first to link FI-Lab to QTc prolongation, this association should be validated in prospective studies.
Acknowledgments
The authors thank Xuehui Sun for his critical review of the manuscript and insightful suggestions for the study design. We acknowledge all participants involved in the present study. This work was financially supported by grants from the National Natural Science Foundation (81670465 and 81571372) and the Shanghai Municipal Natural Science Foundation (16ZR1439600).
Disclosure
The authors report no conflicts of interest in this work.
References
Rabkin SW, Cheng XJ, Thompson DJ. Detailed analysis of the impact of age on the QT interval. J Geriat Cardiol. 2016;13:740–748. | ||
Schouten EG, Dekker JM, Meppelink P, Kok FJ, Vandenbroucke JP, Pool J. QT interval prolongation predicts cardiovascular mortality in an apparently healthy population. Circulation. 1991;84:1516–1523. | ||
de Bruyne MC, Hoes AW, Kors JA, Hofman A, van Bemmel JH, Grobbee DE. Prolonged QT interval predicts cardiac and all-cause mortality in the elderly. The Rotterdam study. Eur Heart Journal. 1999;20:278–284. | ||
Straus SMJM, Kors JA, De Bruin ML, et al. Prolonged QTc interval and risk of sudden cardiac death in a population of older adults. J Am College Cardiol. 2006;47:362–367. | ||
Dekker JM, Schouten EG, Klootwijk P, Pool J, Kromhout D. Association between QT interval and coronary heart disease in middle-aged and elderly men. The Zutphen study. Circulation. 1994;90:779–785. | ||
Moss AJ. QTc prolongation and sudden cardiac death. J Am Coll Cardiol. 2006;47:368–369. | ||
Tisdale JE, Wroblewski HA, Overholser BR, Kingery JR, Trujillo TN, Kovacs RJ. Prevalence of QT interval prolongation in patients admitted to cardiac care units and frequency of subsequent administration of QT interval-prolonging drugs: a prospective, observational study in a large urban academic medical center in the US. Drug Saf. 2012;35:459–470. | ||
Vandael E, Vandenberk B, Vandenberghe J, et al. Risk factors for QTc-prolongation: systematic review of the evidence. Int J Clin Pharm. 2017;39:16–25. | ||
Kallergis EM, Goudis CA, Simantirakis EN, Kochiadakis GE, Vardas PE. Mechanisms, risk factors, and management of acquired long QT syndrome: a comprehensive review. Sci World J. 2012;2012:212178. | ||
van Peet PG, Drewes YM, de Craen AJ, Westendorp RG, Gussekloo J, de Ruijter W. Prognostic value of cardiovascular disease status: the Leiden 85-plus study. Age. 2013;35:1433–1444. | ||
de Ruijter W, Westendorp RG, Assendelft WJ, et al. Use of Framingham risk score and new biomarkers to predict cardiovascular mortality in older people: population based observational cohort study. BMJ. 2009;338:a3083. | ||
Michishita R, Fukae C, Mihara R, et al. Association between the physical activity and heart rate corrected-QT interval in older adults. Geriatr Gerontol Int. 2015;15:895–901. | ||
Rockwood K, Mitnitski A. Frailty defined by deficit accumulation and geriatric medicine defined by frailty. Clin Geriatr Med. 2011;27:17–26. | ||
Yang Y, Lee LC. Dynamics and heterogeneity in the process of human frailty and aging: evidence from the U.S. older adult population. J Gerontol B Psychol Sci Soc Sci. 2010;65B:246–255. | ||
Wallace LM, Theou O, Kirkland SA, et al. Accumulation of non-traditional risk factors for coronary heart disease is associated with incident coronary heart disease hospitalization and death. PLoS One. 2014;9:e90475. | ||
Howlett SE, Rockwood MR, Mitnitski A, Rockwood K. Standard laboratory tests to identify older adults at increased risk of death. BMC Med. 2014;12:171. | ||
Rockwood K, McMillan M, Mitnitski A, Howlett SE. A frailty index based on common laboratory tests in comparison with a clinical frailty index for older adults in long-term care facilities. J Am Med Dir Assoc. 2015;16:842–847. | ||
Blodgett JM, Theou O, Howlett SE, Wu FC, Rockwood K. A frailty index based on laboratory deficits in community-dwelling men predicted their risk of adverse health outcomes. Age Ageing. 2016;45:463–468. | ||
Klausen HH, Petersen J, Bandholm T, et al. Association between routine laboratory tests and long-term mortality among acutely admitted older medical patients: a cohort study. BMC Geriatr. 2017;17:62. | ||
Fried LP, Tangen CM, Walston J, et al. Frailty in older adults: evidence for a phenotype. J Gerontol A Biol Sci Med Sci. 2001;56:M146–M156. | ||
Ritt M, Jäger J, Ritt JI, Sieber CC, Gaßmann KG. Operationalizing a frailty index using routine blood and urine tests. Clin Interv Aging. 2017;12:1029–1040. | ||
Liu Z, Wang Y, Zhang Y, et al. Cohort profile: the Rugao Longevity and Ageing Study (RuLAS). Int J Epidemiol. 2015;45:1064–1073. | ||
Searle SD, Mitnitski A, Gahbauer EA, Gill TM, Rockwood K. A standard procedure for creating a frailty index. BMC Geriatr. 2008;8:24. | ||
Rockwood K, Blodgett JM, Theou O, et al. A frailty index based on deficit accumulation quantifies mortality risk in humans and in mice. Sci Rep. 2017;7:43068. | ||
Bazett HC. An analysis of the time-relations of electrocardiograms. Ann Noninvasive Electrocardiol. 1997;2:177–194. | ||
Zhi T, Sun X, Li S, et al. Associations of sleep duration and sleep quality with life satisfaction in elderly Chinese: the mediating role of depression. Arch Gerontol Geriatr. 2016;65:211–217. | ||
Dennis M, Kadri A, Coffey J. Depression in older people in the general hospital: a systematic review of screening instruments. Age Ageing. 2012;41:148–154. | ||
Yesavage JA. Geriatric depression scale. Psychopharmacol Bull. 1988;24:709–711. | ||
Tsukamoto R, Akisaki T, Kuranaga M, et al. Hasegawa dementia scale – revised, for screening of early Alzheimer’s disease in the elderly with type 2 diabetes. Geriatr Gerontol Int. 2009;9:213–215. | ||
Chao CT, Huang JW. Frailty severity is significantly associated with electrocardiographic QRS duration in chronic dialysis patients. PeerJ. 2015;3:e1354. | ||
Song X, Mitnitski A, Rockwood K. Nontraditional risk factors combine to predict Alzheimer disease and dementia. Neurology. 2011;77:227–234. | ||
Goldwater DS, Pinney SP. Frailty in advanced heart failure: a consequence of aging or a separate entity? Clin Med Insights Cardiol. 2015;9:39–46. | ||
Clegg A, Young J, Iliffe S, et al. Frailty in elderly people. Lancet. 2013;381:752–762. | ||
Afilalo J, Karunananthan S, Eisenberg MJ, et al. Role of frailty in patients with cardiovascular disease. Am J Cardiol. 2009;103:1616–1621. | ||
Schaap LA, Pluijm SM, Deeg DJ, et al. Higher inflammatory marker levels in older persons: associations with 5-year change in muscle mass and muscle strength. J Gerontol A Biol Sci Med Sci. 2009;64:1183–1189. | ||
Howlett SE, Rockwood K. New horizons in frailty: ageing and the deficit-scaling problem. Age Ageing. 2013;42:416–423. | ||
Parks RJ, Fares E, Macdonald JK, et al. A procedure for creating a frailty index based on deficit accumulation in aging mice. J Gerontol A Biol Sci Med Sci. 2012;67:217–227. |
Supplementary material
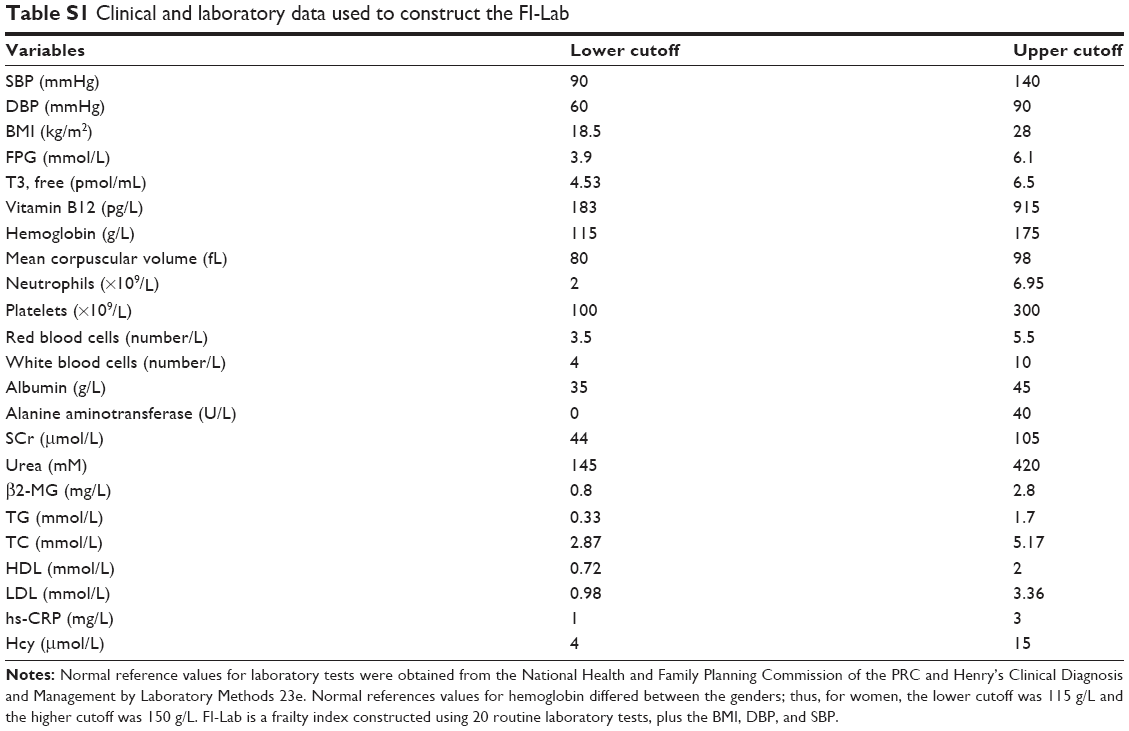 | Table S1 Clinical and laboratory data used to construct the FI-Lab |
 © 2018 The Author(s). This work is published and licensed by Dove Medical Press Limited. The full terms of this license are available at https://www.dovepress.com/terms.php and incorporate the Creative Commons Attribution - Non Commercial (unported, v3.0) License.
By accessing the work you hereby accept the Terms. Non-commercial uses of the work are permitted without any further permission from Dove Medical Press Limited, provided the work is properly attributed. For permission for commercial use of this work, please see paragraphs 4.2 and 5 of our Terms.
© 2018 The Author(s). This work is published and licensed by Dove Medical Press Limited. The full terms of this license are available at https://www.dovepress.com/terms.php and incorporate the Creative Commons Attribution - Non Commercial (unported, v3.0) License.
By accessing the work you hereby accept the Terms. Non-commercial uses of the work are permitted without any further permission from Dove Medical Press Limited, provided the work is properly attributed. For permission for commercial use of this work, please see paragraphs 4.2 and 5 of our Terms.