Back to Journals » Diabetes, Metabolic Syndrome and Obesity » Volume 16
Association Analysis of Triglyceride Glucose-Body Mass Index and Bone Turnover Markers in Patients with Type 2 Diabetes Mellitus
Authors Sun W, Xing Y, Zhou F ![]() , Ma Y, Wan X, Ma H
, Ma Y, Wan X, Ma H
Received 20 February 2023
Accepted for publication 24 April 2023
Published 18 May 2023 Volume 2023:16 Pages 1435—1447
DOI https://doi.org/10.2147/DMSO.S406849
Checked for plagiarism Yes
Review by Single anonymous peer review
Peer reviewer comments 5
Editor who approved publication: Prof. Dr. Juei-Tang Cheng
Wenwen Sun,1,2 Yuling Xing,2 Fei Zhou,2,3 Yingao Ma,2,3 Xiaozheng Wan,2,4 Huijuan Ma3,5
1Graduate School of North China University of Science and Technology, Tangshan, People’s Republic of China; 2Department of Endocrinology, Hebei General Hospital, Shijiazhuang, People’s Republic of China; 3Graduate School of Hebei Medical University, Shijiazhuang, People’s Republic of China; 4Graduate School of Hebei North University, Zhangjiakou, People’s Republic of China; 5Hebei Key Laboratory of Metabolic Diseases, Hebei General Hospital, Shijiazhuang, People’s Republic of China
Correspondence: Huijuan Ma, Department of Endocrinology, Hebei General Hospital, Shijiazhuang, People’s Republic of China, Tel +86 18032838686, Email [email protected]
Objective: In view of the high prevalence of osteoporosis in diabetic patients, this study aimed to investigate the correlation between TyG-BMI, which represents insulin resistance, and bone loss markers, which represent bone metabolism, in an attempt to provide new ideas for the early prevention and diagnosis of osteoporosis in patients with T2DM.
Patients and Methods: A total of 1148 T2DM were enrolled. The clinical data and laboratory indicators of the patients were collected. TyG-BMI was calculated based on fasting blood glucose (FBG), triglycerides (TG), and body mass index (BMI) levels. Patients were divided into Q1-Q4 groups according to TyG-BMI quartiles. According to gender, two groups were divided into men and postmenopausal women. Subgroup analysis was performed according to age, course of disease, BMI, TG level and 25(OH)D3 level. The correlation between TyG-BMI and BTMs was investigated by correlation analysis and multiple linear regression analysis using SPSS25.0 statistical software.
Results: 1. Compared with Q1 group, the proportion of OC, PINP and β-CTX in Q2, Q3 and Q4 groups decreased significantly. 2. Correlation analysis and multiple linear regression analysis showed that TYG-BMI was negatively correlated with OC, PINP and β-CTX in all patients and male patients. In postmenopausal women, TyG-BMI was negatively correlated with OC and β-CTX, but not with PINP. 3. Subgroup analysis of male patients and postmenopausal female patients according to age, course of disease, BMI, TG and 25(OH)D3 showed that TyG-BMI had a stronger negative correlation with BTMs in male patients with age < 65, disease duration < 10, BMI≥ 24, TG < 1.7, and 25(OH)D3≥ 20.
Conclusion: This study was the first to show an inverse association between TyG-BMI and BTMs in T2DM patients, suggesting that high TyG-BMI may be associated with impaired bone turnover.
Keywords: type 2 diabetes mellitus, triglyceride glucose-body mass index, bone turnover markers, inflammation
A Letter to the Editor has been published for this article.
Introduction
Type 2 diabetes mellitus (T2DM) is widespread worldwide, with more than 400 million people estimated to be affected by the disease, and the incidence is expected to continue to rise.1 In patients with diabetes, the incidence of osteoporosis and fractures is very high.2 According to statistics, more than one third of patients with T2DM in mainland China have osteoporosis, which brings huge economic and social burden to them.2 Although the risk of osteoporosis in T2DM patients is significantly higher than that in the general population, the changes of bone in T2DM are still controversial. Some studies have found that T2DM is associated with higher bone mineral density (BMD), but the risk of overall and hip fractures is still increased.3 Therefore, BMD alone cannot be used to assess the risk of osteoporosis and fracture in patients with T2DM. T2DM can destroy osteocyte function and affect bone formation, bone transformation and resorption to varying degrees.4 Studies have shown that chronic hyperglycemia leads to increased levels of advanced glycation end products (AGEs) in bone collagen, which interferes with the normal function of osteoblasts, attachment to the collagen matrix, and impairs the development of osteoblasts.5 In addition, high blood glucose levels in diabetic patients may alter bone turnover by reducing osteoclast differentiation and function, and this low turnover may explain the higher incidence of fractures in T2DM patients despite their higher bone mass.6,7 Therefore, reduced bone turnover and impaired osteoblast activity are considered to be important factors in the possible mechanism of bone mass loss in T2DM.8
It is well known that aging, obesity and insulin resistance (IR) lead to impaired skeletal regulation, resulting in imbalance in skeletal homeostasis and pathological bone.9 However, the current main method for detecting IR relies on the high insulinemic-euglycemic clamp (HIEC), which is difficult to perform in large-scale population-based physical examinations due to its economic, time, and ethical cost limitations.10 Triglyceride glucose-body mass index (TyG-BMI) is a simple, valid and clinically useful alternative for early identification of IR based on a single routine fasting blood test and BMI measurement, calculated as Ln [TG (mg/dl) ×FBG (mg/dl)/2]×BMI (kg/m2).11 Numerous previous studies have evaluated its effectiveness in a variety of IR-related clinical disorders.12,13 A large number of studies have confirmed that TyG-BMI is strongly associated with prediabetes14 and diabetes,15 hypertension,13 hyperuricemia,16 non-alcoholic fatty liver disease,17 and ischemic stroke,18 while the association with osteoporosis is rarely studied and only in non-diabetic patients. As a high-risk population of osteoporosis, whether the monitoring of TyG-BMI index can be used to assess the risk of disease still needs further study.
BTMs have been recognized by The International Osteoporosis Foundation (IOF) as a promising tool for bone metabolism and quality assessment.19 Among them, procollagen type I N propeptide (PINP) is a degradation product during the formation of type I collagen secreted by osteoblasts; serum osteocalcin (OC) is released by osteoclasts during bone formation; β-C-terminal telopeptide of type I collagen (β-CTX) is a breakdown product during the degradation of mature type I collagen secreted by osteoclasts.20 OC, β-CTX, and P1NP are the markers of bone metabolism and turnover recommended by IOF because they can reflect bone turnover and bone loss in patients.19 Both osteoblasts and osteoclasts can express insulin receptors on their surfaces.21 The available data from a large number of human and animal studies confirm that insulin increases osteoblast proliferation, collagen synthesis, alkaline phosphatase production and glucose uptake, and inhibits osteoclast activity, acting as an anabolic agent in bone.22,23 However, the relationship between IR and bone turnover remains unclear.
Previous studies have confirmed that T2DM and obesity increase the inflammatory load, leading to persistent low-grade inflammation.24–27 Both chronic hyperglycemia and high levels of serum TG can promote the development of oxidative stress and ROS.28,29 Furthermore, it has been reported that IR is induced by adipocytokines through chronic low-grade inflammation.29 Increased proinflammatory cytokines can inhibit osteoblast differentiation and impair bone turnover.30,31 TyG-BMI is not only considered to be an important index that can reflect IR, but also its components TG, FBG, and BMI are closely related to the inflammatory response, so it is presumed that TyG-BMI also affects the bone conversion process. Therefore, by studying the correlation between TyG-BMI and BTMs, this paper explored whether IR could be used to assess the risk of osteoporosis in patients with T2DM.
Materials and Methods
Study Subjects and Research Design
Study Subjects
A total of 1148 adult male and postmenopausal female T2DM patients admitted to the Hebei Provincial People’s Hospital from January 2020 to December 2020 were selected. Ethical approval was obtained from the Hebei Provincial People’s Hospital, and all patients signed an informed consent form before enrollment in this study.This study was conducted in accordance with the Declaration of Helsinki.
Inclusion and Exclusion Criteria
Inclusion criteria: 1) age ≥18 years old; 2) all patients met the diagnostic criteria for T2DM: diabetic symptoms plus arbitrary blood glucose ≥11.1mmol/L, fasting blood glucose ≥7.0mmol/L, or oral glucose tolerance test (OGTT test) 2-hour blood glucose ≥11.1mmol/L.
Exclusion criteria: 1) T1DM or other specific types of diabetes mellitus; 2) patients with a history of myocardial infarction, cerebral hemorrhage, severe hepatic or renal insufficiency, acute infection, and stress within the past 3 months; 3) pregnant and lactating women; 4) patients with malignancies or mental illnesses that limit their ability to comply with study requirements; 5) history of fracture within 1 year; 6) application of drugs affecting bone metabolism such as osteopontin, calcitriol, calcitonin, bisphosphonates, estrogen or estrogen receptor modulators, nuclear factor-κB receptor activator ligand (RANKL) inhibitors, anabolic drugs (eg teriparatide, abaloparatide, and romosumab), etc.
Research Methods
Data Collection
Basic information such as name, gender, age, past history, duration of diabetes, smoking history, drinking history, and body mass index (BMI) were recorded. Fasting venous blood was collected the next morning after admission. The automated biochemical analyzer was used to detect calcium (Ca), phosphorus (P), magnesium (Mg), uric acid (UA), glomerular filtration rate (GFR), triglyceride (TG), fasting blood glucose (FBG), high-density lipoprotein cholesterol (HDL-C), low-density lipoprotein cholesterol (LDL-C), lipoprotein A(LPA), alkaline phosphatase (ALP); glycate hemoglobin (HbA1c), 25-hydroxyvitamin D3 (25(OH)D3), parathyroid hormone (PTH), OC, β-CTX and PINP were detected by electrochemiluminescence. TyG-BMI was calculated by Ln [TG (mg/dl) ×FBG (mg/dl)/2]×BMI. To ensure the accuracy of data extraction, data were entered into a spreadsheet by one researcher and cross-checked by another independent researcher.
Statistical Analysis
SPSS25.0 statistical software was used for analysis. Normality and homogeneity of variance were tested for continuous data. We tested the distribution normality using the Kolmogorov–Smirnov test. Normally distributed data were expressed as mean ± standard deviation, and comparison between groups was analyzed by one-way analysis of variance. Non-normally distributed data were presented as median (interquartile range) and nonparametric tests were performed. Count data were expressed as numbers (percentages), and chi-square test was used for comparison between groups. Spearman or Pearson correlation analysis was used to analyze the correlation between BTMs and clinical indicators. Multiple linear regression analysis was used to investigate whether TyG-BMI was a risk factor for BTMs. Subgroup analyses of clinically relevant subgroups of study subjects were performed to further test the robustness of the results. P < 0.05 was considered statistically significant by two-tailed test.
Results
Comparison of the Indicators Between the Male Group and the Postmenopausal Female Group
Compared with postmenopausal women, the male group had a younger age [56.00(46.00, 64.00) vs 64.00(57.00, 71.00) years] and a shorter disease duration [8.00 (2.00, 15.00) vs 10.00 (5.00, 18.00) years]. Smokers [320(44%) vs 8(1.9%)] and drinkers [261(36%) vs 6(1.4%)] accounted for a greater proportion. BMI [26.14(23.95, 28.39) vs 25.78(23.42, 27.97) kg/m2], UA [314.30(250.85, 379.30) vs 269.00(216.96, 329.10) umol/L], GFR [97.23(72.11, 106.81) vs 85.68(66.21, 95.88)], 25(OH)D3 [18.88(14.96, 23.39) vs 15.75(12.67, 20.08) ng/mL], TyG-BMI [239.09(215.48, 268.29) vs 232.39 (206.37, 258.07)] levels were higher (P<0.05). P [1.17±0.20 vs 1.23±0.18 mmol/L], HDL-C [1.03(0.87, 1.29) vs 1.22(1.04, 1.56) mmol/L], LDL-C [2.70±1.06 vs 3.03±1.90 mmol/L], ALP [75.00(60.90, 91.63) vs 81.00(62.60, 96.50) mmol/L], OC [11.94(9.71, 14.59) vs 13.85(11.03, 17.44) ng/mL], PINP [35.79(28.29, 45.56) vs 41.32(31.94, 51.78)ng/mL], β-CTX [0.35(0.25, 0.48) vs 0.40(0.28, 0.53) ng/mL] levels were lower (P<0.05), while Ca, Mg, TG, LPA, HbA1c, PTH levels were not statistically different between the two groups (P>0.05) (Table 1).
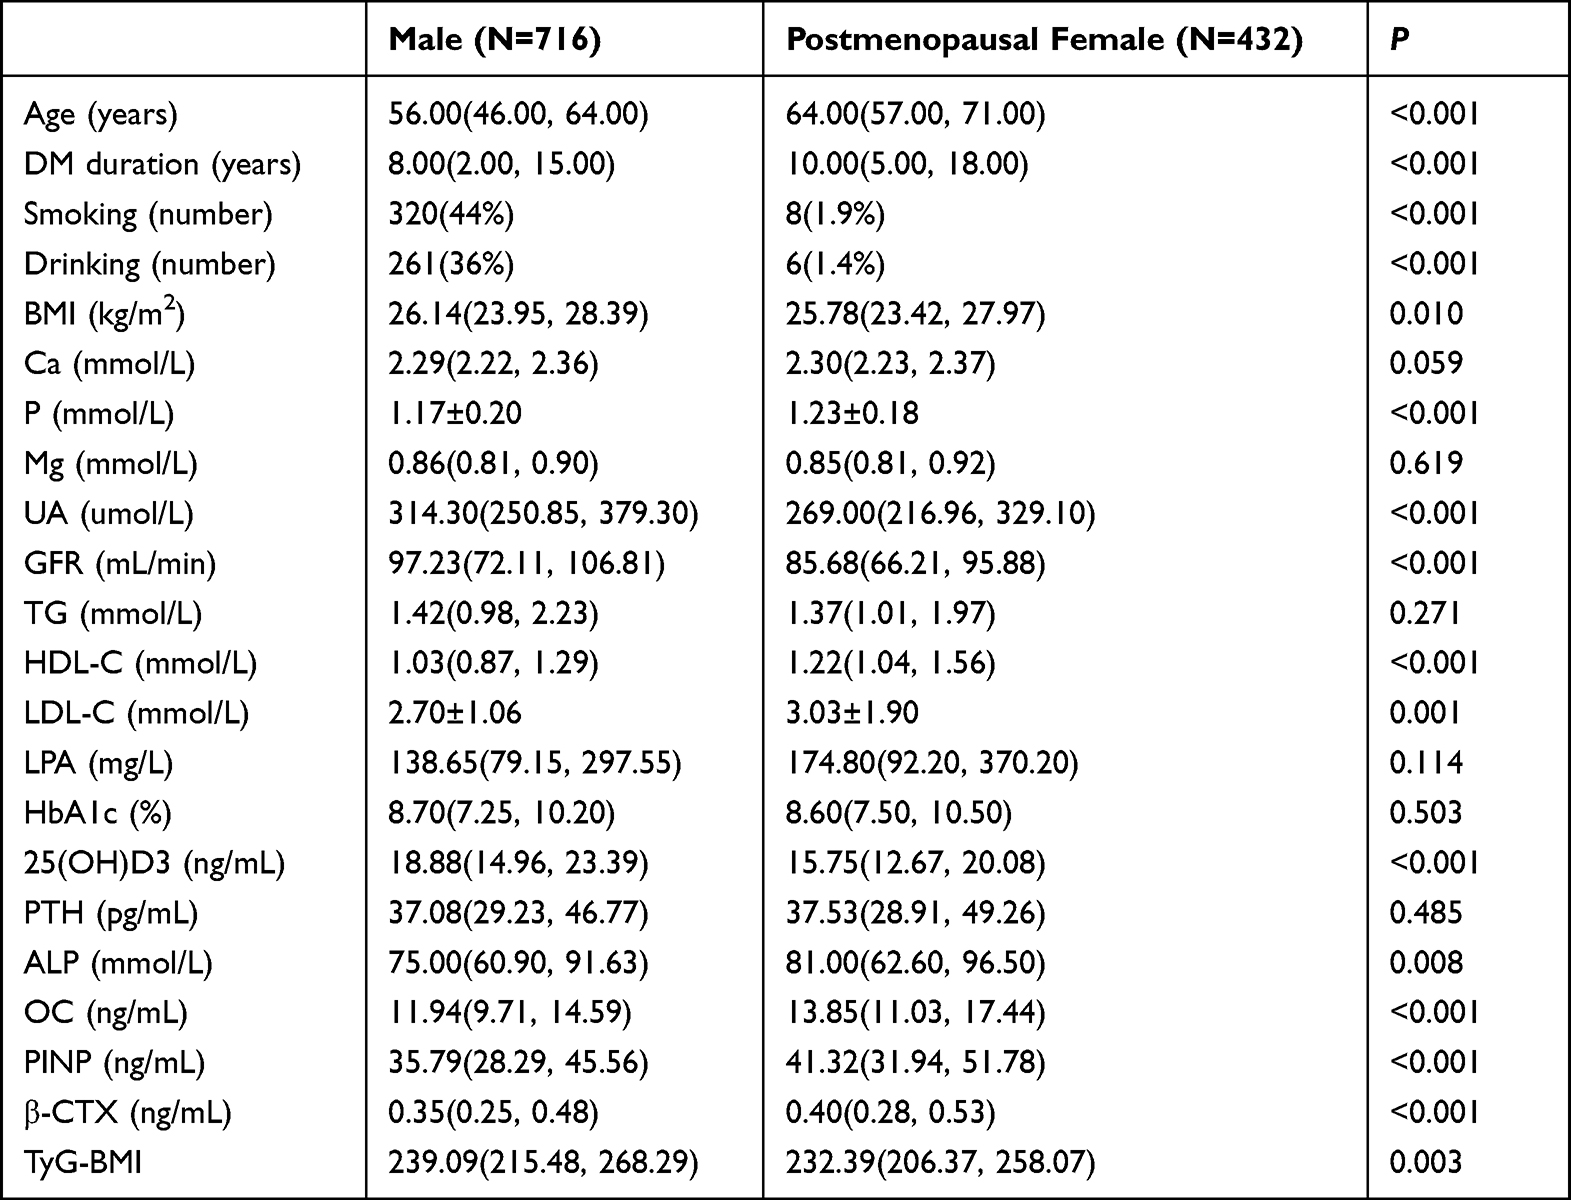 |
Table 1 Comparison of Indicators Between the Male and Postmenopausal Female Groups |
Comparison of baseline characteristics of study subjects with different TyG-BMI levels.
As shown in Table 2, we analyzed the baseline characteristics of the population by TyG-BMI quartiles in ascending order (Q1-Q4). As TyG-BMI increased, BMI, Ca, GFR, TG, LDL-C, HbA1c and PTH levels increased; conversely, age, disease duration, HDL-C, and LPA ratios decreased with increasing TyG-BMI, with statistically significant differences (P<0.05). In contrast, P and Mg levels were not statistically different between the Q1-Q4 groups (P>0.05). Compared with the Q1 group, UA, FT3 and ALP ratios were significantly higher and OC, PINP and β-CTX ratios were lower in the Q2, Q3 and Q4 groups (Figure 1). The proportion of 25(OH)D3 decreased in the Q4 group compared with the Q1 group.
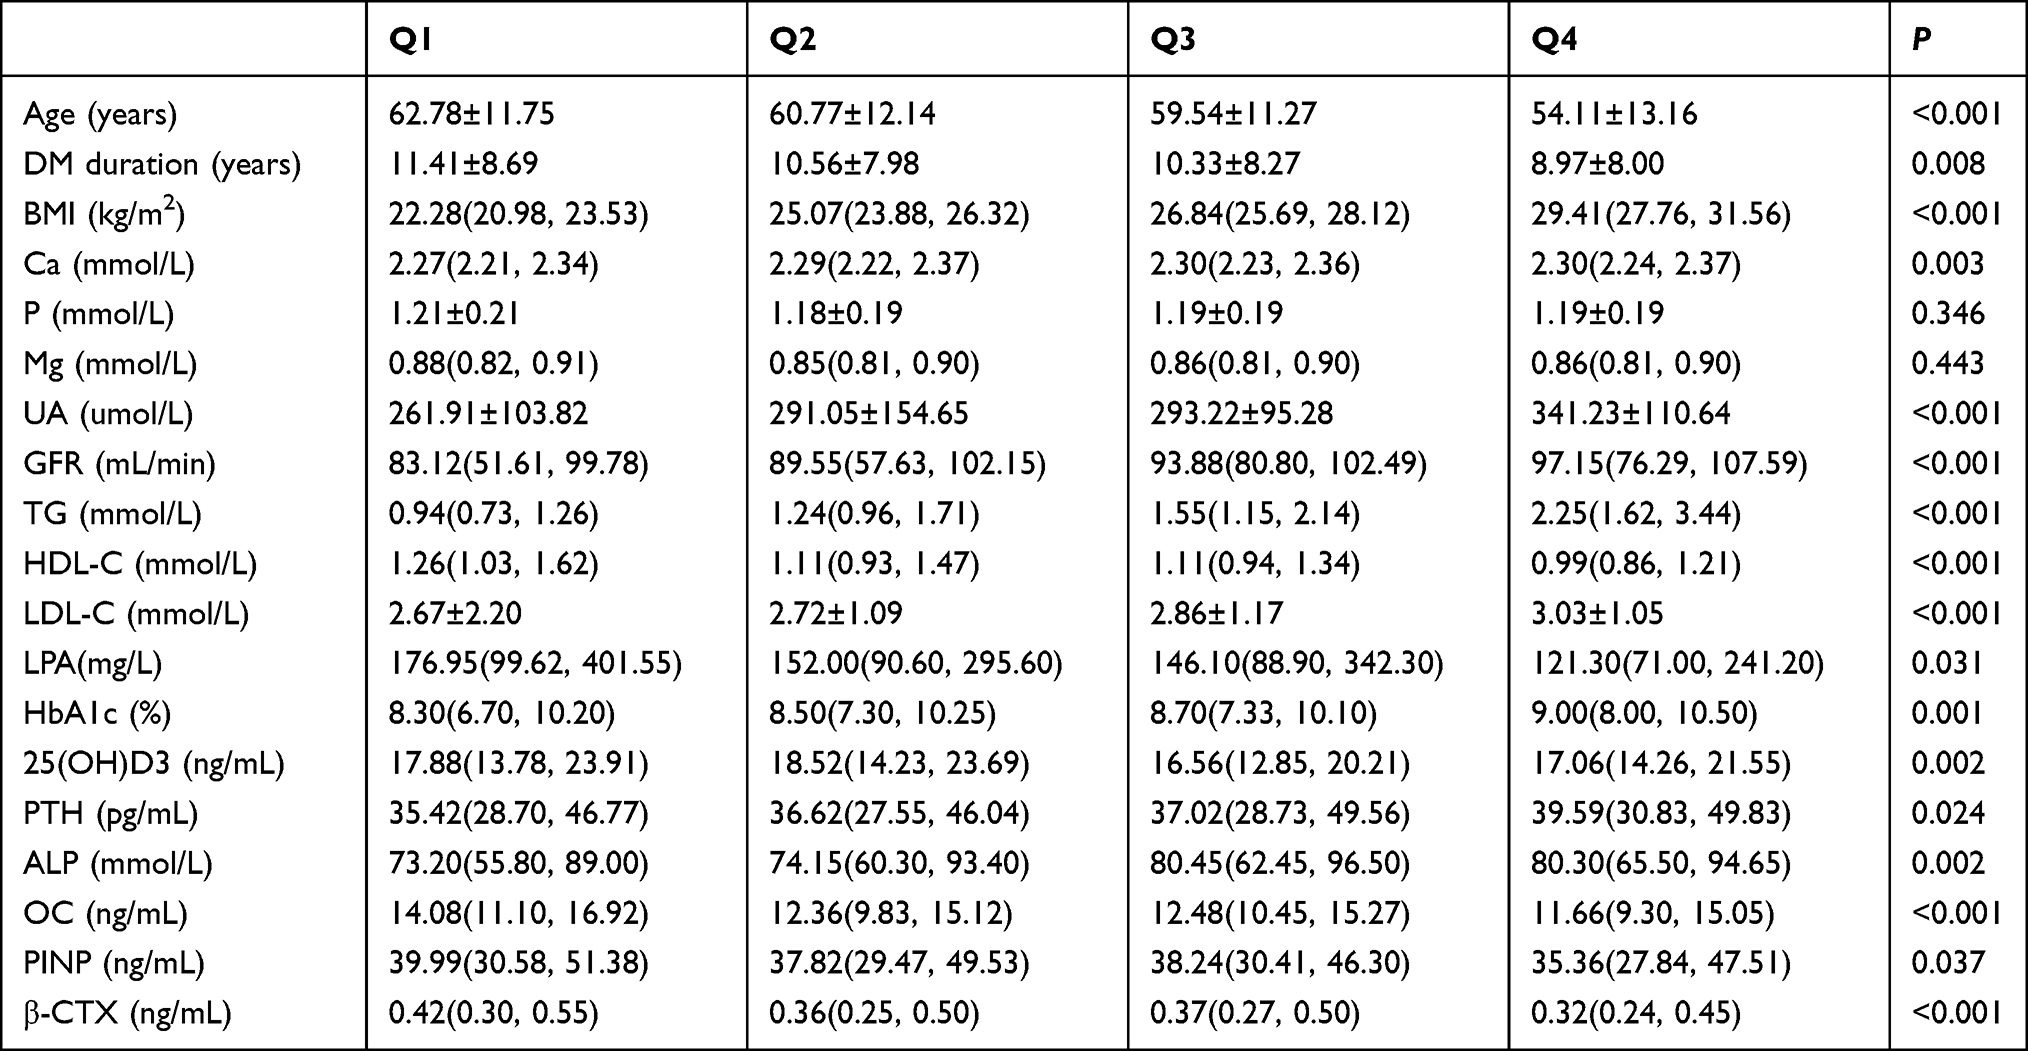 |
Table 2 Clinical Characteristics of Subjects by TyG-BMI Category |
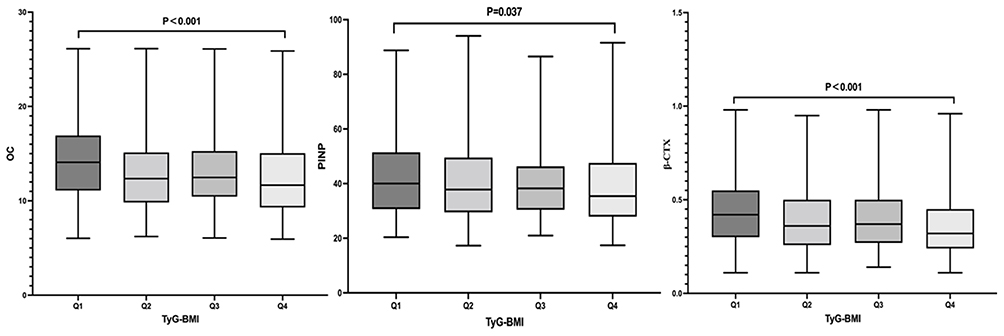 |
Figure 1 Comparison of BTMs at different TyG-BMI levels. |
Comparison of Correlation Between TyG-BMI and Clinical Indicators
Correlation Between TyG-BMI and Clinical Indicators in All T2DM Patients
The results of correlation analysis were shown in the Figure 2, TyG-BMI was positively correlated with Ca (r=0.119, P<0.001), UA (r=0.279, P<0.001), GFR (r=0.217, P<0.001), LDL-C (r=0.155, P<0.001), HbA1c (r=0.132, P<0.001), PTH (r=0.092, P=0.002), ALP (r=0.105, P<0.001), and negatively correlated with Age (r=−0.255, P<0.001), DM duration (r=−0.116, P<0.001), HDL-C (r=−0.221, P<0.001), LPA (r=- 0.158, P=0.002), 25(OH)D3 (r=−0.078, P=0.008), OC (r=−0.149, P<0.001), PINP (r=−0.085, P=0.004), and β-CTX (r=−0.150, P<0.001). There was no correlation with P(r=−0.013, P=0.663) and Mg (r=−0.056, P=0.278) (Figure 2).
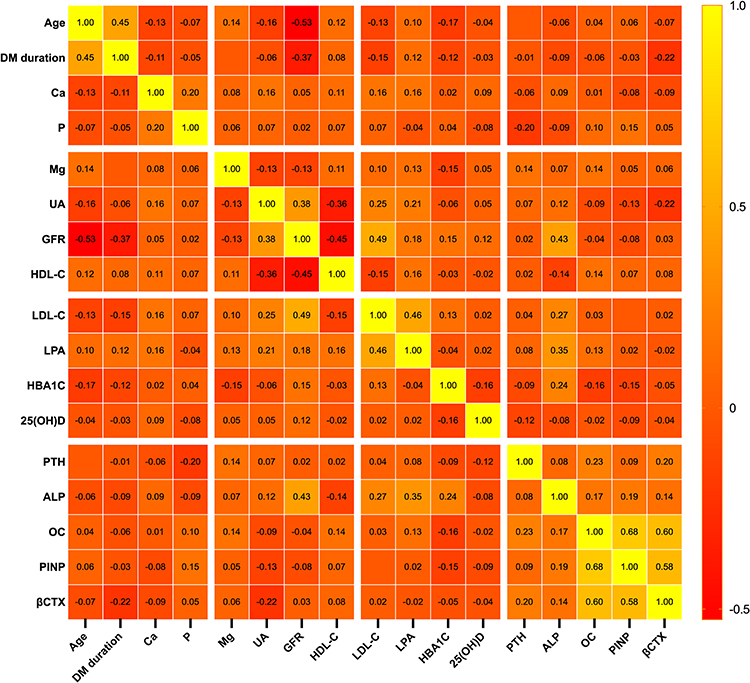 |
Figure 2 Correlation between TyG-BMI and other clinical features in all T2DM patients. |
Correlation Between TyG-BMI and Clinical Indicators in Male Patients with T2DM
As shown in the Figure 3, in male patients, TyG-BMI was positively correlated with Ca (r=0.144, P<0.001), UA (r=0.275, P<0.001), GFR (r=0.232, P<0.001), LDL-C (r=0.211, P<0.001), HbA1c (r=0.126, P=0.001), PTH (r=0.080, P=0.032), and negatively correlated with Age (r=−0.338, P<0.001), DM duration (r=−0.152, P<0.001), HDL-C (r=−0.216, P<0.001), LPA (r=−0.192, P=0.003), OC (r=−0.118, P=0.001), PINP (r=−0.086, P=0.021), β-CTX (r=−0.124, P=0.001).There was no correlation with P (r=0.022, P=0.565), Mg (r=−0.023, P=0.726), 25(OH)D3 (r=−0.064, P=0.085), ALP (r=0.065, P=0.085) (Figure 3).
 |
Figure 3 Correlation between TyG-BMI and other clinical features in male patients with T2DM. |
Correlation Between TyG-BMI and Clinical Indicators in Postmenopausal Women with T2DM
The correlation analysis results were shown in Figure 4, TyG-BMI was positively correlated with UA (r=0.260, P<0.001), GFR (r=0.159, P=0.016), LDL-C (r=0.097, P=0.045), HbA1c (r=0.154, P=0.002), PTH (r=0.114, P=0.018), ALP (r=0.205, P<0.001), and negatively correlated with HDL-C (r= −0.202, P<0.001), 25(OH)D3 (r= −0.170, P<0.001), OC (r=−0.151, P=0.002) and β-CTX (r= −0.166, P=0.001). There was no correlation with Age (r=−0.042, P=0.384), DM duration (r=−0.044, P=0.424), Ca (r=0.090, P=0.072), P (r=−0.026, P=0.597), Mg (r=−0.114, P=0.187), LPA (r=−0.088, P=0.311), PINP (r=−0.042, P=0.387) (Figure 4).
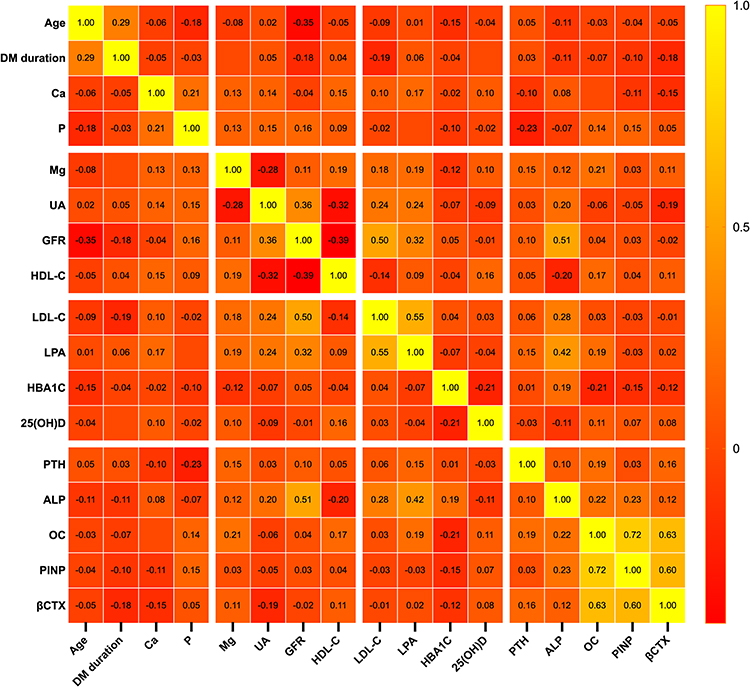 |
Figure 4 Correlation between TyG-BMI and other clinical features in postmenopausal women with T2DM. |
Multiple Linear Regression of TyG-BMI and BTMs
After adjusting for sex, age, disease duration, smoking history, alcohol consumption history, Ca, P, Mg, UA, GFR, HDL-C, LDL-C, LPA, HbA1c, 25(OH)D3, PTH, and ALP in all patients, male patients, and postmenopausal female patients, respectively, it was found that in all patients and male patients TyG-BMI was negatively correlated with OC, PINP, and β-CTX (P<0.05). In postmenopausal female patients, TyG-BMI was negatively correlated with OC and β-CTX (P<0.05), but not with PINP (P>0.05) (Table 3).
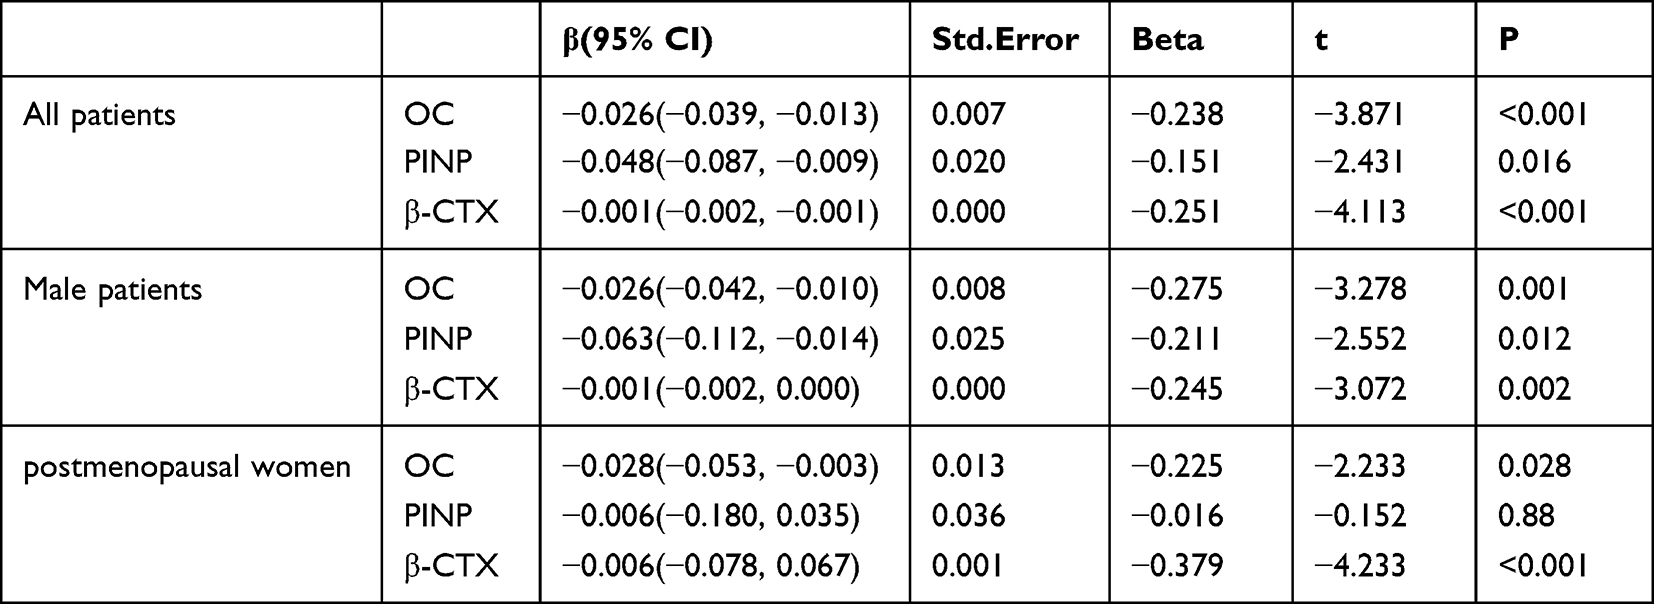 |
Table 3 Multiple Linear Correlation Analysis Between TyG-BMI and OC/ PINP/ CTX |
Subgroup Analysis
In order to understand whether the association between TyG-BMI and BTMs was stable under different age, disease duration, BMI, TG and 25 (OH)D3 levels, subgroup analysis was performed in male patients and postmenopausal women. Taking OC/ PINP/β-CTX as the dependent variable, after adjusting for age, disease duration, smoking history, drinking history, Ca, P, Mg, UA, GFR, HDL-C, LDL-C, LPA, HbA1c, 25(OH)D3, PTH, and ALP, TyG-BMI had a stronger negative correlation with BTMs in male T2DM patients with age < 65, duration < 10, BMI≥24, TG < 1.7, and 25(OH)D3≥20 (P < 0.05) (Table 4).
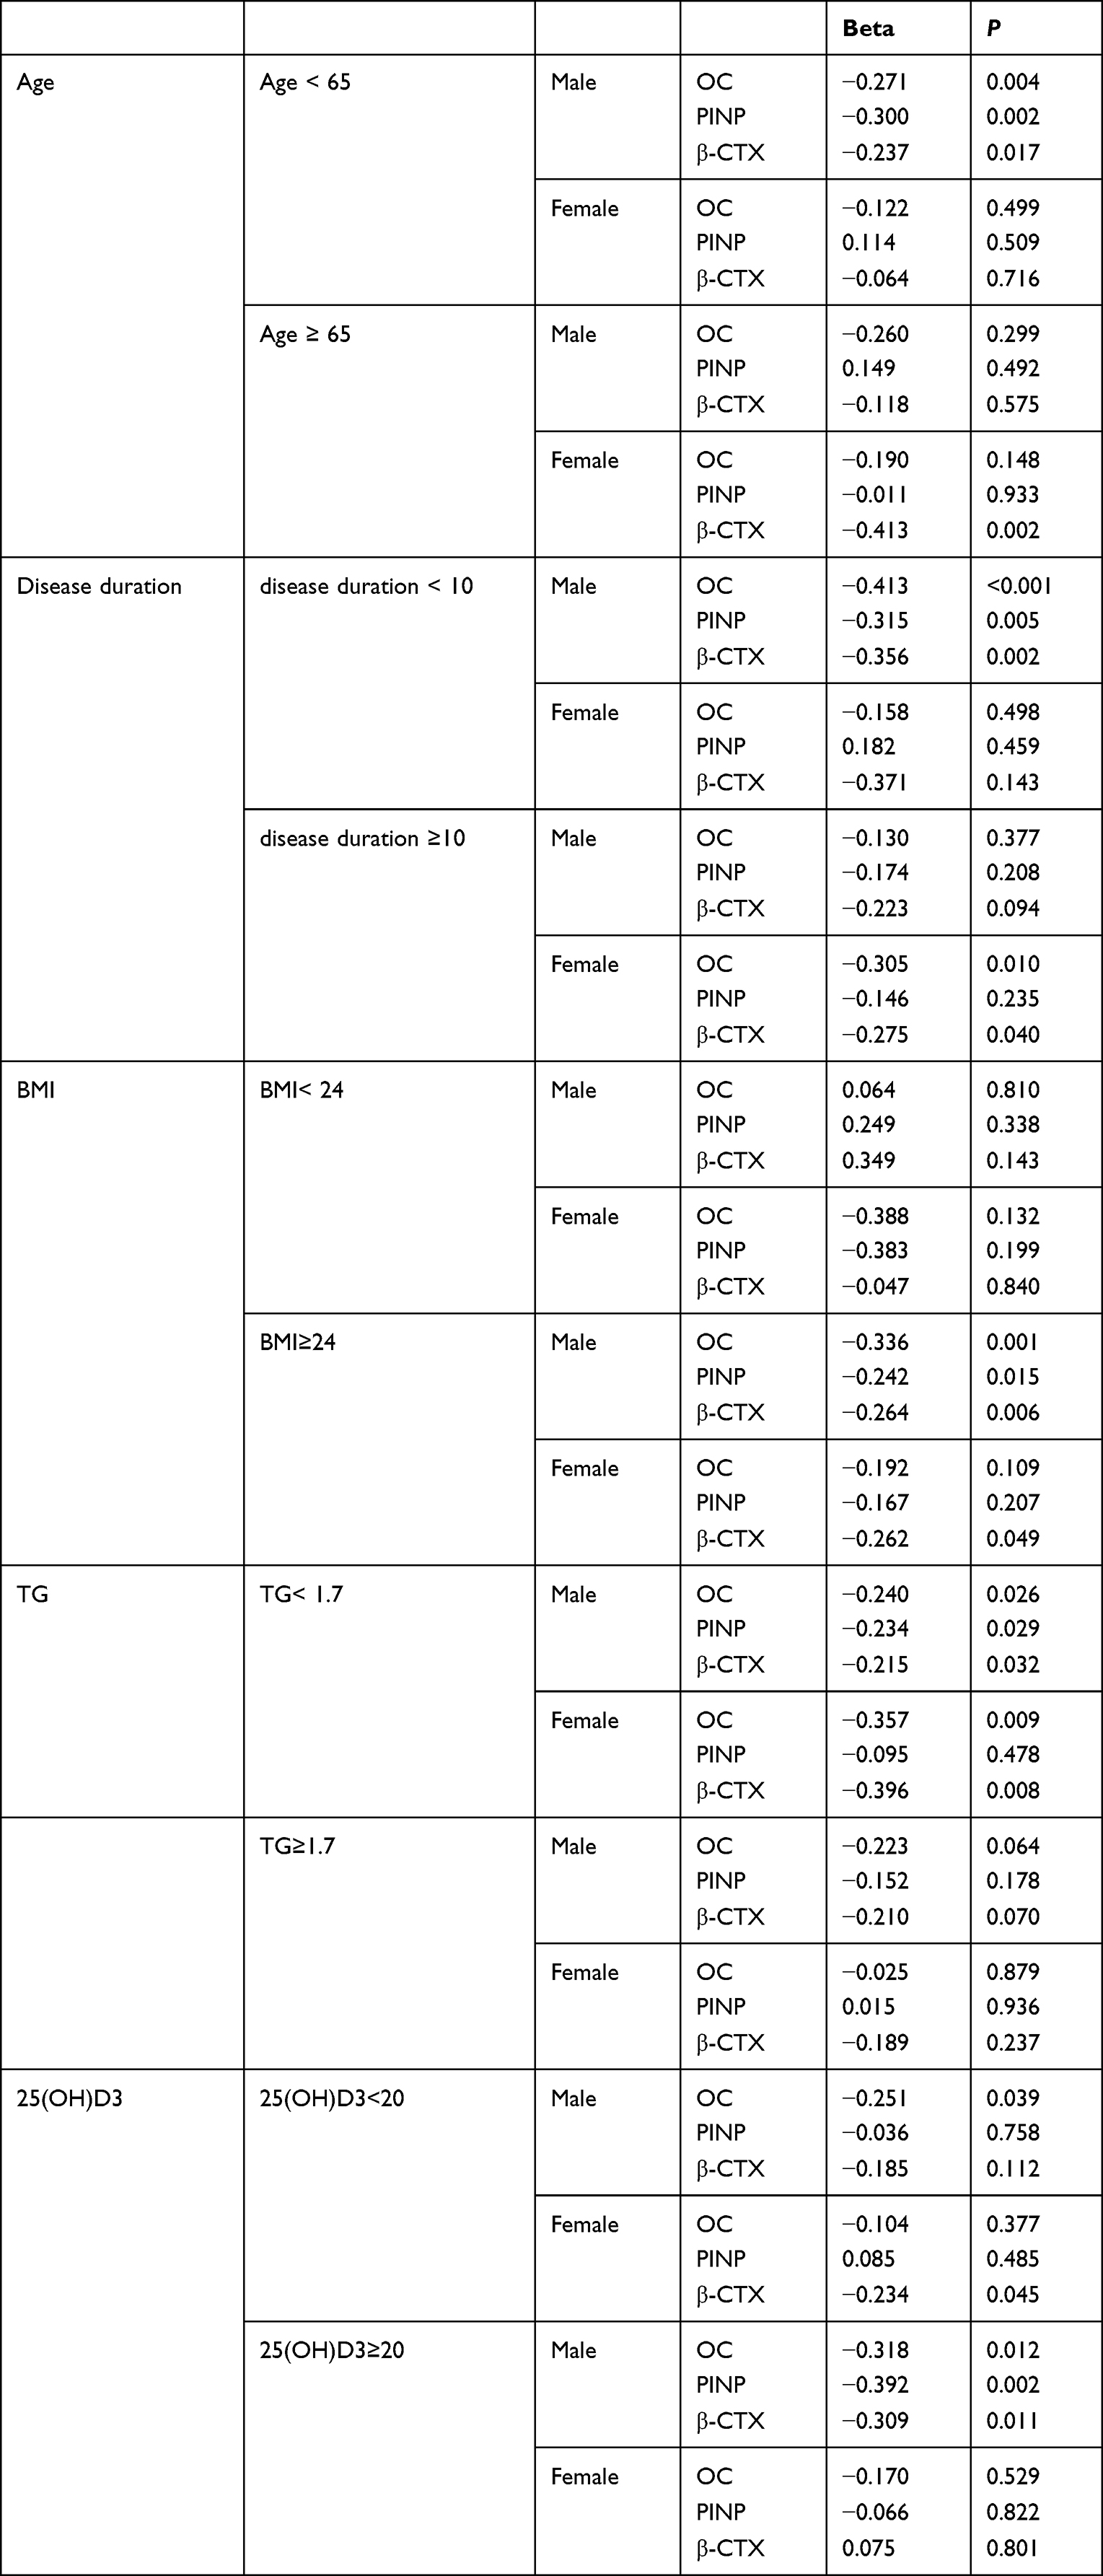 |
Table 4 Subgroup Analysis of the Association of TyG-BMI with OC/PINP/β-CTX |
Discussion
With the aging of the population and the change of lifestyle, the incidence of T2DM combined with osteoporosis is increasing year by year, which has become a public health problem of close concern.32 Many previous studies have confirmed that patients with diabetes have a higher risk of osteoporosis and fractures than the general population.33,34 Therefore, it is particularly important to screen the risk factors of osteoporosis and fracture in diabetic patients as early as possible. This study was the first to find an inverse correlation between TyG-BMI and BTMs, suggesting that high TyG-BMI level impairs bone turnover in T2DM patients. Subgroup analysis according to different clinical indicators showed that the negative correlation of TyG-BMI with BTMs was more obvious in male patients with BMI≥24, age < 65, disease duration < 10, 25(OH)D3≥20, and TG < 1.7. It provides new diagnosis and treatment ideas and evidence for predicting the occurrence of osteoporosis and fractures in diabetic patients.
Numerous studies have found that T2DM is associated with higher bone mineral density,35,36 but T2DM increases the risk of fracture.33 The contradiction between increased BMD and increased fracture risk in T2DM patients may be attributed to decreased bone turnover, changes in bone quality and bone microstructure.37 Therefore, bone mineral density alone does not seem to be a comprehensive measure of osteoporosis in patients with diabetes. BMD, the gold standard of osteoporosis, is easily affected by aortic calcification, degenerative osteoarthrosis, hyperosteoplasia, spinous process, callus and compression fracture, which may make the measured BMD value deviate from the actual.38 At present, BTMs is a promising tool for bone metabolism and quality assessment, and its role in osteoporosis and fracture screening continues to increase.19,39,40 Previous studies have found that bone metabolism is negatively correlated with IR in people with diabetes and hyperglycemia.41 In addition, another study reported that TyG-BMI was positively correlated with bone mineral density and geometry, and negatively correlated with fracture risk in middle-aged and elderly Chinese non-diabetic patients.42 However, the relationship between TyG-BMI and BTMs is still unclear. Therefore, we investigated the correlation between TyG-BMI and BTMs to explore the predictive value of TyG-BMI for osteoporosis and fracture.
TyG-BMI may contribute to low bone turnover in T2DM patients through various mechanisms. The hyperglycemic environment in diabetic patients can inhibit osteoblast differentiation, and inhibit the expression of osteocalcin and other genes involved in osteoblast maturation, destroy the balance between bone formation and resorption, inhibit bone turnover, and lead to an increased risk of fracture.43 Hyperglycemia induces elevated levels of AGEs, which bind to collagen in bone and interact with the receptor for advanced glycosylation end products (RAGE) on bone cells to produce inflammatory and oxidative mediators via nuclear factor κB (NF-κB), leading to impaired bone biomechanical properties and reduced bone mass and increased fracture risk.28 Hyperglycemia and oxidative stress in diabetic patients can affect the differentiation of mesenchymal stem cells and bone formation through the production of reactive oxygen species (ROS).37 Although T2DM patients can develop hyperinsulinemia due to insulin resistance, resulting in increased bone mass, the presence of glycosylated collagen products and reduced cortical thickness result in poorer bone quality and increased fracture risk.44 And with the progression of the disease, the body is relatively deficient in insulin. The relative lack of insulin leads to the reduction of the binding of insulin and insulin receptor, and the weakening of the signaling cascade effect produced by insulin receptor substrate, which affects the proliferation and function of osteoblasts, and leads to the reduction of osteocalcin synthesis by osteoblasts, leading to poor bone mineralization and finally inhibiting bone formation.45,46 In addition, insulin-like growth factor 1 (IGF-1) can affect the proliferation and function of osteoblasts through its receptor, promote the synthesis of bone collagen, reduce collagen degradation, and aggravate the damage of bone mineralization, and IGF-1 released from the bone matrix can even be fed by over-stimulation mammalian target of rapamycin (mTOR) stimulates the differentiation of mesenchymal stem cells into osteoblasts, thereby maintaining bone mass and microstructure.34 However, the relative deficiency of IGF-1 in diabetic patients leads to impaired bone formation.34 The levels of proinflammatory cytokines such as TNF and IL-6 are increased in obese and diabetic patients, which in turn activate osteoclast formation and inhibit osteoblast differentiation.31
Estrogen is the main hormonal regulator of bone metabolism in both sexes and helps to maintain bone homeostasis.47 Therefore, in order to exclude as much as possible the differences in estrogen levels between different genders, men and postmenopausal women were selected as observation subjects in this study. Estrogen deficiency in postmenopausal women, on the one hand, can lead to bone loss by reducing sulfhydryl antioxidants in osteoclasts, sensitize osteoclasts to osteoclast-generating signals, and cause the expression of inflammatory cytokines, thereby promoting osteoclast bone resorption. On the other hand, bone formation is inhibited by inhibiting gene expression, proliferation and differentiation of osteoblasts.47,48 Due to estrogen deficiency in postmenopausal women, the rate of bone remodeling increases and bone resorption is greater than bone formation, resulting in bone loss.49 This state can last for more than 10 years after menopause.49 Testosterone affects bone metabolism by promoting bone formation and inhibiting bone resorption in adulthood.50 In conclusion, there may be gender differences in the relationship between TyG-BMI and BTMs due to the influence of sex hormones. Therefore, this study further analyzed the correlation between TyG-BMI and various clinical indicators in different genders. It was found that in male T2DM patients, TyG-BMI was negatively correlated with OC, PINP and β-CTX, while in postmenopausal female T2DM patients, TyG-BMI was only negatively correlated with OC and β-CTX. There was no correlation with PINP.
In a previous study of 339 postmenopausal women, OC levels were found to be inversely associated with IR.51 In another study of 108 patients with T2DM in central India, an inverse association was found between OC levels and IR.52 These results are consistent with the present study. OC reflects the active degree of bone formation and metabolism.50 Postmenopausal women are prone to high turnover osteoporosis due to the decrease of estrogen level and the active bone renewal. Therefore, it is of great significance for the identification, classification and treatment of early osteoporosis by OC level in clinic. But so far, there are few studies on the relationship between PINP, β-CTX and IR in postmenopausal women. In a study of 549 T2DM patients, IR-related markers were not associated with bone turnover markers OC, PINP, or β-CTX in postmenopausal women.23 The occurrence of such contradictory results may be related to various factors such as the race, age, region, hormone levels, physical activity, and dietary habits of the studied population.50 Therefore, a large number of large sample clinical studies or meta-analysis are needed to further confirm. In addition, although OC and PINP are both markers representing bone formation, TyG-BMI was negatively correlated with OC but not with PINP in the results of this study. It may be because OC reflects the process of bone formation, but also participates in the regulation of bone resorption.50 It is released during bone formation and bone resorption and reflects the overall level of bone metabolism, while PINP mainly reflects the synthesis rate of type I collagen and bone turnover, which is a specific and sensitive indicator of new bone formation.50 Combined with the results of the present study, TyG-BMI in postmenopausal women was negatively correlated with OC and β-CTX, but not with PINP, indicating that changes in bone resorption may be greater than bone formation in postmenopausal women.
This study was the first to find that TyG-BMI is negatively correlated with bone turnover markers in T2DM patients, suggesting that high TyG-BMI levels impaired bone turnover in T2DM patients. Therefore, by monitoring patients’ TyG-BMI levels, it is helpful to screen and assess the risk of osteoporosis and fracture in T2DM patients, which is crucial to reduce the high incidence of osteoporosis and fracture and the high lethality rate. Moreover, compared with dual energy X-ray absorptiometry (DXA) scans and other screening tests for osteoporosis and fracture, TyG-BMI is easy to obtain and economically inexpensive, and can be widely used in clinical practice. However, this study has some limitations. First, because this study was a retrospective study, there were limitations in data collection that could not take into account the effect of patients’ lifestyle, such as exercise, diet, and medication application, on the outcome, and did not include healthy subjects and follow-up data to clarify the causal relationship between the two. Further prospective studies may be needed in the future to analyze their longitudinal correlation. Second, this study was from single-center data, so there were some limitations. Third, in this study, we only compared the relationship between TyG-BMI and BTMs to predict the risk of osteoporosis in T2DM population, and did not compare bone mineral density. In future studies, we should pay attention to the inclusion of patients’ bone mineral density for comprehensive analysis.
Conclusions
This study found that TyG-BMI is negatively correlated with BTMs in T2DM patients, indicating that high TyG-BMI can lead to impaired bone turnover and can be used to evaluate the risk of osteoporosis and fragility fracture in T2DM patients.
Data Sharing Statement
The original data can be available by email at any time (Wenwen Sun: [email protected]).
Disclosure
The authors report no conflicts of interest in this work.
References
1. Zimmet P, Alberti KG, Magliano DJ, Bennett PH. Diabetes mellitus statistics on prevalence and mortality: facts and fallacies. Nat Rev Endocrinol. 2016;12(10):616–622. doi:10.1038/nrendo.2016.105
2. Sellmeyer DE, Civitelli R, Hofbauer LC, Khosla S, Lecka-Czernik B, Schwartz AV. Skeletal metabolism, fracture risk, and fracture outcomes in type 1 and type 2 diabetes. Diabetes. 2016;65(7):1757–1766. doi:10.2337/db16-0063
3. Walsh JS, Obesity VT. Type 2 diabetes and bone in adults. Calcif Tissue Int. 2017;100(5):528–535. doi:10.1007/s00223-016-0229-0
4. Picke AK, Campbell G, Napoli N, Hofbauer LC, Rauner M. Update on the impact of type 2 diabetes mellitus on bone metabolism and material properties. Endocr Connect. 2019;8(3):R55–r70. doi:10.1530/EC-18-0456
5. Purnamasari D, Puspitasari MD, Setiyohadi B, Nugroho P, Isbagio H. Low bone turnover in premenopausal women with type 2 diabetes mellitus as an early process of diabetes-associated bone alterations: a cross-sectional study. BMC Endocr Disord. 2017;17(1):72. doi:10.1186/s12902-017-0224-0
6. Li YM, Schilling T, Benisch P, et al. Effects of high glucose on mesenchymal stem cell proliferation and differentiation. Biochem Biophys Res Commun. 2007;363(1):209–215. doi:10.1016/j.bbrc.2007.08.161
7. Wittrant Y, Gorin Y, Woodruff K, et al. High d(+)glucose concentration inhibits RANKL-induced osteoclastogenesis. Bone. 2008;42(6):1122–1130. doi:10.1016/j.bone.2008.02.006
8. Chiodini I, Catalano A, Gennari L, Gaudio A. Osteoporosis and fragility fractures in type 2 diabetes. J Diabetes Res. 2020;2020:9342696. doi:10.1155/2020/9342696
9. Imerb N, Thonusin C, Chattipakorn N, Chattipakorn SC. Aging, obese-insulin resistance, and bone remodeling. Mech Ageing Dev. 2020;191:111335. doi:10.1016/j.mad.2020.111335
10. Muniyappa R, Lee S, Chen H, Quon MJ. Current approaches for assessing insulin sensitivity and resistance in vivo: advantages, limitations, and appropriate usage. Am J Physiol Endocrinol Metab. 2008;294(1):E15–26. doi:10.1152/ajpendo.00645.2007
11. Er LK, Wu S, Chou HH, et al. Triglyceride glucose-body mass index is a simple and clinically useful surrogate marker for insulin resistance in nondiabetic individuals. PLoS One. 2016;11(3):e0149731. doi:10.1371/journal.pone.0149731
12. Zheng S, Shi S, Ren X, et al. Triglyceride glucose-waist circumference, a novel and effective predictor of diabetes in first-degree relatives of type 2 diabetes patients: cross-sectional and prospective cohort study. J Transl Med. 2016;14(1):260. doi:10.1186/s12967-016-1020-8
13. Zeng ZY, Liu SX, Xu H, Xu X, Liu XZ, Zhao XX. Association of triglyceride glucose index and its combination of obesity indices with prehypertension in lean individuals: a cross-sectional study of Chinese adults. J Clin Hypertens. 2020;22(6):1025–1032. doi:10.1111/jch.13878
14. Jiang C, Yang R, Kuang M, Yu M, Zhong M, Zou Y. Triglyceride glucose-body mass index in identifying high-risk groups of pre-diabetes. Lipids Health Dis. 2021;20(1):161. doi:10.1186/s12944-021-01594-7
15. Wang X, Liu J, Cheng Z, Zhong Y, Chen X, Song W. Triglyceride glucose-body mass index and the risk of diabetes: a general population-based cohort study. Lipids Health Dis. 2021;20(1):99. doi:10.1186/s12944-021-01532-7
16. Li Y, You A, Tomlinson B, et al. Insulin resistance surrogates predict hypertension plus hyperuricemia. J Diabetes Investig. 2021;12(11):2046–2053. doi:10.1111/jdi.13573
17. Sheng G, Lu S, Xie Q, Peng N, Kuang M, Zou Y. The usefulness of obesity and lipid-related indices to predict the presence of Non-alcoholic fatty liver disease. Lipids Health Dis. 2021;20(1):134. doi:10.1186/s12944-021-01561-2
18. Du Z, Xing L, Lin M, Sun Y. Estimate of prevalent ischemic stroke from triglyceride glucose-body mass index in the general population. BMC Cardiovasc Disord. 2020;20(1):483. doi:10.1186/s12872-020-01768-8
19. Cosman F, de Beur SJ, LeBoff MS, et al. Clinician’s guide to prevention and treatment of osteoporosis. Osteoporos Int. 2014;25(10):2359–2381. doi:10.1007/s00198-014-2794-2
20. Greenblatt MB, Tsai JN, Wein MN. Bone turnover markers in the diagnosis and monitoring of metabolic bone disease. Clin Chem. 2017;63(2):464–474. doi:10.1373/clinchem.2016.259085
21. Conte C, Epstein S, Napoli N. Insulin resistance and bone: a biological partnership. Acta Diabetol. 2018;55(4):305–314. doi:10.1007/s00592-018-1101-7
22. Thrailkill KM, Lumpkin CK
23. Li Z, Qi C, Pan X, et al. The relationship between estimated glucose disposal rate and bone turnover markers in type 2 diabetes mellitus. Endocrine. 2022;77(2):242–251. doi:10.1007/s12020-022-03090-z
24. Aktas G, Kocak MZ, Taslamacioglu Duman T, et al. Mean Platelet Volume (MPV) as an inflammatory marker in type 2 diabetes mellitus and obesity. Bali Med J. 2018;7:3. doi:10.15562/bmj.v7i3.806
25. Boden G. Obesity, insulin resistance and free fatty acids. Curr Opin Endocrinol Diabetes Obes. 2011;18(2):139–143. doi:10.1097/MED.0b013e3283444b09
26. Mittendorfer B. Origins of metabolic complications in obesity: adipose tissue and free fatty acid trafficking. Curr Opin Clin Nutr Metab Care. 2011;14(6):535–541. doi:10.1097/MCO.0b013e32834ad8b6
27. Yuzefovych L, Wilson G, Rachek L. Different effects of oleate vs. palmitate on mitochondrial function, apoptosis, and insulin signaling in L6 skeletal muscle cells: role of oxidative stress. Am J Physiol Endocrinol Metab. 2010;299(6):E1096–1105. doi:10.1152/ajpendo.00238.2010
28. Waqas K, Chen J, Koromani F, et al. Skin autofluorescence, a noninvasive biomarker for advanced glycation end-products, is associated with prevalent vertebral and major osteoporotic fractures: the Rotterdam study. J Bone Miner Res. 2020;35(10):1904–1913. doi:10.1002/jbmr.4096
29. Wang F, He T, Wang G, Han T, Yao Z. Association of triglyceride glucose-body mass index with non-small cell lung cancer risk: a case-control study on Chinese adults. Front Nutr. 2022;9:1004179. doi:10.3389/fnut.2022.1004179
30. Wu D, Cline-Smith A, Shashkova E, Perla A, Katyal A, Aurora R. T-Cell mediated inflammation in postmenopausal osteoporosis. Front Immunol. 2021;12:687551. doi:10.3389/fimmu.2021.687551
31. Muñoz J, Akhavan NS, Mullins AP, Arjmandi BH. Macrophage polarization and osteoporosis: a review. Nutrients. 2020;12:10. doi:10.3390/nu12102999
32. Zhao C, Liu G, Zhang Y, et al. Association between serum levels of bone turnover markers and bone mineral density in men and women with type 2 diabetes mellitus. J Clin Lab Anal. 2020;34(4):e23112. doi:10.1002/jcla.23112
33. Jiao H, Xiao E, Graves DT. Diabetes and its effect on bone and fracture healing. Curr Osteoporos Rep. 2015;13(5):327–335. doi:10.1007/s11914-015-0286-8
34. Yiwan S, Huajun W, Xiaofei Z. Research progress on fracture risk of type 2 diabetes mellitus and its related mechanisms. Chin Orthop J Clin Basic. 2020;12(5):304–311.
35. Oei L, Rivadeneira F, Zillikens MC, Oei EH. Diabetes, diabetic complications, and fracture risk. Curr Osteoporos Rep. 2015;13(2):106–115. doi:10.1007/s11914-015-0260-5
36. Xing Y, Liu J, Liu H, Ma H. Relationship of bone turnover markers with serum uric acid-to-creatinine ratio in men and postmenopausal women with type 2 diabetes. Diabetes Metab Syndr Obes. 2022;15:3205–3217. doi:10.2147/DMSO.S384694
37. Napoli N, Chandran M, Pierroz DD, Abrahamsen B, Schwartz AV, Ferrari SL. Mechanisms of diabetes mellitus-induced bone fragility. Nat Rev Endocrinol. 2017;13(4):208–219. doi:10.1038/nrendo.2016.153
38. He L. Analysis of bone metabolism index and its influencing factors in type 2 diabetic patients with osteoporosis [master’s thesis]. Beijing: North China University of Science and Technology; 2019.
39. Lane NE, Saag K, O’Neill TJ, et al. Real-world bone turnover marker use: impact on treatment decisions and fracture. Osteoporos Int. 2021;32(5):831–840. doi:10.1007/s00198-020-05734-0
40. Jain S. Role of bone turnover markers in osteoporosis therapy. Endocrinol Metab Clin North Am. 2021;50(2):223–237. doi:10.1016/j.ecl.2021.03.007
41. Guo H, Wang C, Jiang B, et al. Association of insulin resistance and β-cell function with bone turnover biomarkers in dysglycemia patients. Front Endocrinol (Lausanne). 2021;12:554604. doi:10.3389/fendo.2021.554604
42. Cho YK, Lee J, Kim HS, et al. Triglyceride glucose-waist circumference better predicts coronary calcium progression compared with other indices of insulin resistance: a longitudinal observational study. J Clin Med. 2020;10:1. doi:10.3390/jcm10010092
43. Shi Y, Wang H, Zheng X. Research progress on fracture risk and related mechanisms in type 2 diabetes mellitus. Chin J Orthop Clin Basic Res. 2020;12(Z1):304–311.
44. Lakatos P, Szili B, Bakos B, Takacs I, Putz Z, Istenes I. Thyroid hormones, glucocorticoids, insulin, and bone. Handb Exp Pharmacol. 2020;262:93–120.
45. Vianna AGD, Sanches CP, Barreto FC. Review article: effects of type 2 diabetes therapies on bone metabolism. Diabetol Metab Syndr. 2017;9:75. doi:10.1186/s13098-017-0274-5
46. Wei J, Ferron M, Clarke CJ, et al. Bone-specific insulin resistance disrupts whole-body glucose homeostasis via decreased osteocalcin activation. J Clin Invest. 2014;124(4):1–13. doi:10.1172/JCI72323
47. Nakamura T, Imai Y, Matsumoto T, et al. Estrogen prevents bone loss via estrogen receptor alpha and induction of Fas ligand in osteoclasts. Cell. 2007;130(5):811–823. doi:10.1016/j.cell.2007.07.025
48. Lean JM, Davies JT, Fuller K, et al. A crucial role for thiol antioxidants in estrogen-deficiency bone loss. J Clin Invest. 2003;112(6):915–923. doi:10.1172/JCI200318859
49. Decai C, Eryuan L, Ling X, Zhenlin Z. Guidelines for the clinical application of biochemical markers of bone metabolism. J Bone Miner Res. 2015;8(04):283–293.
50. Zhang M, Zhang X, Deng W, et al. Expert consensus on clinical application of biochemical markers of bone metabolism(2020). Chin Med J. 2020;26(06):781–796.
51. Im JA, Yu BP, Jeon JY, Kim SH. Relationship between osteocalcin and glucose metabolism in postmenopausal women. Clin Chim Acta. 2008;396(1–2):66–69. doi:10.1016/j.cca.2008.07.001
52. Sarkar PD, Choudhury AB. Relationships between serum osteocalcin levels versus blood glucose, insulin resistance and markers of systemic inflammation in central Indian type 2 diabetic patients. Eur Rev Med Pharmacol Sci. 2013;17(12):1631–1635.
 © 2023 The Author(s). This work is published and licensed by Dove Medical Press Limited. The
full terms of this license are available at https://www.dovepress.com/terms
and incorporate the Creative Commons Attribution
- Non Commercial (unported, 3.0) License.
By accessing the work you hereby accept the Terms. Non-commercial uses of the work are permitted
without any further permission from Dove Medical Press Limited, provided the work is properly
attributed. For permission for commercial use of this work, please see paragraphs 4.2 and 5 of our Terms.
© 2023 The Author(s). This work is published and licensed by Dove Medical Press Limited. The
full terms of this license are available at https://www.dovepress.com/terms
and incorporate the Creative Commons Attribution
- Non Commercial (unported, 3.0) License.
By accessing the work you hereby accept the Terms. Non-commercial uses of the work are permitted
without any further permission from Dove Medical Press Limited, provided the work is properly
attributed. For permission for commercial use of this work, please see paragraphs 4.2 and 5 of our Terms.