Back to Journals » OncoTargets and Therapy » Volume 12
Assessment of tumor mutation burden calculation from gene panel sequencing data
Authors Xu Z, Dai J, Wang D, Lu H, Dai H, Ye H, Gu J, Chen S, Huang B
Received 30 November 2018
Accepted for publication 13 March 2019
Published 6 May 2019 Volume 2019:12 Pages 3401—3409
DOI https://doi.org/10.2147/OTT.S196638
Checked for plagiarism Yes
Review by Single anonymous peer review
Peer reviewer comments 2
Editor who approved publication: Dr Sanjeev K. Srivastava
Zhenwu Xu,1 Jiawei Dai,2 Dandan Wang,3 Hui Lu,2 Heng Dai,3,4 Hao Ye,3,4 Jianlei Gu,2 Shengjia Chen,1 Bingding Huang3,4
1Department of Thoracic Medical Oncology, Fujian Cancer Hospital & Fujian Medical University Cancer Hospital, Fuzhou, Fujian, People’s Republic of China; 2SJTU-Yale Joint Center for Biostatistics, Department of Bioinformatics and Biostatistics, School of Life Science and Biotechnology, Shanghai Jiao Tong University, Shanghai, People’s Republic of China; 3Research and Development, Sinotech Genomics Inc, Shanghai 21000, People’s Republic of China; 4Institute of Synthetic Biology, Shenzhen Institute of Advanced Technology, Chinese Academy of Science, Shenzhen, Guangdong, People’s Republic of China
Background: High tumor mutation burden (TMB) is an emerging selection biomarker for immune checkpoint blockade in tumors such as melanoma and non-small cell lung cancer. TMB is typically calculated from whole genome sequencing or whole exome sequencing (WES) data. Recently, clinical trials showed that TMB can also be estimated from targeted sequencing of a panel of only a few hundred genes of interest, which can be performed at a high depth for clinical applications.
Materials and methods: In this study, we systematically investigated the distribution of TMB and preferences at the gene and mutation level, as well as the correlation between TMB calculated by WES and panel sequencing data using somatic mutation data from 15 cancer types from The Cancer Genome Atlas (TCGA).
Results: We proposed a pan-cancer TMB panel and demonstrated that it had a higher correlation with WES than other panels. Our panel could serve as a reference data-set for TMB-oriented panel design to identify patients for immunotherapy.
Keywords: PD-1/PD-L1 blockade, Gene panel, hotspot mutation
Introduction
Immunotherapy has profoundly changed cancer treatment, providing durable benefits across a wide range of cancer types once considered untreatable.1–7 To date, more than 1,600 clinical trials on PD-1/PD-L1 blockade have been registered in clinicaltrials.gov. Patients with advanced non-small cell lung cancer (NSCLC) treated with nivolumab (Opdivo), an anti-PD-1 monoclonal antibody checkpoint inhibitor, achieved a five-year overall survival (OS) rate of 16%, comparing with an OS of 4% with standard-of-care chemotherapy.8 However, patient response rates remain relatively low at 15–40%,9 indicating a need for effective biomarkers to identify patients who are likely to respond to PD-1/PD-L1 blockade.
Many studies have attempted to identify reliable biomarkers in patients most likely to benefit from immune checkpoint blockade. Immunohistochemistry (IHC) for PD-L1 protein expression was the first diagnostic biomarker approved by the FDA for PD-1/PD-L1 treatment. However, the high false-negative rate and lack of standardized procedures mean that this assay is still far from being an ideal biomarker for immunotherapy response prediction.10,11 In recent years, some progress has been made in the discovery of multiple genome stability-related biomarkers that correlate highly with the response of immunotherapy in multiple cancer types.1,6,7,9,12–14 These include tumor mutation burden (TMB) or tumor mutation load, neoantigen burden, DNA mismatch repair deficiency, and high microsatellite instability. Of these, TMB is most robust, effective and clinical verifiable biomarker in multiple cancer types.9,12,15,16 Previous studies in small-cell lung cancer and NSCLC found a remarkable association between TMB values and the production of neo-antigen peptides, thought to be highly correlated with tumor immune response.17,18 Moreover, the clinical trial CheckMate-032 study showed that TMB level has strong distinguishing power in both Nivolumab single agent treatment and Nivolumab plus Ipilimumab combination therapy.19,20
TMB of a tumor sample is calculated by the number of non-synonymous somatic mutations (single nucleotide variants and small insertions/deletions) per mega-base in coding regions.21 TMB represents both the stability level of the tumor genome and heterogeneity of the tumor micro-environment. However, methods to calculate TMB differ greatly in scientific research and clinical practice. Usually, whole genome sequencing, WES and panel sequencing are used to calculate TMB, with various approaches to filter somatic mutations. In research, the most common method is WES, which sequences only the coding regions of the genome, with average coverage of 120X to 150X. However, in clinical application, some studies use panel sequencing to estimate TMB.22 Although only a small number of genes (about 300–500) are covered, gene panel sequences can identify rare somatic mutations because of the higher sequencing depth compared to WES. For example, the FDA recently approved two cancer-related genes panels, FoundationOne CDx (F1CDx) and MSK-IMPACT.11,21 F1CDx adopts a tumor-only sequencing strategy while MSK-IMPACT requires sequencing of both the tumor and its matched normal sample. In F1CDx, synonymous mutations are counted while hotspot driver mutations are excluded when calculating TMB. With MSK-IMPACT, TMB is calculated with similar filtering criteria to those used in WES. In addition to these two panels, there are also other large gene panels from different institutes that approximate TMB, with the size of the panel another important factor influencing TMB approximation.
Further efforts are still needed for more accurate TMB approximation from targeted sequencing data of cancer-related gene panels. In this work, we attempted to investigate the TMB distributions in WES level across different cancer types using WES data from the TCGA data-set. We studied frequently mutated genes and hotspot mutations and their associations with TMB. We also examined the correlation between TMB approximation from F1CDX, MSK-IMPACT, their union panel (F1CDX+MSK) and WES. Furthermore, based on hotspot-mutated gene sets in different cancers, we proposed an optimized pan-cancer panel for better TMB estimation. This panel could serve as a reference data-set for gene selection in TMB-oriented panels designed for immunotherapy and other clinical applications, such as targeted therapy for solid tumors.
Material and methods
Test data-set
VCF files of somatic mutations from WES sequencing data called by Mutect2 for 15 different cancer types were downloaded from the TCGA database (
TMB calculation
TMB was defined as the number of somatic mutations in the coding region per megabase, including single nucleotide variants (SNVs) and small INDELs (insertions and deletions, usually less than 20 bases). However, the means to determine reliable somatic coding mutations for TMB calculation was not trivial. In the F1CDx approach, synonymous mutations were included. However, stop-gain mutations in tumor suppressor genes and hotspot driver mutations were not included in order to reduce bias due to enrichment of cancer-related genes in the F1CDx panel. Here, we followed the F1CDx approach to calculate the TMB for our panel, defining the cutoff values as TMB-high (≥20 mutations/Mb), TMB-medium (<20 mutations/Mb ≥10 mutations/Mb) and TMB-low (<10 mutations/Mb). Others filtering parameters of somatic mutations identified by WES for TMB calculation were a mutated allele frequency greater than 5% and a sequence depth greater than 20X in tumor samples greater or 10X in normal samples.
Pan-cancer TMB panel
Genes with a high mutation frequency in cancer patients were selected for a pan-cancer panel to estimate TMB. We calculated the proportion of patient samples from 15 different cancers with mutations in each gene. For each cancer, genes were sorted in descending order of the previous proportion and the cumulative value of the proportion was calculated. Based on a cumulative value of 30%, we selected genes from all 15 cancers and added genes appearing in more than 10 cancers to the pan-cancer TMB panel. In total, 524 genes were identified and included in the panel.
Improved correlation analysis
As TMB calculation from panels and WES both use somatic mutations from TCGA samples, a simple correlation analysis might cause “over-fitting”. To avoid this problem, we further trained a linear regression model on a set (approximately 80%) of randomly selected samples from TCGA for every cancer. The remaining samples were used as the test data-set. During the training process, we fit linear regression models as WES TMB = a + b * Panel TMB for 15 cancers. The purpose of these models was to calculate the predicted TMB for samples in the test data-set. In this way, we obtained the correlation between predicted TMB and real TMB. By comparing the correlation between panels and WES, performance of different panels and the pan-cancer TMB panel was evaluated.
Results
TMB distribution in WES level
We first examined the distribution of TMB at the WES level for each cancer type as the somatic mutations were called from WES data in the TCGA data-set. Based on the WES TMB distribution results shown in Figure 1A and B, we found that TMB distributions were very different in different cancer types. For example, SKCM had the highest TMB level, with the third quartile reaching 20 mutation/Mb (the threshold for TMB-high samples in the F1CDx study23). Using this threshold, 530 of 6,625 (7.2%) samples were identified as TMB-high. In BLCA, COAD, LUAD, LUSC, SKCM, STAD and UCEC, the percentage of TMB-high samples ranged from 5–30%. However, the percentage of TMB-high samples in the other eight cancer types (BRCA, KIRC, LIHC, GBM, OV, PRAD, USCA and PAAD) were very low (0–4%). Though KIRC and LIHC had low TMB distributions, a relatively high objective response rate to immunotherapy for these two cancers were still observed.9 These results indicated that different cancer types have different TMB distribution level, and that a simple cutoff value for TMB-high samples (defined here as 20 mutations/Mb) is not suitable in predict efficacy of immunotherapy in every solid tumor type. For cancers with low TMB distributions, more clinical trials are needed to confirm TMB as a good marker, and a suitable TMB cutoff must be determined using a large number of patient samples with known corresponding clinical response results to immunotherapy.
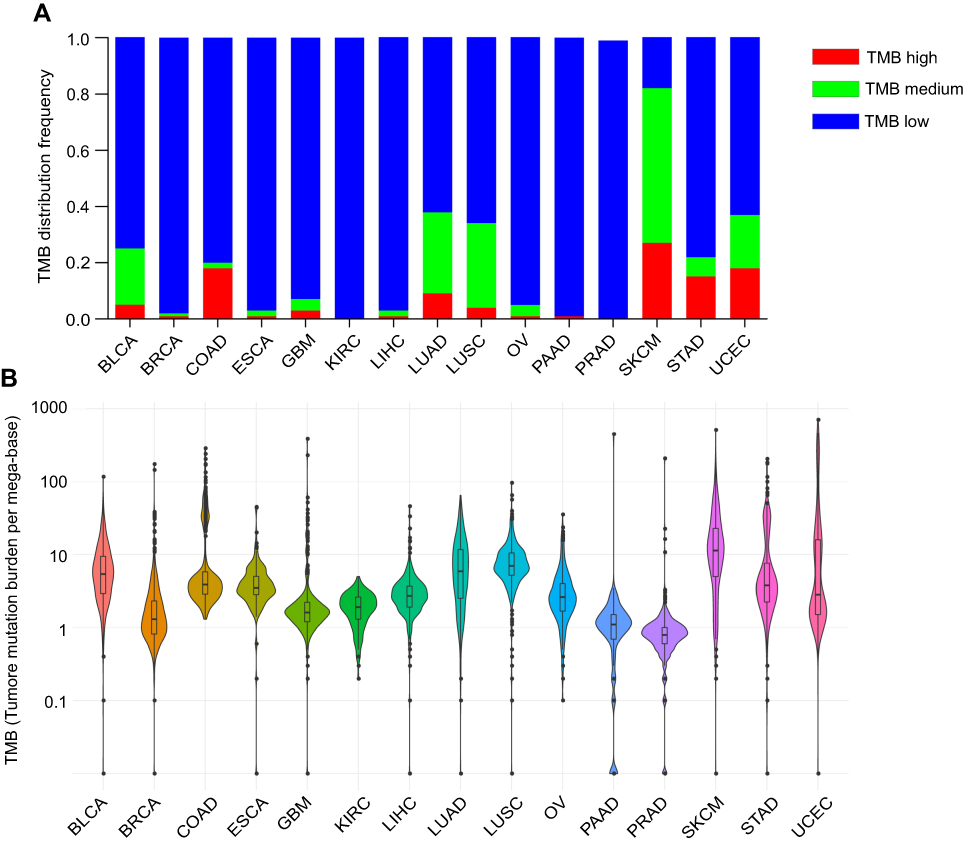 | Figure 1 Tumor mutation burden (TMB) distribution in whole exome sequencing (WES) level. (A) The histogram plots show the frequency of TMB high, medium and low in WES level (B) Violin plots show the distribution of the TMB for 15 tumor types in WES level. Abbreviations: LUAD, lung adenocarcinoma; LUSC, lung squamous cell carcinoma ; BLCA, bladder urothelial carcinoma; COAD, colon adenocarcinoma; BRCA, breast invasive carcer; SKCM, skin cutaneous melanoma; STAD, stomach adenocarcinoma; KIRC, kidney renal papillary cell carcinoma; LIHC, liver hepatocellular carcinoma; GBM, glioblastoma multiforme; UCEC, uterine corpus endometrial carcinoma; OV, ovarian serous cystadenocarcinoma; PRAD, prostate adenocarcinoma; ESCA, esophageal carcinoma; PAAD, pancreatic adenocarcinoma. |
Top mutated genes in WES level
The top 20 most commonly mutated genes in each cancer were calculated and shown in
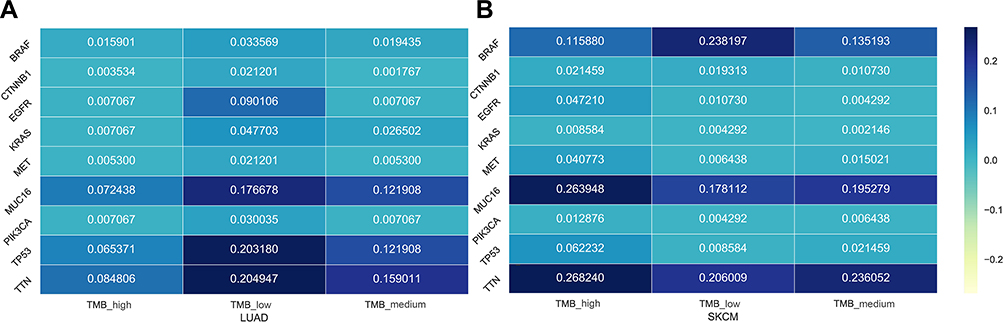 | Figure 2 The mutated frequency of 9 genes in WES level for data-sets of all samples, TMB-high samples, TMB-medium samples and TMB-low samples. (A) LUAD. (B) SKCM.Abbreviations: LUAD, lung adenocarcinoma; SKCM, skin cutaneous melanoma; TMB, tumor mutation burden; WES, whole exome sequencing. |
Association of hotspot mutations with TMB
TMB is defined as the number of somatic coding mutations per million bases. As the coding length of WES data is generally about 33 million bases, many mutations from different genes contribute to the calculation of TMB from WES. As shown above, some genes were frequently mutated in particular cancer types. However, the relationship of those hotspot mutations with TMB are still not well-understood. Here, we investigated whether hotspot somatic mutations might be associated with TMB in specific cancers.
Firstly, we defined hotspot mutations as highly frequent mutations found in at least ten samples in the complete set of cancer WES data (
 | Figure 3 (A) The volcano figure of the -log10 (P-value) and the log2 (fold-change) in the mutation-positive samples (samples with this mutation) and mutation-negative samples (samples without this mutation) for 150 hotspot mutations. (B) The number of samples with 15 typical hotspot mutations in different cancer types. Abbreviations: LUAD, lung adenocarcinoma; LUSC, lung squamous cell carcinoma ; BLCA, bladder urothelial carcinoma; COAD, colon adenocarcinoma; BRCA, breast invasive carcer; SKCM, skin cutaneous melanoma; STAD, stomach adenocarcinoma; KIRC, kidney renal papillary cell carcinoma; LIHC, liver hepatocellular carcinoma; GBM, glioblastoma multiforme; UCEC, uterine corpus endometrial carcinoma; OV, ovarian serous cystadenocarcinoma; PRAD, prostate adenocarcinoma; ESCA, esophageal carcinoma; PAAD, pancreatic adenocarcinoma. |
The impact of gene set on TMB estimation
Though WES is the best way to calculate TMB, gene panel sequencing has become increasingly popular and practical in routine molecular diagnostics. To demonstrate the capability of TMB estimation from gene panels, we carried out in silico TMB estimation for various panels using WES mutations from the public TCGA data-set. A total of 6,625 WES samples from the TCGA were filtered and analyzed in silico using the cancer-related gene panels F1CDx, MSK-IMPACT and F1CDX+MSK. TMB estimated from simulated F1CDx and MSK-IMPACT panels showed a high correlation to TMB estimated from WES, with R2 correlation values of 0.95 and 0.94, respectively, for total mutations (Figure 4A and B). However, for most cancer types, there were obvious differences observed between WES and the two panels (Figure 5). F1CDx, MSK-IMPACT and F1CDX+MSK had differences in R2 when correlating the data to WES, with F1CDX+MSK having the best R2, followed by MSK-IMPACT and F1CDx. Despite this, the TMB calculated from these three panels correlated with TMB calculated from WES in most cancer types. However, they did not perform well in some cancer types (ESCA, KIRC and PAAD.), particularly KIRC, with low R2 correlation values below 0.4. The results indicated that these three panels were only suitable for TMB calculations for a subset of cancer types. As the above three panels were not specially designed to calculate TMB values, we attempted to propose a pan-cancer TMB panel as described in Methods. Finally, 524 high-frequency mutated genes were selected (
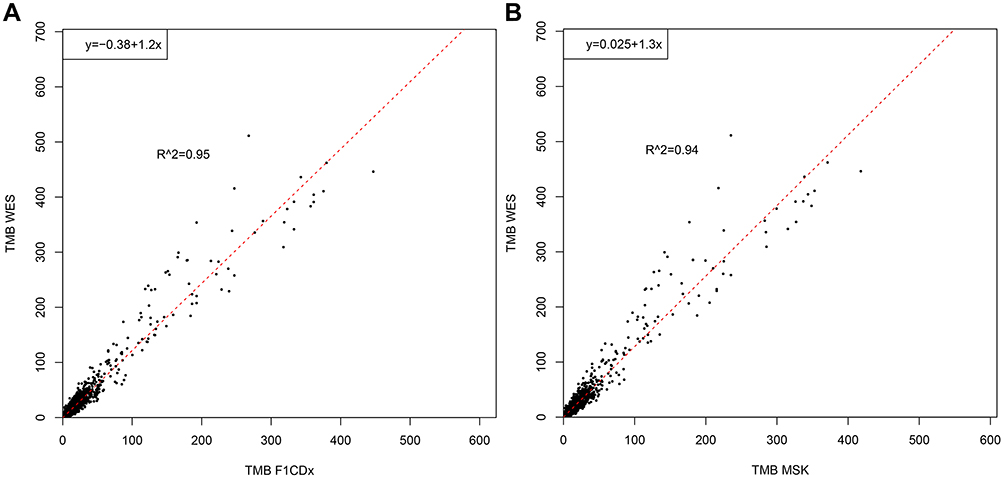 | Figure 4 The correlation of estimated TMB by two FDA-approved panels with WES. (A) F1CDx with WES (R2=0.95). (B) MSK-IMPACT with WES (R2=0.94). Abbreviations: TMB, tumor mutation burden; WES, whole exome sequencing. |
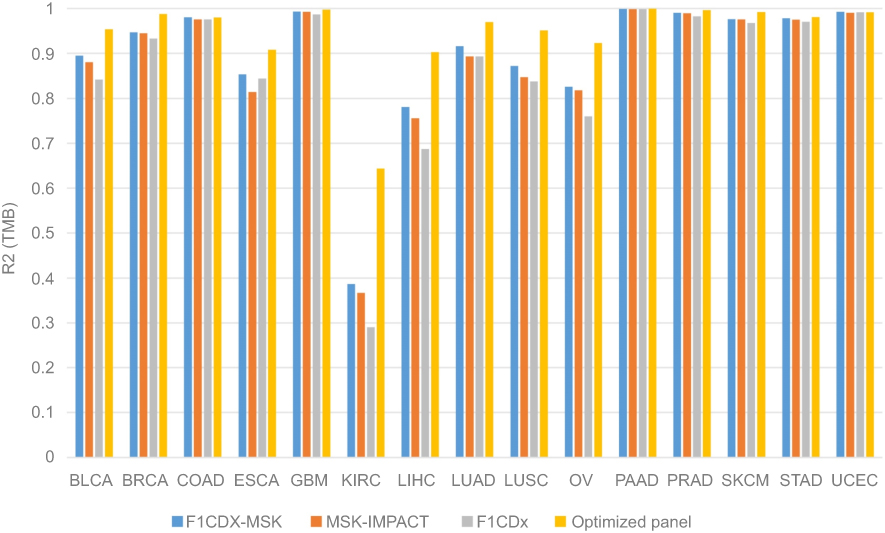 | Figure 5 Correlation analysis between panels (F1CDx, MSK-IMPACT, F1CDx-MSK and our optimized pan-cancer panel) and WES. Abbreviation: WES, whole exome sequencing. |
To avoid the problem of “over-fitting”, we further fitted linear regression models using approximately 80% of the samples to predict TMB values for the remaining 20% of samples for each cancer type. We assessed the correlation between the predicted and real TMB for the samples in the test data-set. Furthermore, 300, 400 or 500 genes were randomly selected five times and their average R2 values were compared (Figure 6). Similar to previous results, F1CDx, MSK-IMPACT and F1CDX+MSK performed well in some cancer types, like BLCA, COAD, SKCM, STAD and UCEC, while results were poorer in ESCA, KIRC and PAAD. Excitingly, using the pan-cancer TMB panel, the correlations improved tremendously in these cancer types. Besides, we found that randomly selected gene sets had little difference between F1CDx, MSK-IMPACT and F1CDX+MSK in almost all cancer types. In general, the pan-cancer TMB panel we proposed in this study had a higher correlation with WES for all cancer types.
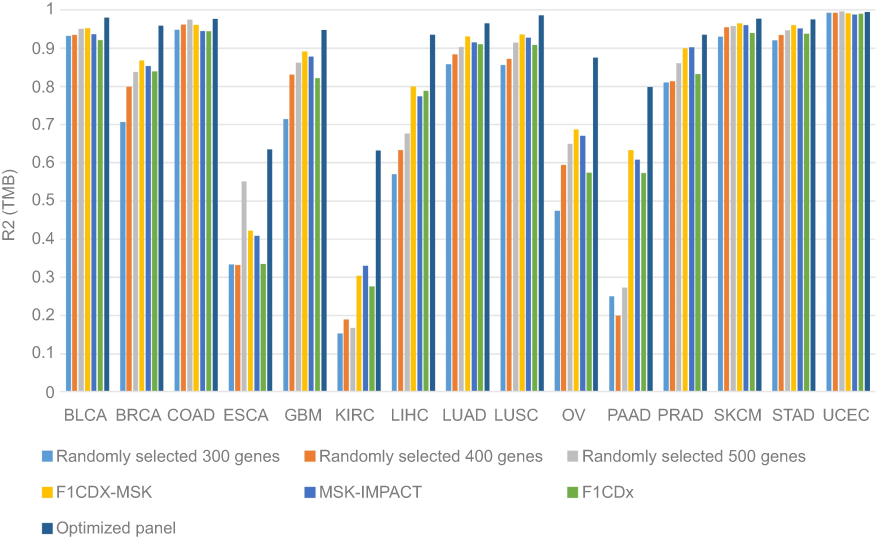 | Figure 6 Correlation analysis between the predicted TMB and the real TMB in different panels. Abbreviations: TMB, tumor mutation burden; LUAD, lung adenocarcinoma; LUSC, lung squamous cell carcinoma ; BLCA, bladder urothelial carcinoma; COAD, colon adenocarcinoma; BRCA, breast invasive carcer; SKCM, skin cutaneous melanoma; STAD, stomach adenocarcinoma; KIRC, kidney renal papillary cell carcinoma; LIHC, liver hepatocellular carcinoma; GBM, glioblastoma multiforme; UCEC, uterine corpus endometrial carcinoma; OV, ovarian serous cystadenocarcinoma; PRAD, prostate adenocarcinoma; ESCA, esophageal carcinoma; PAAD, pancreatic adenocarcinoma. |
Discussion
Here, we used somatic mutations identified from WES data from the TCGA data-set to investigate the TMB distribution level across 15 cancer types. Frequently mutated genes and hotspot mutations and their associations with TMB level were then systematically analyzed. However, determining TMB by WES is not feasible for larger patient cohorts in current clinical practice due to its high costs, substantial turn-around time and limited availability of fresh cancer tissue samples.26 Recent research efforts have demonstrated that targeted sequencing panels used routinely in the clinic may provide a reasonable estimate of TMB from only a few hundred genes of interest.11,21,27 Our study on the correlation between TMB calculated from WES and that of different panels systematically addresses the question of whether TMB estimated from panels is equivalent to TMB estimated using public WES data from TCGA.
Recently, many organizations have provided panel sequencing for cancer patients with solid tumors for the purpose of diagnosis, targeted therapy and prognosis. Generally, such panels consist of a few genes to a few hundred genes, depending on the clinical purpose. As new target drugs are approved by FDA and new guidelines from the National Comprehensive Cancer Network are released, panels should be updated with new target genes with actionable mutations. In the meantime, the development of an increasing number of immune checkpoint inhibitors requires a more accurate pan-cancer panel to estimate TMB and determine patient suitability for treatment. The pan-cancer TMB panel proposed here provides a reference data-set for gene selection in any TMB-oriented panel design. However, we still need more clinical data with immunotherapy response results to refine this pan-cancer TMB panel. We anticipate that these genes can be added into existing panels and are capable of estimating TMB to predict patient response to cancer immunotherapy.
Abbreviation List
BLCA, Bladder Urothelial Carcinoma; BRCA, Breast Invasive Carcinoma; COAD, Colon Adenocarcinoma; ESCA, Esophageal Carcinoma; GBM, Glioblastoma Multiforme; KIRC, Kidney Renal Clear Cell Carcinoma; LIHC, Liver Hepatocellular Carcinoma; LUAD, Lung Adenocarcinoma; LUSC, Lung Squamous Cell Carcinoma; OV, Ovarian Serous Cystadenocarcinoma; PAAD, Pancreatic Adenocarcinoma; PRAD, Prostate Adenocarcinoma; SKCM, Skin Cutaneous Melanoma; STAD, Stomach Adenocarcinoma; UCEC, Uterine Corpus Endometrial Carcinoma.
Acknowledgments
This work was financed by Grant-in-aid for scientific research from the Guangzhou Science and Technology Plan projects of China (No. 201802020004).
Disclosure
The authors report no conflicts of interest in this work.
References
1. Dirnhofer S. PD-1 inhibitors effective in Hodgkin lymphoma. Cancer Discov. 2015;5(2):102–103. doi:10.1158/2159-8290.CD-NB2015-002
2. Luke JJ, Flaherty KT, Ribas A, Long GV. Targeted agents and immunotherapies: optimizing outcomes in melanoma. Nat Rev Clin Oncol. 2017;14(8):463–482. doi:10.1038/nrclinonc.2017.43
3. Reck M, Rodríguez-Abreu D, Robinson AG, et al. Pembrolizumab versus chemotherapy for PD-L1-positive non-small-cell lung cancer. N Engl J Med. 2016;375(19):1823–1833. doi:10.1056/NEJMoa1606774
4. Ferris RL, Blumenschein G, Fayette J, et al. Nivolumab for recurrent squamous-cell carcinoma of the head and neck. N Engl J Med. 2016;375(19):1856–1867. doi:10.1056/NEJMoa1602252
5. Three drugs approved for urothelial carcinoma by FDA. Cancer Discov. 2017;7(7):659–660. doi:10.1158/2159-8290.CD-NB2017-071.
6. Le DT, Durham JN, Smith KN, et al. Mismatch-repair deficiency predicts response of solid tumors to PD-1 blockade. Science. 2017;357(6349):409–413. doi:10.1126/science.aan6733
7. Snyder A, Makarov V, Merghoub T, et al. Genetic basis for clinical response to CTLA-4 blockade in melanoma. N Engl J Med. 2014;372(8):2189–2199. doi:10.1056/NEJMoa1406498
8. Gettinger S, Horn L, Jackman D, et al. Five-year follow-up of nivolumab in previously treated advanced non–small-cell lung cancer: results from the CA209-003 study. J Clin Oncol. 2018;36(17):1675–1684. doi:10.1200/JCO.2017.77.0412
9. Yarchoan M, Hopkins A, Jaffee EM. Tumor mutational burden and response rate to PD-1 inhibition. N Engl J Med. 2017;377(25):2500. doi:10.1056/NEJMc1713444
10. Topalian SL, Taube JM, Anders RA, Pardoll DM. Mechanism-driven biomarkers to guide immune checkpoint blockade in cancer therapy. Nat Rev Cancer. 2016;16(5):275–287. doi:10.1038/nrc.2016.36
11. Chalmers ZR, Connelly CF, Fabrizio D, et al. Analysis of 100,000 human cancer genomes reveals the landscape of tumor mutational burden. Genome Med. 2017;9(1):34. doi:10.1186/s13073-017-0424-2
12. Turajlic S, Litchfield K, Xu H, et al. Insertion-and-deletion-derived tumour-specific neoantigens and the immunogenic phenotype: a pan-cancer analysis. Lancet Oncol. 2017;18(8):1009. doi:10.1016/S1470-2045(17)30072-4
13. Tunger A, Kießler M, Wehner R, et al. Immune monitoring of cancer patients prior to and during CTLA-4 or PD-1/PD-L1 inhibitor treatment. Biomedicines. 2018;6(1):26. doi:10.3390/biomedicines6010026
14. Iyer RR, Pluciennik A, Burdett V, Modrich PL. DNA mismatch repair: functions and mechanisms. Chem Rev. 2006;106(2):302–323. doi:10.1021/cr0404794
15. Dudley JC, Lin MT, Le DT, Eshleman JR. Microsatellite instability as a biomarker for PD-1 blockade. Clin Cancer Res. 2016;22(4):813. doi:10.1158/1078-0432.CCR-16-0190
16. Gridelli C, Ardizzoni A, Barberis M, et al. Predictive biomarkers of immunotherapy for non-small cell lung cancer: results from an experts panel meeting of the Italian association of thoracic oncology. Transl Lung Cancer Res. 2017;6(3):373–386. doi:10.21037/tlcr.2017.05.09
17. Rittmeyer A, Gandara D, Kowanetz M, et al. Blood-based biomarkers for cancer immunotherapy: tumor mutational burden in blood (bTMB) is associated with improved atezolizumab (atezo) efficacy in 2L+ NSCLC (POPLAR and OAK). -Annals of Oncology. 2017;28(S 5):v460–v496. doi:10.1093/annonc/mdx380.
18. Niu X, Lu S, Li H, et al. TGF{beta}1 gene polymorphisms with the risk of radiation pneumonitis in non-small cell lung cancer in different ethnic study. J Clin Oncol. 2011;29:10606–10606. doi:10.1200/jco.2011.29.15_suppl.10606
19. Elkhoueiry AB, Sangro B, Yau T, et al. Nivolumab in patients with advanced hepatocellular carcinoma (CheckMate 040): an open-label, non-comparative, phase 1/2 dose escalation and expansion trial. Lancet. 2017;389(10088):2492–2502. doi:10.1016/S0140-6736(17)31046-2
20. Antonia SJ, López-Martin JA, Bendell J, et al. Nivolumab alone and nivolumab plus ipilimumab in recurrent small-cell lung cancer (CheckMate 032): a multicentre, open-label, phase 1/2 trial. Lancet Oncol. 2016;17(7):883–895. doi:10.1016/S1470-2045(16)30098-5
21. Zehir A, Benayed R, Shah RH, et al. Mutational landscape of metastatic cancer revealed from prospective clinical sequencing of 10,000 patients. Nat Med. 2017;23(6):703–713. doi:10.1038/nm.4333
22. Felipe CL, Romualdo BS, Leandro J, et al. Comprehensive cancer-gene panels can be used to estimate mutational load and predict clinical benefit to PD-1 blockade in clinical practice. Oncotarget. 2015;6(33):34221–34227. doi:10.18632/oncotarget.5950
23. Goodman AM, Kato S, Bazhenova L, et al. Tumor mutational burden as an independent predictor of response to immunotherapy in diverse cancers. Mol Cancer Ther. 2017;16(11). molcanther.0386.2017. doi:10.1158/1535-7163.MCT-16-0589
24. Mayans O, Van Der Ven PF, Wilm M, et al. Structural basis for activation of the titin kinase domain during myofibrillogenesis. Nature. 1998;395(6705):863–869. doi:10.1038/27603
25. Yin BW, Lloyd KO. Molecular cloning of the CA125 ovarian cancer antigen: identification as a new mucin, MUC16. J Biol Chem. 2001;276(29):27371–27375. doi:10.1074/jbc.M103554200
26. Hellmann MD, Nathanson T, Rizvi H, et al. Genomic features of response to combination immunotherapy in patients with advanced non-small-cell lung cancer. Cancer Cell. 2018;33(5):843–852.e4. doi:10.1016/j.ccell.2018.03.018
27. Rizvi H, Sanchez-Vega F, Chatila W, et al. Molecular determinants of response to anti-programmed cell death (PD)-1 and anti-programmed death-ligand (PD-L)-ligand 1 blockade in patients with non-small-cell lung cancer profiled with targeted next-generation sequencing. J Clin Oncol. 2018;36(7):633–641. doi:10.1200/JCO.2017.75.3384
 © 2019 The Author(s). This work is published and licensed by Dove Medical Press Limited. The
full terms of this license are available at https://www.dovepress.com/terms
and incorporate the Creative Commons Attribution
- Non Commercial (unported, 3.0) License.
By accessing the work you hereby accept the Terms. Non-commercial uses of the work are permitted
without any further permission from Dove Medical Press Limited, provided the work is properly
attributed. For permission for commercial use of this work, please see paragraphs 4.2 and 5 of our Terms.
© 2019 The Author(s). This work is published and licensed by Dove Medical Press Limited. The
full terms of this license are available at https://www.dovepress.com/terms
and incorporate the Creative Commons Attribution
- Non Commercial (unported, 3.0) License.
By accessing the work you hereby accept the Terms. Non-commercial uses of the work are permitted
without any further permission from Dove Medical Press Limited, provided the work is properly
attributed. For permission for commercial use of this work, please see paragraphs 4.2 and 5 of our Terms.