")
Back to Journals » Clinical Optometry » Volume 11
Assessment of tear film in subjects with a high body mass index
Authors Alanazi SA
Received 2 June 2019
Accepted for publication 14 July 2019
Published 26 July 2019 Volume 2019:11 Pages 77—84
DOI https://doi.org/10.2147/OPTO.S218109
Checked for plagiarism Yes
Review by Single anonymous peer review
Peer reviewer comments 2
Editor who approved publication: Mr Simon Berry
Saud A Alanazi
Cornea Research Chair, Department of Optometry, College of Applied Medical Sciences, King Saud University, Riyadh, 11433, Saudi Arabia
Purpose: The aim of the study was to assess the tear film in subjects with a high body mass index (BMI).
Methods: Twenty male subjects aged 23–42 years (mean ± standard deviation =31.3±5.7 years) with a high BMI [median (interquartile range) =31.8 (5.2) kg/m2,] were recruited. An age-matched control group of twenty male subjects aged 22–38 years with a normal BMI [20.5 (2.8) kg/m2,] also participated in the study.
Results: There were significant (Kolmogorov-Smirnov test; P<0.05) differences in the BMI, non-invasive tear break-up time (NITBUT), and tear ferning (TF) scores between the study and control groups. There were some differences in the ocular surface disease index (OSDI), tear meniscus height (TMH), and phenol red thread (PRT) scores between the study and control groups, but these differences were not significant (Kolmogorov-Smirnov test; P>0.05). For the study group, the NITBUT and TF tests mean scores showed a dry eye condition (8.5±2.8 s and 2.0±1.1, respectively). However, these two tests showed a normal eye condition within the control group (14.7±2.8 s and 0.7±0.6, respectively). The TMH score had strong correlations with the NITBUT (r=0.711; P=0.001) and PRT scores (r=0.566; P=0.009) and strong negative correlations with age (r=–0.503; P=0.024) and the OSDI scores (r=–0.520; P=0.018). The TF score had a strong correlation with age (r=0.579; P=0.007) and strong negtive correlations with the scores from the NITBUT (r=–0.525; P=0.018), TMH (r=–0.575; P=0.008), and PRT (r=–0.773; P=0.001) tests.
Conclusion: The acquired data suggest a high BMI has an effect on the quality of tears. The quality of tears seems to be lower in subjects with a high BMI compared with normal subjects. On the other hand, the tear volume in subjects with a high BMI was just as high and adequate as for normal eye subjects.
Keywords: body mass index, tear film, dry eye, tear ferning test, correlation, tear meniscus height
Introduction
Ocular health is largely dependent on the tear film, as it acts as a surface in order to refract light entering the eye, as well as moisturizing, and protecting the cornea.1 A model has been proposed for the structure of the tear film that is composed of three phases, namely, the mucin, aqueous, and lipid layers.2 The mucin layer, secreted by goblet cells, covers the ocular surface and lowers epithelial cells’ hydrophobicity.3 The aqueous layer, secreted by the Krause and Wolfring glands, lubricates the cornea, provides the nutrients that are needed for the ocular surface, keeps the osmolarity balanced, and acts as an antimicrobial barrier against microorganism infections.3 The lipid layer, secreted by the meibomian glands, reduces the evaporation and overspill of tears.4 However, the structure, dynamics, and function of the tear film is very complex in reality.5 Tear film instability results in several vision problems where dry eye syndrome is common.6
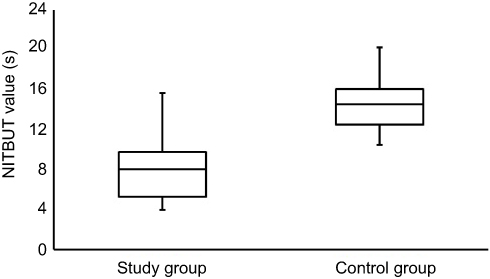 |
Figure 3 Side-by-side boxplots for the NITBUT scores within the study and control groups. Note: Statistically significant value at P<0.05.Abbreviation: NITBU, non-invasive tear break-up time. |
 |
Figure 4 Side-by-side boxplots for the TMH scores within the study and control groups. Abbreviation: TMH, tear meniscus height. |
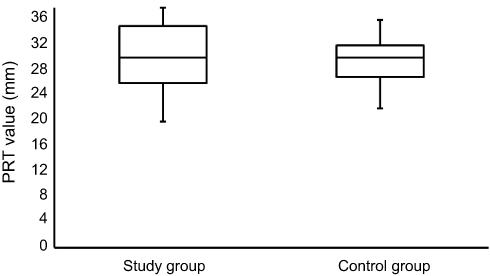 |
Figure 5 Side-by-side boxplots for the PRT scores within the study and control groups. Abbreviation: PRT, phenol red thread. |
Dry eye causes many uncomfortable symptoms that affect the quality of life of around 20% of the global population.7 Therefore, eye dryness has to be managed as early as possible.1 Dry eye symptoms are very common, mainly due to dysfunction of the meibomian gland.7 The main cause of dry eye symptoms is an alteration in either tear production or tear evaporation, or both. Several tests can be used to assess the tear film in terms of the volume and quality of tears. However, the correlations between these tests are very limited and a combination of several tests should be used to obtain more reliable results.8 Tear volume can be assessed by the use of phenol red thread (PRT),9 tear meniscus height (TMH),10 and tear evaporation rate11 tests, for example. On the other hand, the quality of tears can be assessed using non-invasive tear break-up time (NITBUT),12 tear ferning (TF),13 and osmolarity14 tests, for example. In addition, dry eye questionnaires (eg, the ocular surface disease index, OSDI) can be used as a useful, quick, and efficient tool to detect the discomfort associated with a dry eye condition.15
Obesity is becoming a major concern worldwide.16 Body mass index (BMI), which is the ratio between weight and height, can be used as a simple, efficient, and low-cost tool to measure fitness.17 A high BMI could be a risk factor for various disorders such as type-2 diabetes,18 coronary heart disease,19 hypertension,20 stroke,21 and premature mortality, as a result of sleep apnea.22 Several factors (eg, culture)23 are contributing to the increased level of obesity, leading to a general health issue. It is important to increase awareness about obesity and its association with various illnesses.24 In the current study, the link between dry eye symptoms and BMI was investigated using a combination of tests that can determine both the quality and quantity of tears. To the best of our knowledge, this study is the first to utilize the tear ferning test to assess the tear film within subjects having a BMI. Recently, various studies showed that TF tests along with other dry diagnostic tests can be used efficiently to assess the ocular tear film.25–29
Materials and methods
Subjects
Twenty male subjects aged 23–42 years (mean ± standard deviation =31.3±5.7 years) with a high BMI [median (interquartile range) =31.8 (5.2) kg/m2] were recruited. An age-matched control group of twenty male subjects aged 22–38 years (30.2±4.9 years) with a normal BMI [20.5 (2.8) kg/m2] also participated in the study. Subjects with thyroid disorders, a high cholesterol level (above 4 mmol/L), vitamin A and D deficiencies, hypertension, anaemia, diabetes, who were smokers, who a history of ocular surgery, and who wore contact lenses were excluded. The subjects were tested at King Khalid Hospital, Riyadh between 9:30 and 11:30 am by the same examiner. Ethical approval was obtained from the College of Applied Medical Science Ethics Committee, King Saud University, and the subjects were treated based on the Declaration of Helsinki.30 Written informed consent was obtained from each subject before conducting the study. The OSDI sheet was completed first, followed by the NITBUT, TMH, PRT, and TF tests. The tests were carried out on the right eye of each subject and a 10 min gap was allowed between the tests.
BMI
The subjects were classified based on their BMI scores as underweight (15–19.9 Kg/m2), normal weight (20–24.9 Kg/m2), overweight (25–29.9 Kg/m2), first class obese (30–34.9 Kg/m2), second class obese (35–39.9 Kg/m2), and third class obese (≥40).31
OSDI
The OSDI sheet was completed by every subject and a normal eye was defined for scores of less than 13.15
NITBUT test
The NITBUT test was performed on an OCULUS Keratograph® 4 (OCULUS Inc., Wetziar, Germany) using fluorescein. Each subject was asked to refrain from blinking while the tear film was being observed. The tear break-up time was recorded as the number of seconds that elapsed between the last blink and the appearance of the first dry spot on the tear film. A normal eye was defined as having a tear break-up time of more than 10 sec.32
TMH test
The TMH test was performed on an OCULUS Keratograph® 4 (OCULUS Inc., Wetziar, Germany). The inferior TMH images were captured and measured (mm) perpendicular to the lid margin at the central point relative to the pupil center. A normal eye was defined when the lower lid TMH was more than 0.2 mm.33
PRT test
Cotton thread (Zone-Quick, Showa Yakuhin Kako Co, Ltd., Tokyo, Japan) containing a pH indicator was used. A 3-mm portion of thread was folded and inserted one-third of the distance from the temporal canthus of the lower eyelid, with the eye in the primary position. After 15 seconds, the thread was removed and the red color portion was measured. A normal eye was defined if the length of the red color portion was more than 10 mm.9
TF test
A small tear sample (1 μL) was collected from the lower meniscus of the eye using a glass capillary tube (10 μL) purchased from Merck (Schnelldorf, Germany). The sample was dried for 10 min at 23 °C and a humidity of less than 40%. An Olympus DP72 digital microscope (Tokyo, Japan) was used to observe and capture the TF images (magnification power of 10×). The TF patterns were graded based on the five-point TF grading scale.34
Statistical analysis
The data were analyzed using version 22 of the SPSS software (IBM, Armonk, NY, USA). A Spearman correlation coefficient (r) was used to assess any association between the data. The correlations were defined as weak (r=0.10–0.29), medium (r=0.30–0.49), or strong (r=0.50–1.00).35 The study group comprised twenty male subjects (31.3±5.7 years) with a high BMI [31.8 (5.2) kg/m2]. The control group comprised twenty male subjects (30.2±4.9 years) with a normal BMI [20.5 (2.8) kg/m2]. The BMI data were not normally distributed (Kolmogorov-Smirnov test; P˂0.05), and the average was represented by the median (interquartile range). The data obtained from the OSDI sheet, and all of the dry eye tests, were normally distributed (Kolmogorov-Smirnov test; P>0.05) and the averages were represented by the mean ± standard deviation (SD).
Results
The average scores for the BMI, OSDI, NITBUT, TMH, PRT, and TF measurements for the study and control groups are shown in Table 1. There were significant (Kolmogorov-Smirnov test; P<0.05) differences in the BMI, NITBUT, and TF scores between the study and control groups. There were some differences in the OSDI, TMH, and PRT scores between the study and control groups, but the differences were not significant (Kolmogorov-Smirnov test; P>0.05). For the study group, the NITBUT and TF tests’ mean scores showed a dry eye condition (8.5±2.8 s and 2.0±1.1, respectively), while these two tests showed a normal eye condition within the control group (14.7±2.8 s and 0.7±0.6, respectively). The NITBUT and TF tests showed eye dryness in 75% (n=15) and 40% (n=8) of the study group subjects, respectively. For the study group, the average score for the OSDI test showed a normal eye condition in a majority of the subjects (n=19). In addition, the TMH and PRT scores showed a normal eye condition (0.21±0.08 and 29.8±5.3 mm, respectively). In fact, the PRT test showed a normal eye condition in every subject within the study group. Figure 1 shows representative TF images for some of the subjects from the study group. Side-by-side boxplots for the OSDI, NITBUT, TMH, PRT, and TF scores within the study and control groups are shown in Figures 2–6.
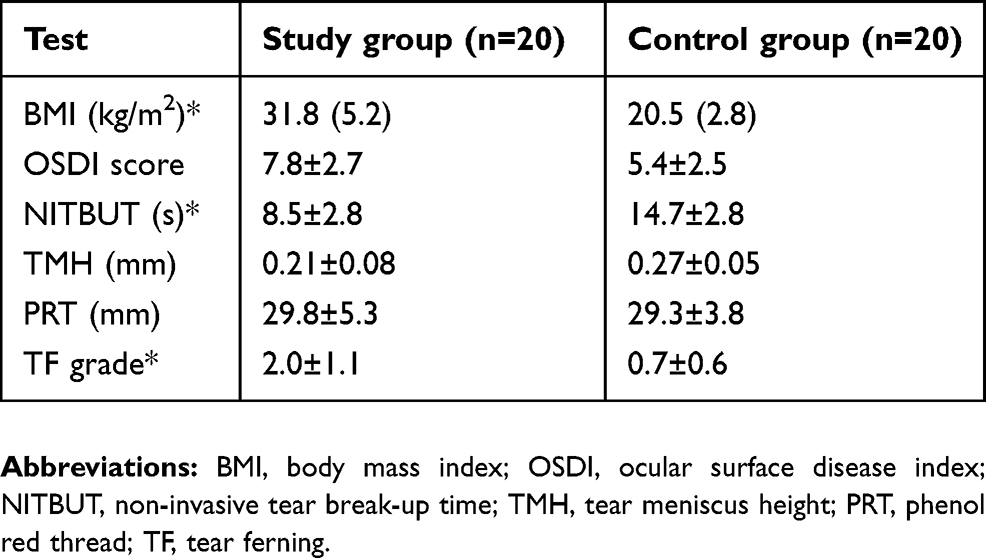 |
Table 1 Averages [mean ± standard deviation or medians (interquartile range)] for the OSDI, NITBUT, TMH, PRT, and TF measurements within the study and control groups |
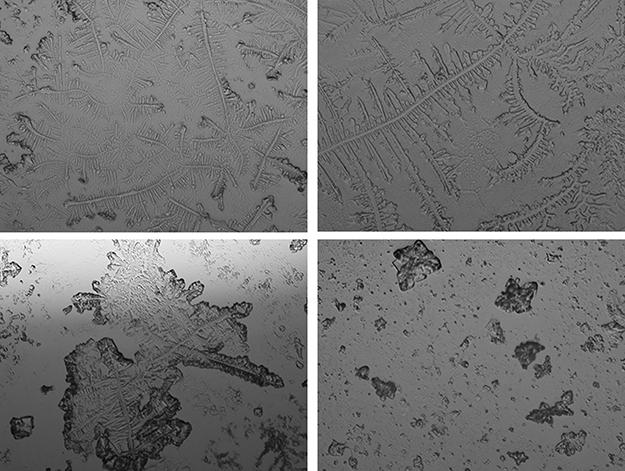 |
Figure 1 Representative TF images from the subjects within the study group. Abbreviation: TF, tear ferning. |
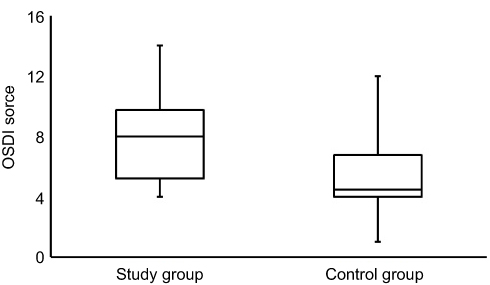 |
Figure 2 Side-by-side boxplots for the OSDI scores within the study and control groups. Abbreviation: OSDI, ocular surface disease index. |
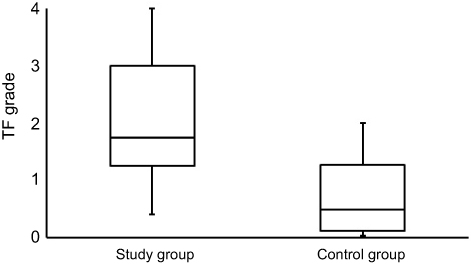 |
Figure 6 Side-by-side boxplots for the TF grades within the study and control groups. Note: Statistically significant value at P<0.05.Abbreviation: TF, tear ferning. |
The correlations (Mann–Whitney test; Pearson correlation coefficient, r) between age, BMI, the OSDI scores and those obtained from the dry eye tests within the study group are recorded in Table 2. The TMH score had strong correlations with the NITBUT (r=0.711; P=0.001) and PRT scores (r=0.566; P=0.009) and strong negative correlations with age (r=–0.503; P=0.024) and the OSDI scores (r=–0.520; P=0.018). The TF score had a strong correlation with age (r=0.579; P=0.007) and strong negtive correlations with the scores from the NITBUT (r=–0.525; P=0.018), TMH (r=–0.575; P=0.008), and PRT (r=–0.773; P=0.001) tests. The OSDI score had a strong correlation (r=0.522; P=0.018) with age and a medium negative correlation (r=–0.489; P=0.029) with the PRT score. No correlations were found between BMI and age, or the OSD, NITBUT, TMH, PRT, and TF scores.
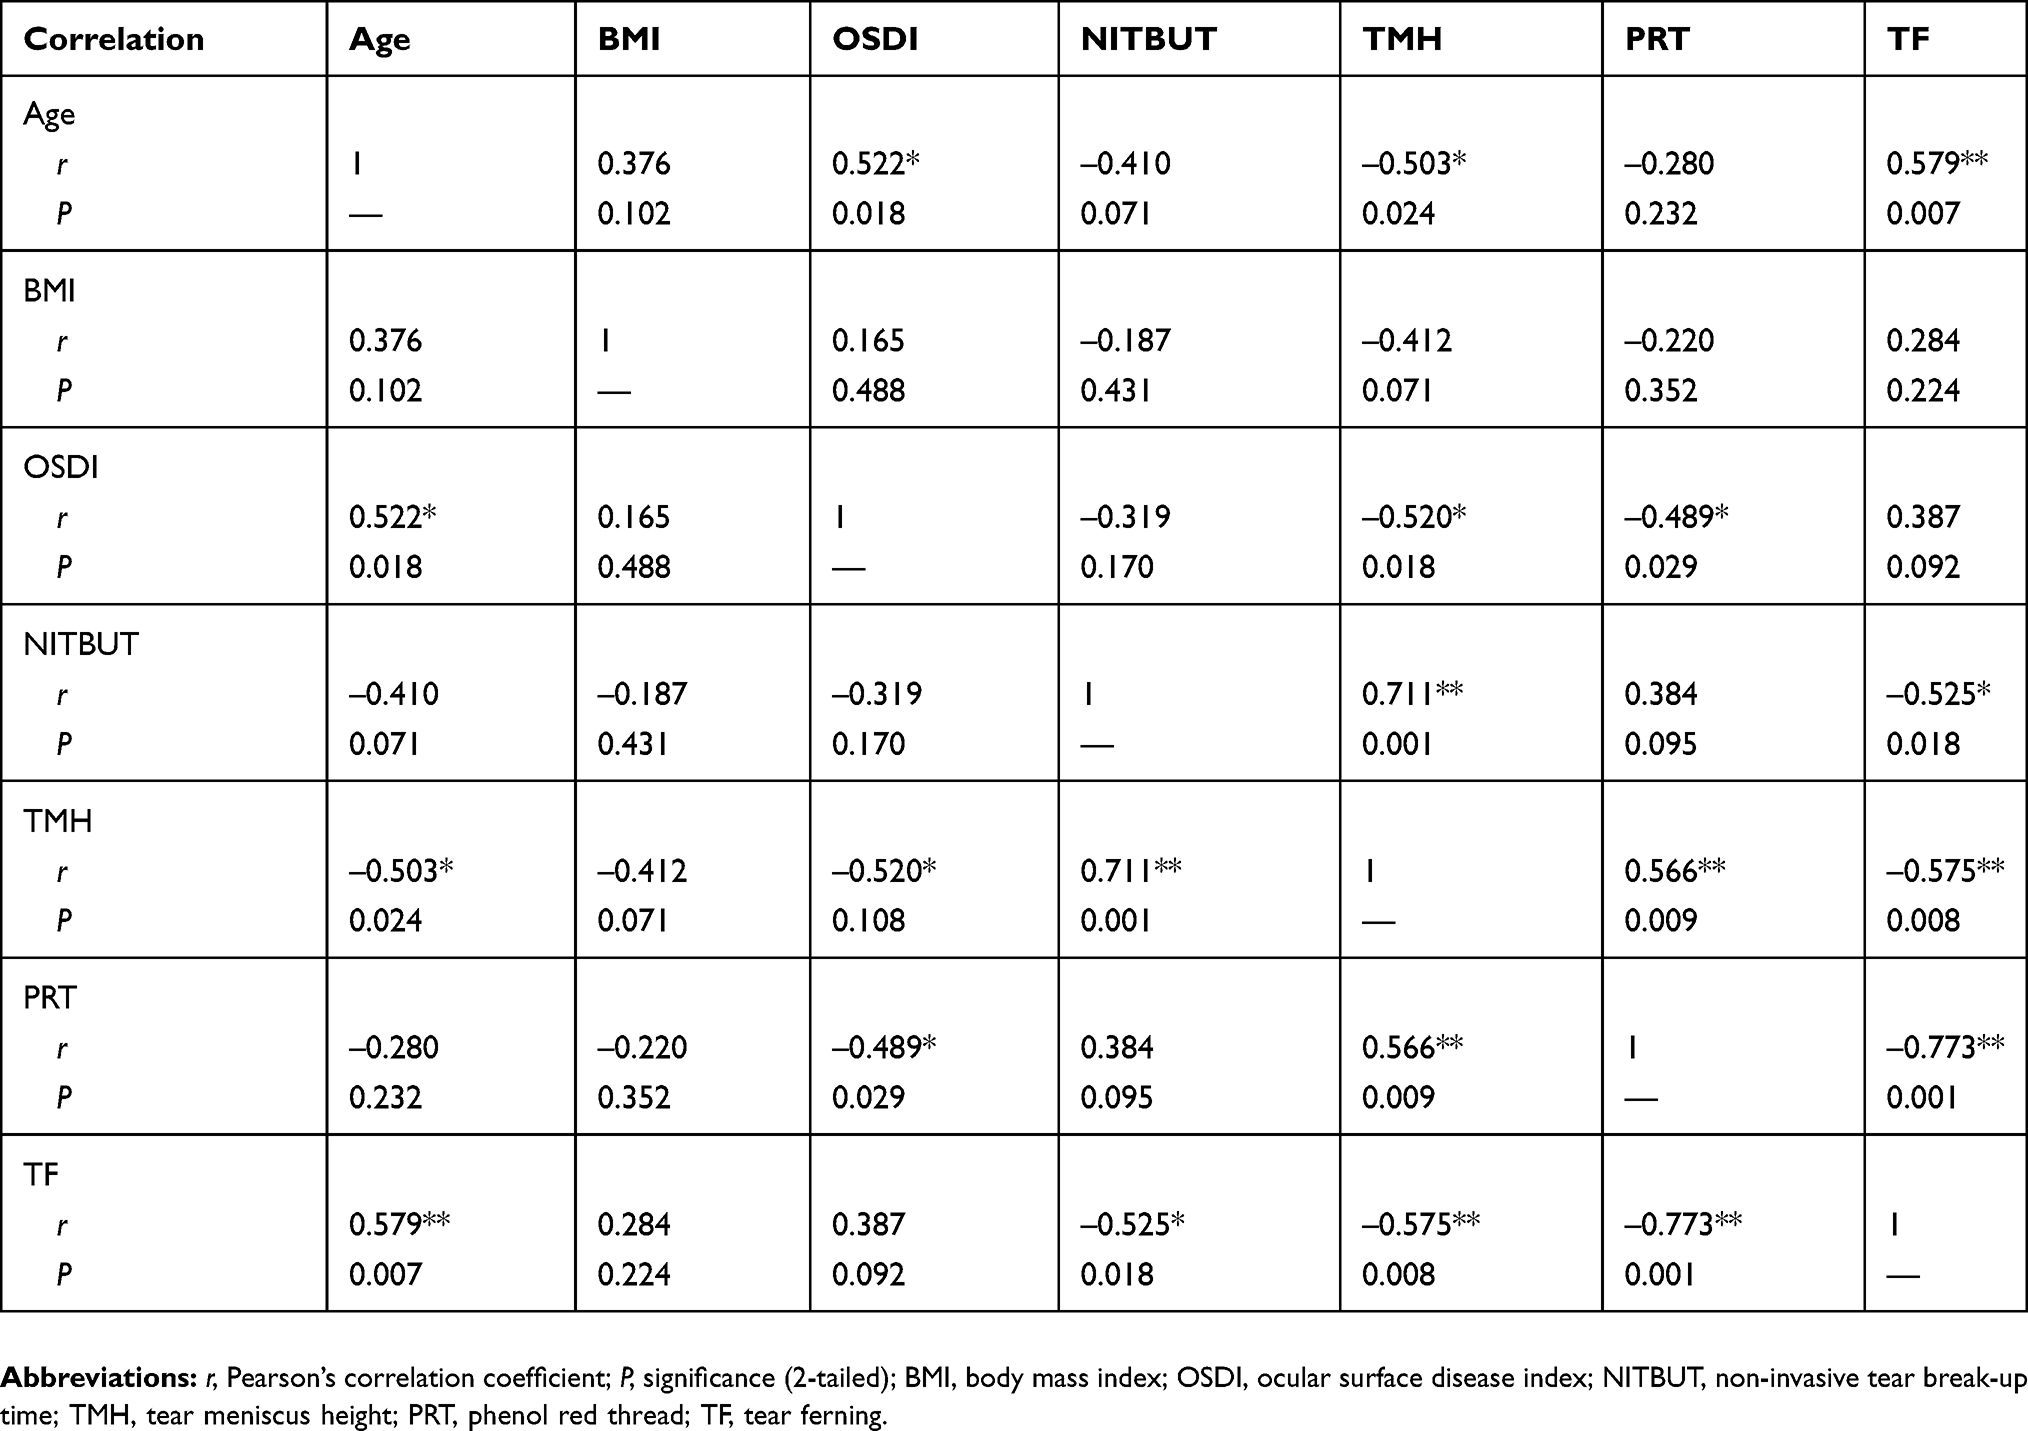 |
Table 2 The correlation between age, and the BMI, OSDI, NITBUT, TMH, PRT, and TF scores within the study group (n=20) |
Discussion
The increasing BMI in adults worldwide has become a pandemic, as excessive body weight is prevalent in a number of disorders and diseases. The number of deaths due to obesity is increasing, while both quality and duration of life are decreasing.36 Therefore, attention must be paid to reversing obesity in order to reduce the risk of life-threatening illnesses. The current study showed that subjects with a high BMI have a significantly lower tear quality compared with those obtained from normal eye subjects, as tested by the NITBUT and TF tests. On the other hand, lower but adequate tear volumes were observed in the study subjects compared with those obtained from the normal eye subjects using the TMH and PRT tests. In addition, the OSDI scores were higher for the study group compared to those recorded for the control group, but both indicated dry eye conditions. Several reports, including a case control and several cross-sectional studies, were conducted to test the link between BMI and dry eye syndrome based on dry eye questionnaires.37–41 Those studies showed that there was no association between dry eye symptoms and increased BMI. Dry eye symptoms were more prevalent in men with a low BMI, although a high BMI in women was a preventive factor.41 In the current study, the TF test was used for the first time to assess the tear film in subjects with a high BMI. The TF patterns reflect the chemical composition of tears and are very sensitive to any disturbance in tear film layers.
There was a significant increase in the level of serum triglycerides and total cholesterol in South Indian subjects (n=180) with a high BMI (≥25 kg/m2).42 A correlation between an increased incidence of cardiovascular disease and high BMI was reported as possibly being due to an increased atherogenic index.43,44 The atherogenic index in subjects with a high BMI was found to be related to hypertension, insulin resistance, dyslipidemia, and diabetes.45 An increased level of lipids in subjects with a high BMI could have led to excessive fat in the visceral adipocytes that release free fatty acids. As a result, triglycerides were synthesized and their levels in the blood increased.46
A study conducted on a large population (≥40 years) to test the association between mortality, BMI, and body fat percentage suggested that increased mortality is independently associated with a high body fat percentage and a low BMI.47 The relationship between BMI and low density lipoproteins has an inverted U shape. The level of low-density lipoproteins increases with BMI within a range of less than 27 kg/m2, and becomes steady or decreases above this level.48 The results were consistent among Spanish and US subjects, including black and white individuals. Metabolic impairment due to metabolic disorders or aging could have been the reasons for these results.48
A cross-sectional study conducted on 140 subjects indicated that insulin resistance has strong correlations with BMI, body weight, waist circumference, body fat percentage, and visceral fat level.49 Protein, carbohydrates, and fat are highly energetic nutrients. Excessive intake of these nutrients could lead to obesity and, therefore, a reduction in fat intake might have several health benefits. Strong associations were found between BMI and protein intake in women and carbohydrate intake in men.50 BMI is a non-invasive tool and should be used regularly to measure the body’s obesity to avoid the health complications that are associated with being overweight.
Limitation
There are some limitations associated with the current study. First, the small sample size; second, the inclusion of male subjects only; third, the environmental factors (eg, high temperature, extreme humidity, and strong sunlight) that the subjects might have experienced immediately before participating in the study were not taken in consideration. A more detailed study is still needed to take into account these limitations and to establish the link between a high BMI, eye dryness, and, in particular, the quality of tears.
Conclusion
The acquired data suggest a high BMI has an effect on the quality of tears. The quality of tears seemed to be lower in the subjects with a high BMI compared with the normal subjects. On the other hand, the tear volume in the subjects with a high BMI was as high and adequate as for the normal eye subjects.
Abbreviations
BMI, body mass index; OSDI, ocular surface disease index; NITBUT, non-invasive tear break-up time; TMH, tear meniscus height; PRT, phenol red thread; TF, tear ferning; IQR, interquartile range; SD, standard deviation; r, Spearman correlation coefficient.
Ethical approval and informed consent
Written informed consent was obtained from every subject prior to the commencement of the research and the subjects were treated based on the tenets of the Declaration of Helsinki.
Acknowledgment
This work was financially supported by the Deanship of Scientific Research, King Saud University, through the Vice Deanship of Scientific Research Chairs.
Disclosure
The author reports no conflicts of interest in this work.
References
1. Willcox MDP, Argüeso P, Georgiev GA, et al. TFOS DEWS II tear film report. Ocul Surf. 2017;15(3):366–403. doi:10.1016/j.jtos.2017.03.006
2. Wolff E. The muco-cutaneous junction of the lid margin and the distribution of the tear fluid. Trans Ophthalmol Soc UK. 1946;66:291–308.
3. King-Smith PE, Hinel EA, Nichols JJ. Application of a novel interferometric method to investigate the relation between lipid layer thickness and tear film thinning. Invest Ophthalmol Vis Sci. 2010;51(5):2418–2423. doi:10.1167/iovs.09-4387
4. Georgiev GA, Eftimov P, Yokoi N. Structure-function relationship of tear film lipid layer: a contemporary perspective. Exp Eye Res. 2017;163:17–28. doi:10.1016/j.exer.2017.03.013
5. King-Smith PE, Bailey MD, Braun RJ. Four characteristics and a model of an effective tear film lipid layer (TFLL). Ocul Surf. 2013;11(4):236–245. doi:10.1016/j.jtos.2013.05.003
6. de Monchy I, Gendron G, Miceli C, Pogorzalek N, Mariette X, Labetoulle M. Combination of the Schirmer I and phenol red thread tests as a rescue strategy for diagnosis of ocular dryness associated with Sjogren’s syndrome. Invest Ophthalmol Vis Sci. 2011;52(8):5167–5173. doi:10.1167/iovs.10-6671
7. Findlay Q, Reid K. Dry eye disease: when to treat and when to refer. Aust Prescr. 2018;41(5):160–163. doi:10.18773/austprescr.2018.048
8. Sullivan BD, Crews LA, Messmer EM, et al. Correlations between commonly used objective signs and symptoms for the diagnosis of dry eye disease: clinical implications. Acta Ophthalmol. 2014;92(2):161–166. doi:10.1111/aos.12012
9. Masmali A, Alqahtani TA, Alharbi A, El-Hiti GA. Comparative study of repeatability of phenol red thread test versus Schirmer’s test in normal adults in Saudi Arabia. Eye Contact Lens. 2014;40(3):127–131. doi:10.1097/ICL.0000000000000025
10. Ibrahim OM, Dogru M, Takano Y, et al. Application of Visante optical coherence tomography tear meniscus height measurement in the diagnosis of dry eye disease. Ophthalmology. 2010;117(10):1923–1929. doi:10.1016/j.ophtha.2010.01.057
11. Abusharaha A, Alturki AA, Alanazi SA, et al. An assessment of the tear evaporation rate in thyroid gland patients. Clin Ophthalmol. 2019;13:131–135. doi:10.2147/OPTH.S188614
12. Mzumara T, Afonne J. Assessing the relationship between non-invasive tear break-up time and maximum blink interval values among young adults at Mzuzu University. Clin Optom. 2018;10:87–91. doi:10.2147/OPTO.S164466
13. Masmali AM, Al-Qhtani S, Al-Gasham TM, El-Hiti GA, Purslow C, Murphy PJ. Application of a new grading scale for tear ferning in non-dry eye and dry eye subjects. Cont Lens Anterior Eye. 2015;38(1):39–43. doi:10.1016/j.clae.2014.09.007
14. Masmali A, Alrabiah S, Alharbi A, El-Hiti GA, Almubrad T. Investigation of tear osmolarity using the TearLab™ osmolarity system in normal adults in Saudi Arabia. Eye Contact Lens. 2014;40(2):74–78. doi:10.1097/ICL.0000000000000002
15. Schiffman RM, Christianson MD, Jacobsen G, Hirsch JD, Reis BL. Reliability and validity of the Ocular Surface Disease Index. Arch Ophthalmol. 2000;118(5):615–621. doi:10.1001/archopht.118.5.615
16. NCD Risk Factor Collaboration. Trends in adult body-mass index in 200 countries from 1975 to 2014: a pooled analysis of 1698 population-based measurement studies with 19·2 million participants. Lancet. 2016;387(10026):1377–1396. doi:10.1016/S0140-6736(16)30054-X
17. Flegal KM, Shepherd JA, Looker AC, et al. Comparisons of percentage body fat, body mass index, waist circumference, and waist-stature ratio in adults. Am J Clin Nutr. 2009;89(2):500–508. doi:10.3945/ajcn.2008.26847
18. Eriksson JG, Kajantie E, Lampl M, Osmond C. Trajectories of body mass index amongst children who develop type 2 diabetes as adults. J Intern Med. 2015;278(2):219–226. doi:10.1111/joim.12354
19. Bibbins-Domingo K, Coxson P, Pletcher MJ, Lightwood J, Goldman L. Adolescent overweight and future adult coronary heart disease. N Engl J Med. 2007;357(23):2371–2379. doi:10.1056/NEJMsa073166
20. Nissinen A, Kastarinen M, Tuomilehto J. Community control of hypertension- experiences from Finland. J Hum Hypertens. 2004;18(8):553–556. doi:10.1038/sj.jhh.1001696
21. Kurth T, Gaziano JM, Berger K, et al. Body mass index and the risk of stroke in men. Arch Intern Med. 2002;162(22):2557–2562. doi:10.1001/archinte.162.22.2557
22. Tirosh A, Shai I, Afek A, et al. Adolescent BMI trajectory and risk of diabetes versus coronary disease. Surv Anesthesiol. 2011;55(6):296–297. doi:10.1097/01.SA.0000407026.86152.a1
23. Alasmari HD, Al-Shehri AD, Aljuaid TA, Alzaidi BA, Alswat KA. Relationship between body mass index and obesity awareness in school students. J Clin Med Res. 2017;9(6):520–524. doi:10.14740/jocmr2987w
24. Bocquier A, Verger P, Basdevant A, et al. Overweight and obesity: knowledge, attitudes, and practices of general practitioners in France. Obes Res. 2005;13(4):787–795. doi:10.1038/oby.2005.89
25. Alanazi SA, Alomran AA, Abusharha A, et al. An assessment of the ocular tear film in patients with thyroid disorders. Clin Ophthalmol. 2019;Volume 13(in press):1019–1026. doi:10.2147/OPTH.S210044
26. Masmali AM, Alotaibi AG, Alanazi SA, Fagehi R, Abusharaha A, El-Hiti GA. The acute effect of a single dose of green tea on the quality and quantity of tears in normal eye subjects. Clin Ophthalmol. 2019;13:605–610. doi:10.2147/OPTH.S201127
27. Alanazi SA, El-Hiti GA, Al-Baloud AA, et al. Effects of short-term oral vitamin A supplementation on the ocular tear film in patients with dry eye. Clin Ophthalmol. 2019;13:599–604. doi:10.2147/OPTH.S198349
28. Masmali AM, Alanazi SA, Almagren B, El-Hiti GA. Assessment of the tear film in normal eye subjects after consumption of a single dose of hot peppermint drink. Clin Optom. 2019;11:39–45. doi:10.2147/OPTO.S206904
29. Masmali AM, Al-Shehri A, Alanazi SA, Abusharaha A, Fagehi R, El-Hiti GA. Assessment of tear film quality among smokers using tear ferning patterns. J Ophthalmol. 2016;2016:8154315. doi:10.1155/2016/8154315
30. World Medical Association Declaration of Helsinki: ethical principles for medical research involving human subjects. JAMA. 2013;310(20):2191–2194. doi:10.1001/jama.2013.281053
31. Nuttall FQ. Body mass index. Obesity, BMI, and health: a critical review. Nutr Today. 2015;50(3):117–128. doi:10.1097/NT.0000000000000092
32. Jones SM, Nischal KK. The non-invasive tear film break-up time in normal children. Br J Ophthalmol. 2013;97(9):1129–1133. doi:10.1136/bjophthalmol-2013-303236
33. Koh S, Ikeda C, Watanabe S, et al. Effect of non-invasive tear stability assessment on tear meniscus height. Acta Ophthalmol. 2015;93(2):e135–139. doi:10.1111/aos.12516
34. Masmali AM, Murphy PJ, Purslow C. Development of a new grading scale for tear ferning. Cont Lens Anterior Eye. 2014;37(3):178–184. doi:10.1016/j.clae.2013.09.011
35. Cohen JW. Statistical Power Analysis for the Behavioral Sciences. Hillsdale (NJ): Lawrence Erlbaum Associates; 1988.
36. Knight JA. Diseases and disorders associated with excess body weight. Ann Clin Lab Sci. 2011;41(2):107–121.
37. Tang YL, Cheng YL, Ren YP, Yu XN, Shentu XC. Metabolic syndrome risk factors and dry eye syndrome: a meta-analysis. Int J Ophthalmol. 2016;9(7):1038–1045. doi:10.18240/ijo.2016.07.17
38. Yang WJ, Yang YN, Cao J, et al. Risk factors for dry eye syndrome: a retrospective case-control study. Optom Vis Sci. 2015;92(9):e199–205. doi:10.1097/OPX.0000000000000541
39. Ahn JM, Lee SH, Rim TH, et al.; Epidemiologic Survey Committee of the Korean Ophthalmological Society. Prevalence of and risk factors associated with dry eye: the Korea National Health and Nutrition Examination Survey 2010–2011. Am J Ophthalmol. 2014;158(6):1205–1214.e7. doi:10.1016/j.ajo.2014.08.021
40. Malet F, Le Goff M, Colin J, et al. Dry eye disease in French elderly subjects: the Alienor Study. Acta Ophthalmol. 2014;92(6):e429–436. doi:10.1111/aos.12174
41. Uchino M, Nishiwaki Y, Michikawa T, et al. Prevalence and risk factors of dry eye disease in Japan: Koumi study. Ophthalmology. 2011;118(12):2361–2367. doi:10.1016/j.ophtha.2011.05.029
42. Gayathri B, Vinodhini VM. Correlation of lipids and lipoprotein concentration with body mass index in obese, overweight and normal weight south Indian adults. Int J Res Med Sci. 2017;5(11):4803–4807. doi:10.18203/2320-6012.ijrms20174923
43. Bertsias G, Mammas I, Linardakis M, Kafatos A. Overweight and obesity in relation to cardiovascular disease risk factors among medical students in Crete, Greece. BMC Public Health. 2003;3:3. doi:10.1186/1471-2458-3-3
44. Kazemi T, Hajihosseini M, Moossavi M, Hemmati M, Ziaee M. Cardiovascular Risk Factors and Atherogenic Indices in an Iranian Population: birjand East of Iran. Clin Med Insights Cardiol. 2018;12:1179546818759286. doi:10.1177/1179546818759286
45. Uusitupa M, Siitonen O, Voutilainen E, et al. Serum lipids and lipoproteins in newly diagnosed non-insulin-dependent (type II) diabetic patients, with special reference to factors influencing HDL cholesterol and triglyceride levels. Diab Care. 1986;9(1):17–22. doi:10.2337/diacare.9.1.17
46. Bays H. Atherogenic dyslipidemia in type 2 diabetes and metabolic syndrome: current and future treatment options. Br J Diabetes Vas Dis. 2003;3:356–360. doi:10.1177/14746514030030050801
47. Padwal R, Leslie WD, Lix LM, Majumdar SR. Relationship among body fat percentage, body mass index, and all-cause mortality: a cohort study. Ann Intern Med. 2016;164(8):532–541. doi:10.7326/M15-1181
48. Laclaustra M, Lopez-Garcia E, Civeira F, et al. LDL Cholesterol rises with BMI only in lean individuals: cross-sectional U.S. and Spanish representative data. Diabetes Care. 2018;41(10):2195–2201. doi:10.2337/dc18-0372
49. Kurniawan LB, Bahrun U, Hatta M, Arif M. Body mass, total body fat percentage, and visceral fat level predict insulin resistance better than waist circumference and body mass index in healthy young male adults in Indonesia. J Clin Med. 2018;7(5):96. doi:10.3390/jcm7050096
50. Schröder H, Marrugat J, Elosua R, Covas MI; REGICOR Investigators. Relationship between body mass index, serum cholesterol, leisure-time physical activity, and diet in a Mediterranean Southern-Europe population. Br J Nutr. 2003;90(2):431–439. doi:10.1079/BJN2003899
 © 2019 The Author(s). This work is published and licensed by Dove Medical Press Limited. The full terms of this license are available at https://www.dovepress.com/terms.php and incorporate the Creative Commons Attribution - Non Commercial (unported, v3.0) License.
By accessing the work you hereby accept the Terms. Non-commercial uses of the work are permitted without any further permission from Dove Medical Press Limited, provided the work is properly attributed. For permission for commercial use of this work, please see paragraphs 4.2 and 5 of our Terms.
© 2019 The Author(s). This work is published and licensed by Dove Medical Press Limited. The full terms of this license are available at https://www.dovepress.com/terms.php and incorporate the Creative Commons Attribution - Non Commercial (unported, v3.0) License.
By accessing the work you hereby accept the Terms. Non-commercial uses of the work are permitted without any further permission from Dove Medical Press Limited, provided the work is properly attributed. For permission for commercial use of this work, please see paragraphs 4.2 and 5 of our Terms.