Back to Journals » Clinical Interventions in Aging » Volume 12
Assessment of renal function in geriatric palliative care patients – comparison of creatinine-based estimation equations
Authors Deskur-Smielecka E, Kotlinska-Lemieszek A ![]() , Chudek J
, Chudek J ![]() , Wieczorowska-Tobis K
, Wieczorowska-Tobis K ![]()
Received 18 December 2016
Accepted for publication 12 April 2017
Published 23 June 2017 Volume 2017:12 Pages 977—983
DOI https://doi.org/10.2147/CIA.S130583
Checked for plagiarism Yes
Review by Single anonymous peer review
Peer reviewer comments 2
Editor who approved publication: Dr Richard Walker
Ewa Deskur-Smielecka,1,2 Aleksandra Kotlinska-Lemieszek,1,2 Jerzy Chudek,3,4 Katarzyna Wieczorowska-Tobis1,2
1Department of Palliative Medicine, Poznan University of Medical Sciences, 2Palliative Medicine Unit, University Hospital of Lord’s Transfiguration, Poznan, 3Pathophysiology Unit, Department of Pathophysiology, 4Department of Internal Medicine and Oncological Chemotherapy, Medical Faculty in Katowice, Medical University of Silesia, Katowice, Poland
Background: Renal function impairment is common in geriatric palliative care patients. Accurate assessment of renal function is necessary for appropriate drug dosage. Several equations are used to estimate kidney function.
Aims: 1) To investigate the differences (Δ) in kidney function assessed with simplified Modification of Diet in Renal Disease (MDRD), Berlin Initiative Study (BIS1), and Cockcroft–Gault (C-G) formulas in geriatric palliative care patients, and 2) to assess factors that may influence these differences.
Methods: A retrospective analysis of data of patients aged ≥70 years admitted to a palliative care in-patient unit. The agreement between C-G, MDRD, and BIS1 equations was assessed with Bland–Altman analysis. Partial correlation analysis was used to analyze factors influencing the discordance.
Results: A total of 174 patients (67 men; mean age 77.9±5.8 years) were enrolled. The mean Δ MDRD and C-G was 18.6 (95% limits of agreement 55.3 and -18.2). The mean Δ BIS1 and C-G was 6.1 (25.7 and -13.5), and the mean Δ MDRD and BIS1 was 12.5 (40.6 and -15.6). According to the National Kidney Foundation classification, 61 (35.1%) patients were differently staged using MDRD and C-G, while ~20% of patients were differently staged with BIS1 and C-G and MDRD and BIS1. Serum creatinine (SCr) and body mass index (BMI) had the most important influence on variability of Δ MDRD and C-G (partial R2 37.7% and 28.4%). Variability of Δ BIS1 and C-G was mostly influenced by BMI (34.8%) and variability of Δ MDRD and BIS1 by SCr (42.2%). Age had relatively low influence on differences between equations (3.1%–9.5%).
Conclusion: There is a considerable disagreement between renal function estimation formulas, especially MDRD and C-G in geriatric palliative care patients, which may lead to errors in drug dosage adjustment. The magnitude of discrepancy increases with lower SCr, lower BMI, and higher age.
Keywords: creatinine clearance, estimated glomerular filtration rate, MDRD, BIS1, Cockcroft-Gault
A Letter to the Editor has been received and published for this article.
Introduction
Renal function impairment is a common pathology in cancer patients.1–3 In subjects with advanced disease, its prevalence may reach 35%–52%, depending on the method of assessment.4 As kidney function is known to deteriorate with age, the prevalence of renal impairment in geriatric patients with advanced cancer should be expected to be particularly high. Data from population studies indicate that almost every other subject >70 years has chronic kidney disease (CKD),5–7 so it may be undoubtedly assumed that most geriatric patients with advanced cancer have compromised renal function.
Accurate assessment of renal function is an important issue in palliative care, as it determines appropriate drug dosage adjustment. Multiple anti-cancer agents and drugs used to control symptoms, or their active metabolites, are excreted by the kidneys and may accumulate when renal function is impaired, resulting in increased risk of dose-dependent adverse drug reactions. The list of drugs used in symptomatic treatment that require dosage modification based on the degree of renal dysfunction comprise most opioids (including morphine, oxycodon, fentanyl, tramadol, codeine, and dihydrocodeine) and benzodiazepines, gabapentin, pregabalin, duloxetine, baclofen, haloperidol, risperidone, levomepromazine, metoclopramide, and tranexamic acid.8,9 Special attention should be paid to drugs having nephrotoxic properties, such as nonsteroidal anti-inflammatory drugs, bisphosphonates, allopurinol, cyclosporine, and aminoglicosides.8,9
Glomerular filtration rate (GFR) is regarded to be the most accurate measure of kidney function. As direct measurement of GFR is not easy in clinical practice because of complex methodology and costs, several estimation equations have been developed. While most manufacturers’ recommendations on drug dosage adjustment were developed based on creatinine clearance (CrCl) calculated with the Cockcroft–Gault equation (C-G),10 the simplified Modification of Diet in Renal Disease (MDRD) formula11 is currently the most popular method to evaluate GFR and kidney function in clinical practice. Importantly, neither C-G nor MDRD was developed in a population of geriatric subjects, and their reliability in estimating GFR in the elderly is being questioned.12,13 More recently, a new formula has been developed and validated in a population-based cohort study of subjects >70 years (the Berlin Initiative Study [BIS1]).14–16
The aim of this study was to investigate the differences in the kidney function assessed with MDRD, BIS1, and C-G formulas in a population of in-hospital palliative care patients >70 years of age. Additionally, we analyzed factors that may influence the magnitude of discrepancy between these equations.
Methods
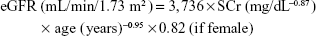
We retrospectively analyzed medical records of patients aged ≥70 years admitted to the Palliative Care In-patient Unit of the University Hospital of Lord’s Transfiguration in Poznan, Poland, in years 2013 and 2014. We excluded subjects in whom serum creatinine (SCr) levels were not assessed, in whom body weight or height was not measured, and patients with end-stage renal disease who required dialysis. If a patient was admitted more than once, data on consecutive hospitalizations were excluded from further analysis. Anthropometric characteristics, diagnosis, performance status (Karnofsky performance status [KPS] and Eastern Cooperative Oncology Group [ECOG]), and SCr levels were collected. Body mass indexes (BMIs) were categorized according to World Health Organization classification:17 underweight patients, BMI <18.5 kg/m2; normal-weight patients, BMI 18.5–24.9 kg/m2; overweight patients, BMI 25–29.9 kg/m2; obese patients, BMI ≥30 kg/m2. SCr was measured with the Jaffe reaction using alkaline picrate (Dimension EXL with LM; Siemens AG, Munich, Germany). The assay was calibrated with a method traceable to isotope dilution mass spectrometry (IDMS). The upper limit of the SCr at the hospital central laboratory was 115 μmol/L. Kidney function was assessed with creatinine clearance calculated using the C-G formula10 and estimated glomerular filtration rate (eGFR) calculated using the simplified MDRD11 and the BIS1 equations.14
C-G formula:
|
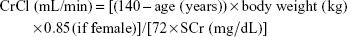
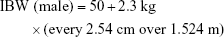
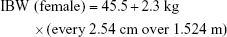
In order to improve accuracy, adjustments for the C-G equation based on BMI were used: in underweight patients, total body weight (TBW) was used; in subjects with normal weight, ideal body weight (IBW) was used; in overweight or obese patients, adjusted body weight (ABW) was used.18
|
|
|

Simplified, re-expressed MDRD formula:
|
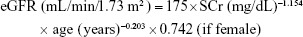
BIS1 formula:
|
Renal function calculated with all equations was staged using the National Kidney Foundation classification.19
The study protocol was approved by the ethical committee of Poznan University of Medical Sciences. Patients’ data were anonymized to ensure confidentiality.
Statistical analysis
Continuous data are shown as mean ± standard deviation and discrete variables as median (lower quartile, upper quartile). Statistical analyses were performed with StatSoft Statistica v12 and PQStat software. The normal distribution of the data was verified with Shapiro–Wilk test. Comparisons between two groups were performed with Student’s t-test or Mann–Whitney test (if appropriate). The agreement between C-G, MDRD, and BIS1 equations was assessed with the Bland–Altman plots using the 95% limits of agreement that are calculated as the average difference ± 2 standard deviation (SD).20,21 To assess factors that may influence the discordance between kidney function estimates, we used Spearman’s correlation and partial correlation analysis between the variables of interest and the difference (Δ) between the estimation equations. P-value <0.05 was considered significant.
Results
We identified 174 subjects (67 men/107 women) eligible for analysis. All subjects were White, and their mean age was 77.9±5.8 years. Patients’ characteristics and data on estimates of renal function obtained with C-G, MDRD, and BIS1 formulas are shown in Table 1. The parameters did not differ significantly between men and women, with the exception of SCr levels (P<0.01). MDRD-derived GFR was significantly higher than C-G and BIS1 GFR estimations, and BIS1 was higher than C-G (P<0.01 for all comparisons).
 | Table 1 Anthropometric characteristics, performance status, and estimates of renal function obtained with C-G, the MDRD, and the BIS1 equations |
Among the study population, 99 (56.9%) patients had normal weight, 24 (13.8%) subjects were underweight, 36 (20.7%) overweight, and 15 (8.6%) obese. The primary diagnoses included gastrointestinal tract cancer – 59 patients (33.9%), urogenital cancer – 37 patients (21.3%), respiratory tract cancer – 25 patients (14.4%), breast cancer – 17 patients (9.8%), other cancer – 35 patients (20.1%), and one subject had no malignancy (0.5%).
The Bland–Altman plots in Figure 1 show comparisons of kidney function estimates with C-G, MDRD, and BIS1 equations. The mean difference between C-G and MDRD estimates was 18.56 mL/min/1.73 m2, and 95% limits of agreement were 55.30 and −18.17 mL/min/1.73 m2. For comparisons between C-G and BIS1 estimates, the mean difference was only 6.09 mL/min/1.73 m2, and 95% limits of agreement were 25.69 and −13.50 mL/min/1.73 m2. The mean difference between BIS1 and MDRD was 12.47 mL/min/1.73 m2, and 95% limits of agreement were 40.56 and −15.62 mL/min/1.73 m2.
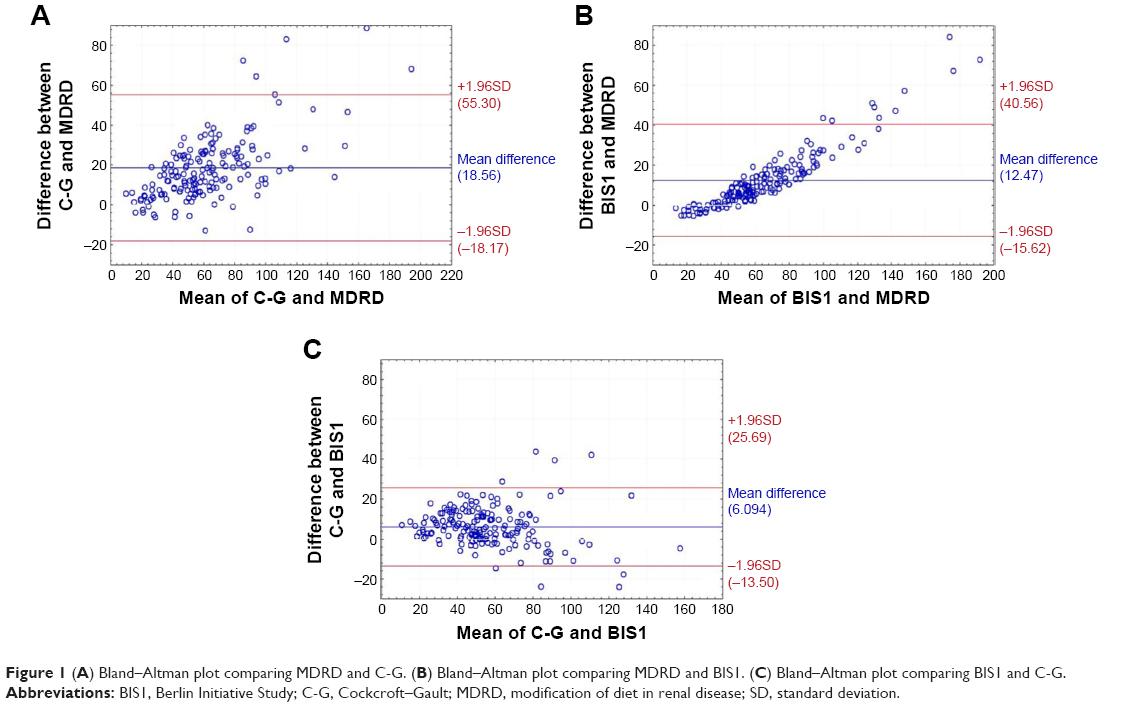 | Figure 1 (A) Bland–Altman plot comparing MDRD and C-G. (B) Bland–Altman plot comparing MDRD and BIS1. (C) Bland–Altman plot comparing BIS1 and C-G. |
As MDRD is less accurate for higher values of GFR, we separately analyzed the subgroup of patients with MDRD-derived GFR <60 mL/min/1.73 m2 (n=74; plots not shown). In this subgroup, the mean difference between C-G and MDRD was 8.32 mL/min/1.73 m2, and 95% limits of agreement were 24.83 and −8.19 mL/min/1.73 m2. The mean difference between BIS1 and MDRD was 2.47 mL/min/1.73 m2, with 95% limits of agreement 11.30 and −6.35.
Staging of kidney disease using the National Kidney Foundation classification based on C-G-, MDRD-, and BIS1-derived eGFR is shown in Table 2. Stages I and II were analyzed as one category (eGFR ≥60 mL/min/1.73 m2), because of lower accuracy of MDRD for higher values of eGFR and limited clinical importance of discrimination between stages I and II. Staging based on C-G- and MDRD-derived eGFR was consistent in 113 (64.9%) patients. Staging with C-G and BIS1 was consistent in 138 (79.3%) subjects, while staging with MDRD and BIS1 was consistent in 141 (81.0%) patients. Comparative analysis between men and women showed that Δ C-G and BIS1 was significantly lower in men (2.7±9.08 vs 8.2±9.48, P<0.01), while Δ BIS1 and MDRD tended to be higher in men (14.0±12.75 vs 11.5±15.22, P=0.05). No significant differences were found for Δ C-G and MDRD (16.7±15.27 in men, 19.7±20.61 in women; P=not significant).
 | Table 2 Agreement in classification of CKD (according to the National Kidney Foundation: stages I and II – eGFR ≥60 mL/min/1.73 m2; stage III – 30–59 mL/min/1.73 m2; stage IV – 15–29 mL/min/1.73 m2; stage V – <15 mL/min/1.73 m2) between C-G creatinine clearance and eGFR calculated with MDRD equation and BIS1 equation in 174 patients |
Spearman’s rank correlation coefficients, partial correlation coefficients, and coefficients of partial determination are shown in Table 3. The difference between C-G and MDRD, as well as between BIS1 and MDRD, correlated significantly with age, SCr level, and BMI. The difference between C-G and BIS1 correlated significantly with age and BMI but not with SCr level. Partial correlation analysis demonstrated that SCr level and BMI had the most important influence on variability of Δ C-G and MDRD. BMI had the most important influence on variability of Δ C-G and BIS1 and SCr level on variability of Δ BIS1 and MDRD. The proportion of variability in difference between GFR estimation equation that can be determined from the relationship with age was relatively low for all comparisons (partial R2 3.1%–9.5%).
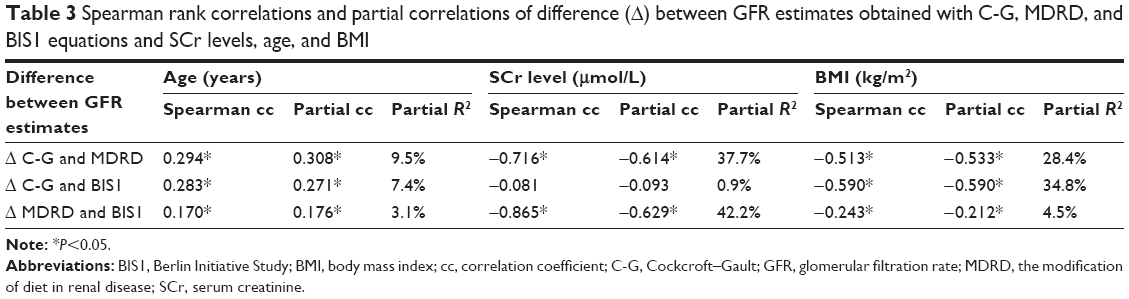 | Table 3 Spearman rank correlations and partial correlations of difference (Δ) between GFR estimates obtained with C-G, MDRD, and BIS1 equations and SCr levels, age, and BMI |
Discussion
Accurate renal function assessment is an important issue in geriatric palliative care patients, as it is necessary for appropriate drug dosage adjustments in order to avoid dose-related toxicity, adverse effects, and unnecessary suffering. Palliative care patients are a very special population for several reasons, including high prevalence of cachexia and substantial muscle mass loss (and thus a decrease in creatinine source). In people with very abnormal basal creatinine production, it is recommended to assess kidney function with direct measurement of GFR or creatinine clearance.22 However, such methods are hardly applicable in a palliative care setting, owing to their complex methodology requiring exogenous substance administration or 24-hour urine collection, and high cost. Therefore, GFR estimation equations based on SCr levels and anthropometric data are used to assess renal function in clinical practice. Among these formulas, BIS1 was developed especially to assess GFR in people 70 years or older14 and was validated in further studies as being the most reliable for assessing renal function in the elderly.15,16 In this study, we analyzed GFR estimations with the BIS1 equation as compared to MDRD and C-G equations in a group of palliative care patients aged >70 years.
We observed important discrepancies between the equations, with the highest mean GFR values for MDRD estimations and lowest with C-G. While it has been previously observed that MDRD estimations in elderly subjects are higher than C-G and BIS1,14–16,23 comparisons of C-G and BIS1 estimations have given variable results. In the study of Douros et al,16 C-G estimations were higher than BIS1, in contrast to this study and to a population-based trial of Mandelli et al.24 As C-G calculations incorporate body mass, these differences most probably derive from the differences in anthropometric parameters in study populations. Mean BMI in our study group was within the normal range and was very similar to that of Mandelli et al24 (23.3±4.3 kg/m2), while in the study of Douros et al,16 most participants were overweight or obese (mean BMI 29.4±4.5 kg/m2). In order to improve C-G accuracy, we used IBW in patients with normal body weight and ABW in overweight and obese subjects, as suggested by Winter et al.18 However, these adjustments do not correct for changes of muscle mass independent of total body mass, eg, in patients with cachexia or edemas. Importantly, in some validation studies using a reference method, MDRD equation was found to overestimate measured GFR across the whole spectrum of GFR values in elderly subjects.15,16
Discordance between the estimation equations was illustrated with the Bland–Altman plots (Figure 1). On average, MDRD estimations were higher than BIS1 and C-G results (the difference was 12.5 and 18.6 mL/min/1.73m2, respectively). At an individual level, differences between estimation equations were much more important, as indicated by a wide range of 95% limits of agreement. Although direct comparison is impossible, bias found in our study seems to be higher than that in previously reported validation studies using a reference method.15,16 However, the biggest discordance was observed for higher GFR values. When analysis was restricted to the subgroup of patients with MDRD-derived GFR <60 mL/min/1.73 m2, the average difference between MDRD and BIS1 or C-G was much smaller (2.47 and 8.32 mL/min/1.73 m2, respectively). GFR estimations with BIS1 and C-G yielded quite consistent results.
The differences between GFR estimations with the three formulas resulted in high discordance rate in National Kidney Foundation staging, especially between MDRD and C-G. Overall, the staging with MDRD and C-G GFR estimates was consistent in 64.9% of patients only. The most important discordance was observed in discrimination between normal or mildly reduced GFR vs moderately reduced GFR: 45% of patients classified with MDRD (and 24.3% classified with BIS1) as stages I–II CKD had moderately reduced GFR (stage III) based on C-G creatinine clearance. As most recommendations on drug dosage adjustment were elaborated using the C-G equation, such discrepancies in CKD staging may result in inappropriate dosing of renally excreted drugs.16,25,26
The magnitude of discrepancy between GFR estimation equations was influenced by SCr levels, BMI, age, and sex. We observed strong, negative correlation between SCr level and Δ C-G and MDRD, as well as Δ BIS1 and MDRD. This finding can be explained by the worse performance of MDRD in subjects with normal SCr levels.27 Partial correlation analysis demonstrated that ~40% of variability in Δ C-G and MDRD and Δ BIS1 and MDRD can be determined from the relationship with SCr. In contrast, SCr did not influence the difference between BIS1 and C-G.
In line with previous studies,23 the discrepancy between MDRD and C-G increased with age (weak correlation), which can be explained by the fact that neither MDRD nor C-G was developed in the elderly population, and performance of both equations is known to be poorer in older age.13 Similarly, the discrepancy between MDRD and BIS1 and between BIS1 and C-G increased with more advanced age (weak correlations). The proportion of variability in differences between GFR estimation equations that can be determined from the relationship with age was low (3.1%–9.5%). The discordance between estimation equations was higher in subjects with lower BMI values. We observed moderate, negative correlation between BMI and Δ C-G and MDRD and Δ C-G and BIS1. BMI determined ~30% of variability in both differences. The disagreement between C-G and the remaining equations may be explained by the fact that body mass is included in the C-G equation only. More interestingly, BMI had an influence on Δ BIS1 and MDRD, also the magnitude of this influence was much smaller (weak, negative correlation; BMI explained 4.5% of variability in Δ BIS1 and MDRD). As for sex differences, the disagreement between BIS1 and C-G was higher in women, while discrepancy between MDRD and BIS1 tended to be higher in men.
Study limitations
The most important limitation of our study is the lack of directly measured GFR, which precludes determination as to which of the compared estimation equations gives the most reliable results in elderly palliative care patients. Second, it was a single-center, retrospective analysis. Furthermore, we did not include bedridden subjects in whom body weight measurement was impossible and patients in whom creatinine concentrations were not measured due to short life expectancy (hours–days), which has probably biased the results.
Conclusion
In palliative care patients >70 years, there is a noticeable disagreement between estimation of renal function with different formulas, especially between MDRD and C-G. The magnitude of discrepancy between the formulas increases with lower SCr levels, lower BMI, and higher age. Clinicians should be aware of these discrepancies and take them into account in daily practice, especially while adjusting drug dosage.
Disclosure
The authors report no conflicts of interest in this work.
References
Dogan E, Izmirli M, Ceylan K, et al. Incidence of renal insufficiency in cancer patients. Adv Ther. 2005;22(4):357–362. | ||
Launay-Vacher V, Oudard S, Janus N, et al. Prevalence of renal insufficiency in cancer patients and implications for anticancer drug management. Cancer. 2007;110:1376–1384. | ||
Janus N, Launay-Vacher V, Byloos E, et al. Cancer and renal insufficiency of the BIRMA study. Br J Cancer. 2010;103:1815–1821. | ||
Deskur-śmielecka E, Kotlińska-Lemieszek A, Niemir Z, Wieczorowska-Tobis K. Prevalence of renal impairment in palliative care inpatients: a retrospective analysis. J Palliat Med. 2015;18(7):613–617. | ||
Coresh J, Selvin E, Stevens LA, et al. Prevalence of chronic kidney disease in the United States. JAMA. 2007;298(17):2038–2047. | ||
Bowling CB, Sharma P, Fox CS, O’Hare AM, Muntner P. Prevalence of reduced estimated glomerular filtration rate among the oldest old from 1988–1994 through 2005–2010. JAMA. 2013;310:1284–1286. | ||
Chudek J, Wieczorowska-Tobis K, Zejda J, et al. The prevalence of chronic Sidney disease and its relation to socioeconomic conditions In an elderly Polish population: results from the national population-based study PolSenior. Nephrol Dial Transplant. 2014;29:1073–1082. | ||
Aronoff GR. Drug Prescribing in Renal Failure. Dosing Guidelines for Adults and Children. 5th ed. Philadelphia, PA: American College of Physicians; 2007. | ||
Ashley C, Dunleavy A. The Renal Drug Handbook. The Ultimate Prescribing Guide for Renal Practitioners. 4th ed. London, New York: Radcliffe Publishing; 2014. | ||
Cockroft DW, Gault MH. Prediction of creatinine clearance from serum creatinine. Nephron. 1976;16(1):31–41. | ||
Levey AS, Coresh J, Greene T, et al. Using standardized serum creatinine values in the modification of diet in renal disease study equation for estimating glomerular filtration rate. Ann Intern Med. 2006;145(4):247–254. | ||
Gill J, Malyuk R, Djurdjev O, Levin A. Use of GFR equations to adjust drug doses in an elderly multi-ethnic group – a cautionary tale. Nephrol Dial Transplant. 2007;22:2894–2899. | ||
Garasto S, Fusco S, Corica F, et al. Estimating glomerular filtration rate in older people. Biomed Res Int. 2014;2014:12. | ||
Schaeffner ES, Ebert N, Delanaye P, et al. Two novel equations to estimate kidney function in persons aged 70 years or older. Ann Intern Med. 2012;157(7):471–481. | ||
Koppe L, Klich A, Dubourg L, Ecochard R, Hadj-Aissa A. Performance of creatinine-based equations compared in older patients. J Nephrol. 2013;26(4):716–723. | ||
Douros A, Ebert N, Jakob O, Martus P, Kreutz R, Schaeffner E. Estimating kidney function and use of oral antidiabetic drugs in elderly. Fundm Clin Pharmacol. 2015;29(3):321–328. | ||
World Health Organization [webpage on the Internet]. Physical status: the use and interpretation of anthropometry. Report of a WHO Expert Committee. WHO Technical Report Series 854, 1995. Available from: http://www.who.int/childgrowth/publications/physical_status/en/. Accessed May 17, 2017. | ||
Winter MA, Guhr KN, Berg GM. Impact of various body weights and serum creatinine concentrations on the bias and accuracy of the Cockroft-Gault equation. Pharmacotherapy. 2012;32:604–612. | ||
National Kidney Foundation [webpage on the Internet]. KDOQI Clinical Practice Guidelines for Chronic Kidney Disease: Evaluation, Classification, and Stratification. Available from: http://www.kidney.org/professionals/KDOQI/guidelines_ckd/toc.htm. Accessed May 17, 2017. | ||
Bland JM, Altman DG. Statistical methods for assessing agreement between two methods of clinical measurement. Lancet. 1986;1(8476):307–310. | ||
Altman DG. Practical Statistics for Medical Research. London: Chapman and Hall/CRC; 1991. | ||
National Institute of Diabetes and Digestive and Kidney Disease [webpage on the Internet]. Estimating glomerular filtration rate (GFR). Available from: https://www.niddk.nih.gov/health-information/health-communication-programs/nkdep/lab-evaluation/gfr/estimating/. Accessed May 17, 2017. | ||
Pedone C, Corsonello A, Antonelli R, for the GIFA Investigators. Estimating renal function in older people: a comparison of three formulas. Age Ageing. 2006;35(2):121–126. | ||
Mandelli S, Riva E, Tettamanti M, Detoma P, Giacomin A, Lucca U. Mortality prediction in the oldest old with five different equations to estimate glomerular filtration rate: the Health and Anemia Population-based Study. PLoS One. 2015;10(8):e0136039. | ||
Wargo KA, English TM. Evaluation of the chronic kidney disease epidemiology collaboration equation for dosing antimicrobials. Ann Pharmacother. 2010;44(3):439–446. | ||
Nyman HA, Dowling TC, Hudson JQ, St Peter WL, Joy MS, Nolin TD. Comparative evaluation of the Cockcroft-Gault equation and the modification of diet in renal disease (MDRD) study equation for drug dosing: an opinion of the Nephrology Practice and Research Network of the American College of Clinical Pharmacy. Pharmacotherapy. 2011;31:1130–1144. | ||
Bostom AG, Kronenberg F, Ritz E. Predictive performance of renal function equations for patients with chronic kidney disease and normal serum creatinine levels. J Am Soc Nephrol. 2002;13(8):2140–2144. |
 © 2017 The Author(s). This work is published and licensed by Dove Medical Press Limited. The
full terms of this license are available at https://www.dovepress.com/terms
and incorporate the Creative Commons Attribution
- Non Commercial (unported, 3.0) License.
By accessing the work you hereby accept the Terms. Non-commercial uses of the work are permitted
without any further permission from Dove Medical Press Limited, provided the work is properly
attributed. For permission for commercial use of this work, please see paragraphs 4.2 and 5 of our Terms.
© 2017 The Author(s). This work is published and licensed by Dove Medical Press Limited. The
full terms of this license are available at https://www.dovepress.com/terms
and incorporate the Creative Commons Attribution
- Non Commercial (unported, 3.0) License.
By accessing the work you hereby accept the Terms. Non-commercial uses of the work are permitted
without any further permission from Dove Medical Press Limited, provided the work is properly
attributed. For permission for commercial use of this work, please see paragraphs 4.2 and 5 of our Terms.