Back to Journals » Drug, Healthcare and Patient Safety » Volume 13
Assessment of Drug Use Practices Using Standard WHO Indicators in Lumame Primary Hospital
Authors Alehegn AA ![]() , Aklilu RG, Tadesse KA, Tegegne BA
, Aklilu RG, Tadesse KA, Tegegne BA ![]() , Kifle ZD
, Kifle ZD ![]()
Received 15 October 2020
Accepted for publication 4 February 2021
Published 19 February 2021 Volume 2021:13 Pages 59—69
DOI https://doi.org/10.2147/DHPS.S286242
Checked for plagiarism Yes
Review by Single anonymous peer review
Peer reviewer comments 2
Editor who approved publication: Professor Siew Siang Chua
Agumas Alemu Alehegn,1 Robel Gursm Aklilu,1 Kaleab Ayalew Tadesse,1 Bantayehu Addis Tegegne,2 Zemene Demelash Kifle3
1Department of Pharmacy, Lumame Primary Hospital, Lumame, Ethiopia; 2Debremarkos University, College of Medicine and Health Sciences, Pharmacy Department, Debremarkos, Ethiopia; 3University of Gondar, College of Medicine and Health Sciences, School of Pharmacy, Department of Pharmacology, Gondar, Ethiopia
Correspondence: Agumas Alemu Alehegn Lumame, Ethiopia
Tel +251922719063
Email [email protected]
Background: Irrational use of drugs has been one of the major problems around the globe. However, the degree of the problem is higher in developing countries like Ethiopia. The WHO has developed several indicators to evaluate the practices of drug use. This study aimed to assess the overall drug use practices using standard WHO indicators in Lumame Primary Hospital.
Methods: Hospital-based retrospective cross-sectional study was employed to investigate the overall drug use practices at the hospital. Six hundred prescriptions were selected from a total of 19,242 prescriptions by systematic sampling technique over one year from July 1, 2019, to June 30, 2020, in a retrospective review. For the patient care study, 100 patients were selected for collecting the required information. Facility indicators were assessed by checking the availability of STG/formularies and essential drugs. The results were interpreted according to the standard values of WHO.
Results: All 600 sampled prescriptions were 100% standard. Weight, dosage form, and quantity were written in 1.5– 13.3% of the prescriptions. Patient address was recorded in 51%, while qualification of prescriber and dispenser were recorded in 71.5% and 56% of the cases, respectively, but all other information were complete in 88.5– 100% of the prescriptions. The mean number of drugs per encounter, generic prescribing, prescribing from essential drug list, encounters with antibiotics and injectable drugs were 2.3, 97.9%, 99.8%, 48.8%, and 11.2%, respectively. The average dispensing time was found to be 171.9 seconds. Percentage of actually dispensed drugs, adequacy of labeling, patient knowledge, and patient satisfaction were 95.3%, 22.6%, 83%, and 88%, respectively. About 92% of tracer drugs and all reading materials, except national drug list and facility-level drug formulary, were available in the study period.
Conclusion: Generally, appreciable results were obtained for most of the indicators but improvement in antibiotic prescribing, polypharmacy and labeling practice is recommended.
Keywords: rational drug use, Lumame Primary Hospital, WHO indicators
Background
Appropriate use of medicines plays a pivotal role in health service provision and reducing mortality and morbidity. This can be accomplished through availing good quality drugs and promoting their rational use.1 As per the World Health Organization (WHO) definition, the
Rational use of drugs requires that patients receive medication appropriate to their clinical needs, in doses that meet their requirement for an adequate period and at the lowest cost to them and their community.1
Rational use of drugs is the delivery of safe, efficacious and affordable medications to the clients. It can be promoted through the team efforts of health professionals, clients and policymakers.2 This appropriate use of medicines will maximize the treatment outcomes, decrease drug interaction and unwanted reactions, shorten hospitalization and reduce the cost of treatment.2–4 However, the World Health Organization (WHO) reports that not only more than 50% of the drugs ordered, dispensed and sold inappropriately, half of all patients were failed to take the drugs correctly. Moreover, about one-third of the world’s population lacks access to essential medicines.1
Use of wrong drugs, with unproven efficacy, with uncertain safety status, with no indication, failure to provide safe and effective drugs, polypharmacy, inappropriate use of antibiotics and injections, use of brand drugs and failure to prescribe based on clinical guidelines are characteristics of irrational drug use.5–7 In both developed and developing countries variety of complex factors causes this irrational practice, which can be grouped as deriving from clients, prescribers, supply management and drug information and/or misinformation.2,5,6
Irrational use of drugs has been one of the major problems in the globe as well as in the Ethiopian health service provision.2 Irrational practice can lead to lack of effective treatment, aggravating disease progression, developing an adverse reaction to the patients, loss of patients, unsatisfactory outcome, waste of scarce resources, development of antimicrobial resistance (AMR) and increase uneconomical treatment.6,8
To improve the overall drug use practices, international agencies like the World Health Organization (WHO) and the International Network for the rational use of drugs (INRUD) have developed, standardized and evaluated several indicators, despite the complexity of drug use.9 Accordingly, core prescribing, patient care and facility indicators have been developed and validated to evaluate the practices of drug use in outpatient settings of health facilities.10 These assessment indicators are now broadly used as a standard for drug use problem identification.
This study was conducted to assess major problems in prescription completeness and drug use practices using WHO core indicators in Lumame Primary Hospital outpatient setting. This investigation plays a major role to prioritize the main intervention areas regarding the rational use of medicines based on the findings. It is also a base to conduct drug utilization review and rational use of drugs study in the future by identifying drug use-related problems. The study may also provide baseline data on drug use practices in Lumame primary hospital by using approved drug use standards and may help the facility to take a measure.
Methods
Study Area, Design and Period
The study was conducted in Lumame Primary Hospital, which is located in Awabel woreda, East Gojjam zone, Amhara region 302 km away from the capital of Ethiopia, Addis Ababa to the North West. In this woreda, there is one primary hospital (Lumame Primary Hospital) and six health centers. The hospital serves about 151,065 people in its catchment area. A hospital-based retrospective cross-sectional study was used to investigate the overall drug use practices at the hospital. In a retrospective review, sample prescription records that took place from July 1, 2019, to June 30, 2020, were selected from the outpatient pharmacy of the hospital. For collecting information related to dispensing time, adequacy of labeling, patient knowledge of dispensed medicines and pharmacy service patient satisfaction, a cross-sectional approach was employed. For facility care study, the availability of essential/tracer drugs, standard treatment guidelines/formularies and other reading materials were checked during the study period. The study was conducted from August to October 2020.
Source and Study Population
For the assessment of prescribing indicators and prescription completeness, all prescriptions issued and documented in the outpatient pharmacy of Lumame Primary Hospital were used as a source population. Prescriptions issued from July 1, 2019-June 30, 2020 were used as a study population from which samples were taken for the actual retrospective study. For patient care indicators assessment, all prescriptions delivered to the outpatient pharmacy of the hospital were taken as a source population; however, all prescriptions dispensed on the days of the indicators survey were considered as a study population.
Inclusion and Exclusion Criteria
Prescriptions which contained only drugs, and drugs and medical supplies and dispensed to outpatients were included in this retrospective study. For the patient care study, those patients who were willing to participate in the survey were included. But prescriptions that contained only medical supplies (glove, syringe); fluids and/or parenteral nutrition; non-pharmacological treatments; illegible prescriptions and prescriptions brought from outside of the hospital and copy prescription papers from one dispensary site to others were excluded from the study. Those who were severely ill, unable to talk and unwilling to participate were excluded from this study.
Study Variables (Dependent and Independent Variables)
The dependent variable for this study was the overall drug use practices. Independent variables that ultimately affect the overall drug use practices include patient-related information (name of the patient, age, sex.), drug-related information (drug name, strength, dose, and frequency), health professional related information (name, signature and qualification) and WHO core indicators.
Sample Size Determination and Sampling Procedure
According to WHO recommendation, 600 prescriptions can be used to assess rational drug use practices in outpatient departments if a single health care setting is considered, with a greater number, if possible.9 Accordingly, 600 prescriptions were selected to assess prescription completeness and prescribing indicators in Lumame Primary Hospital. About 19,242 prescriptions were found to be issued during a one-year period indicated above in outpatient pharmacy. These prescriptions were arranged in chronological order and the sampling interval was obtained by dividing the study population by the actual sample size (Kth=19,242/600 =32). Then systematic random sampling was employed to collect the required sample size by picking every 32nd prescription given randomly selected initial sample. For patient care indicators assessment, the WHO recommends the inclusion of at least 100 patient encounters in outpatient departments of a single healthcare setting.9 Therefore, a hundred patients were selected by purposive sampling to assess their knowledge on patient care indicators (dispensing time, labeling, knowledge on dosage frequency, number of drugs dispensed and patient satisfaction) in the actual study. To assess the availability of key medicines in the hospital, 25 drugs were included according to the modified WHO medicines list.11 Taking into consideration that the selected medicines should treat the common high prevalence diseases and they should be available in the hospital as lifesaving drugs. Their selection was also validated by the drug and therapeutic committee of the hospital, warehouse managers and senior pharmacists.
Data Collection Tools and Procedure
Data collection formats, designed and adopted by WHO, that include all the components of prescription, prescribing indicators form and patient care indicators form were utilized during the study. All types of data needed to assess prescription completeness and prescribing indicators were collected from sampled prescriptions in this format. Patient care formats were used to record data during an exit interview of 100 sampled patients about knowledge of dispensed drugs and patient satisfaction. Observational checklists were also used to collect data regarding to dispensing time, adequacy of labeling and number of drugs actually dispensed. The availability of essential/tracer drugs, STGs/formularies and other resources were checked for selected items at the facility during the study period. Well-oriented four pharmacy personnel were involved in the data collection process.
Data Quality Assurance
To ensure the quality of data, appropriately designed data collection instruments were used. In addition, frequent checks of the data collection process were implemented to ensure the consistency of collected data.
Data Processing and Analysis
All collected data were entered into Microsoft Excel 2013 and then frequencies, averages and percentages were calculated and summarized using standard summary forms. The results were interpreted according to the standard values of WHO for healthcare outpatient settings.9
Results
Use of Standard Prescription Paper
All the sampled prescriptions were checked for their similarity with the standard prescription developed by the Food, Medicine and Health Care Administration and Control Authority (FMAHCA) of Ethiopia. All 600 sampled prescriptions were found to be standard (100%) (Table 1).
 |
Table 1 Summary of Prescription Paper Issued with Complete Information Required, Lumame Primary Hospital, July 2019–June 2020 (N= 600) |
Completeness of Prescription Information
To confirm prescription information completeness, all parts of the prescription (ie superscription, prescription and subscription) were assessed for these 600 sampled encounters. The present finding as indicated in Table 1, showed that, except for weight (1.5%) and address (51%), all patient-related information was 98.8–100% complete.
Name, strength, dosage form, dose, route, frequency, quantity and duration of prescribed drugs were checked to verify the completeness of drug-related information. As shown in Table 1, the correct name of the drugs was clearly written in 600 (100%) of the prescriptions. Strength, dose, route, frequency and duration were clearly written in 88.5–98.8% of the prescriptions. Dosage form and quantity were written in 13.3% and 53% of the cases respectively.
Prescriber`s and dispenser`s identifier information including name, qualification, signature and date were also checked to verify the completeness of the subscription part of a prescription. In this study, (Table 1), 96.7–100% of the prescriptions contain the name, signature and date of the prescriber and dispenser, whereas prescriber`s and dispenser`s qualification were written in 71.5% and 56% of the prescriptions respectively.
Prescribing Indicators
The results of prescribing indicators are summarized in Table 2.
 |
Table 2 Summary of Core Prescribing Indicators, Lumame Primary Hospital, July 2019–June 2020 (N= 600) |
Average Number of Drugs per Prescription
The minimum number of drug(s) prescribed per prescription was 1 and the maximum was 7. Of the prescriptions, 248 (41.33%), 151 (25.17%), 132 (22%) and 54 (9%) encounters contain 2, 3, 1 and 4 drugs per prescription respectively. Five and above drugs were found to be prescribed in 15 (2.5%) of prescriptions. The average number of drugs prescribed per prescription was 2.3±1.03.
Percentage of Drugs Prescribed by Generic Name
As indicated in Table 2, of 1380 prescribed drugs, 1351 (97.9%) were written in a generic name. Lasix (furosemide), Plasil (Metoclopramide), Daonil (Glibenclamide) and Viagra (Sildenafil) were found to be commonly prescribed non-generic drugs (Table 3).
 |
Table 3 Summary of Commonly Prescribed Antibiotics, Injections and Non-Generic Drugs, Lumame Primary Hospital, July 2019–June 2020 |
Percentage of Prescriptions with an Antibiotic Prescribed
As shown in Table 2, a total of 404 antibiotics were prescribed for 293 (48.8%) encounters from sampled prescriptions and these commonly prescribed antibiotics are summarized in Table 3.
Percentage of Prescriptions with an Injection Prescribed
Totally 72 injectable drugs were prescribed for 67 (11.2%) encounters from 600 samples as indicated in Table 2 and these injectable drugs are indicated in Table 3.
Percentage of Drugs Prescribed from Essential Drug List
According to the WHO recommendation, all prescribed drugs should be from the essential drug list. In this study, Table 2, 1377 (99.8%) drugs were found to be prescribed from the essential drug list.
Patient Care Indicators
The results of patient care indicators are summarized in Table 4.
 |
Table 4 Summary of Patient Care Indicators, Lumame Primary Hospital, August 2020 (N= 100) |
Average Dispensing Time
To evaluate this indicator, time was recorded with a stopwatch during the evaluation and counseling of patients excluding the waiting time. In our hospital, the average dispensing time was found to be 171.9 seconds (Table 4).
Percentage of Drugs Actually Dispensed
As indicated in Table 4, only 224 (95.3%) drugs were actually dispensed from a total of 235 prescribed drugs for 100 patients involved in the study within the hospital pharmacy.
Percentage of Drugs Adequately Labeled
In this study, from 224 drugs actually dispensed, only 53 (23.7%) drugs were found to be labeled. Of these labeled drugs, patient name, drug name, dose, frequency, quantity, date of dispensing and precaution were written for 17–100% of the dispensed drugs. Adequately labeled drugs (a label that includes patient name, drug name, dose and frequency) were found to be 12 (22.6%).
Percentage of Patient Knowledge of Correct Dosage
As shown in Table 4, 8–93% of patients were able to repeat the name, indication, dose, frequency, duration, storage and precaution of the drugs they had received. The overall patient knowledge of correct dosage (dose and frequency) was found to be 83 (83%).
Pharmacy Service Patient Satisfaction
To determine the overall pharmacy service patient satisfaction, these 100 patients were asked about the service provided in the outpatient pharmacy unit. From these 88 (88%) patients were found to be satisfied with the service they got.
Health Facility Indicators
The results for the availability of tracer drugs and standard treatment guidelines/formularies were summarized in Tables 5 and 6 for selected items.
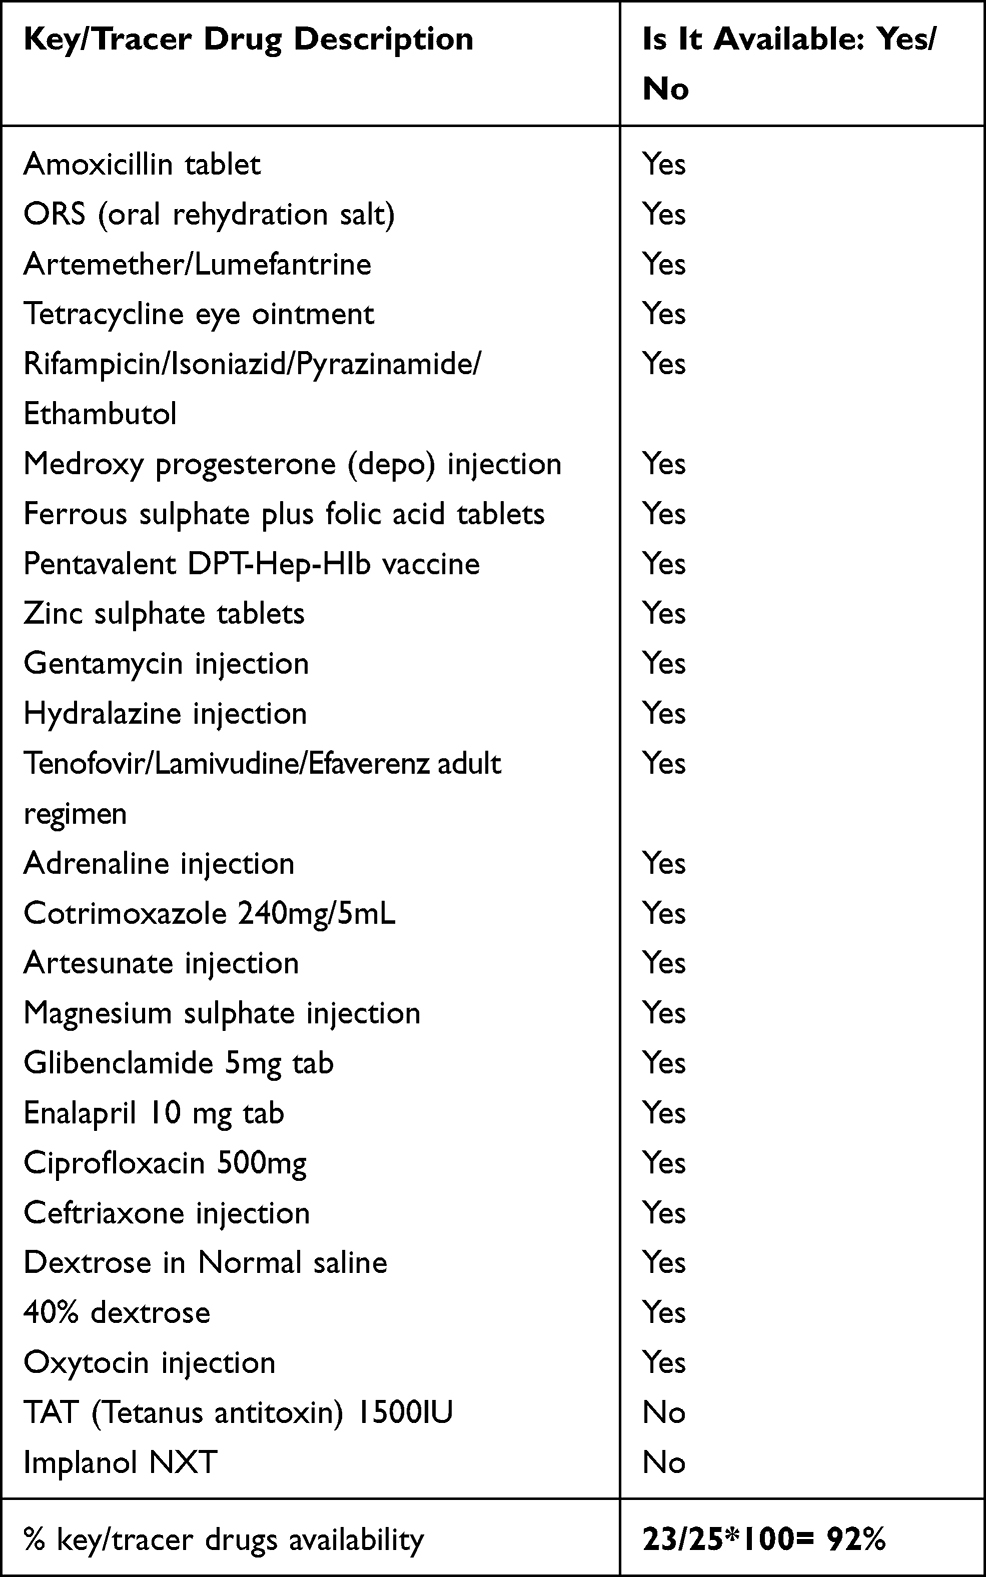 |
Table 5 Summary of Availability of Key/Tracer Drugs, Lumame Primary Hospital, August 2020 (N= 25) |
 |
Table 6 Summary of Availability of a Copy of Essential Drug List, Formulary and Standard Treatment Guidelines, Lumame Primary Hospital, August 2020 |
Availability of Key/Tracer Drugs
The physical availability of 25 essential drugs was checked in the hospital`s drug store during the study period. As indicated in Table 5, only 23 (92%) tracer drugs were found to be available in this hospital.
Availability of EDL/Formulary and STG
To verify the availability of these resources in this hospital a list of documents was assessed. As shown in Table 6, except for the national drug list and facility-level drug formulary, all materials were found to be available in the study period. However, the poor practice of using these resources was observed during this assessment.
Discussion
The present study explored the overall drug use practice using standard WHO indicators in Lumame Primary Hospital. In this study, all sampled prescriptions were found to be 100% standard as per FMHACA recommendation. This proper utilization of standard prescription papers should be sustainable in this facility. Besides the use of standard prescription paper, prescription completeness, legality and reliability have a significant impact on the appropriate use of drugs in the world.4 So every selected prescription was checked for the completeness of all the required information (superscription, prescription and subscription parts). The present finding revealed that few prescriptions lack one or more parameters. Regarding patient identifier information encouraging practice was found in this study. However, patient weight and address were written in 1.5% and 51% of the cases respectively, which are far less than the ideal WHO standard (100%).9 Thus, these data should be properly recorded to promote appropriate drug utilization in the hospital. If the diagnosis is not properly recorded on the prescription, the dispensers may issue the drugs blindly. So writing diagnosis indicates the transparency and confidence of the prescriber, which helps pharmacy personnel to check the consistency of diagnosis and drug-drug interactions, contraindications and overall contribution to positive therapeutic outcomes.12 The age of the patient is an important determinant factor to prevent therapeutic failure or overdosage toxicity by adjusting dosage regimen and to rule out possible contraindications. Weight is another essential component for calculating dosage and correcting regimen errors, especially in pediatric patients’ drug therapy.13 Sex of the clients should also be recorded on all prescriptions due to its influence on the pharmacokinetic properties of some drugs.8 Good practice in terms of writing drug name, strength, dose, route, frequency and duration (88.5–100%) were observed. However, dosage form and quantity were recorded in 13.3% and 53% of the prescriptions, respectively, which is not satisfactory compared to WHO ideal standard (100%).9 This might be due to negligence or lack of training on good prescribing practice. Recording the number of drugs is important for ease of dispensing and inspection. Over or under therapy may be caused by missing the dosage and duration of therapy.13 The last part of a prescription contains health professional’s related information. Prescriber information helps the client or the pharmacy personnel to contact them for any further information and to assure responsibility for any accountability in the medicolegal system. Dispensers related information assure accountability for any drug-related problems.8 In the present finding, the name, signature and date of prescriber and dispenser were written in 96.7–100% of the prescriptions, indicating the presence of good practice in these parameters. However, the qualification of the prescriber and dispenser was written in 71.5% and 56% of the prescriptions respectively, which is a poor practice compared to the ideal WHO standard.9
Prescribing indicators were also determined in this study to assess the overall drug use practice in the hospital. The mean number of drugs per encounter was determined to measure the degree of polypharmacy and it was found to be 2.3. The result indicates the practice of polypharmacy as per WHO standard value of less than or equal to two drugs per encounter.9 However, lower than this figure was documented in national baseline study (1.9),14 as well as other studies which reported (1.76–2.1).4,8,15–17 On the contrary, more than this figure was reported from other studies (2.9–3.9).18–22 This higher figure in our study setting might be due to prescriber’s poor training, lack of first-line drugs or client has multiple medical conditions. Prescribing multiple drugs at once may cause over/under-dosing, drug interactions, unwanted drug reactions and wastage of resources.10 To reduce the burden of prescribed drugs to clients, empirical treatment should be minimized. Therefore, close monitoring of the prescribing practice should be devised to minimise poly pharmacy.
Generic prescribing was found to be 97.9%, which is almost similar to the ideal WHO standard 100%.9 Lasix® (frusemide), Plasil® (metoclopramide), Daonil® (glibenclamide) and Viagra® (sildenafil) were found to be commonly prescribed non-generic drugs. The results of the present study were better than that of the national baseline study (87%),14 and other reports (27.7%, 35.5%),20,21 but comparable with that of other studies which reported 93–99.2%.4,8,10,15,16,23 Prescribing by generic name helps the pharmacy department for better inventory management and they are relatively economical and accessible. Generic prescribing also minimize confusion among the pharmacy personnel.4,10
Th use of antibiotics and injections are other aspects given great consideration by WHO indicator studies because of their misuse. Antibiotics prescribing was found to be 48.8% in this study, which shows a high deviation from the WHO recommended value of <30%.9 Prescriptions with antibiotics more than this figure (50.7–84.8%),4,14–16,21,23 were documented from other studies. However, values less than this figure (29.1–38%),8,10,17,20 and closer to WHO standard were reported from different health care settings. Cultural beliefs and client`s expectations about antibiotics might cause this higher figure of antibiotics prescribing in our study setting, which indicates the need for regulation of prescribing this class of drugs. Therefore, conducting drug use evaluation will be important to verify the appropriateness of prescribing antibiotics. According to WHO report on AMR,
antibiotic resistance is no longer a prediction for the future; it is happening right now, across the world, and is putting at risk the ability to treat common infections in hospitals and the community at large.
Rational use of these drugs is mandatory to minimize such resistance as well as wastage of scarce resources.24
Injection prescribing was found to be 11.2%, which indicates that the use of injectable drugs in the outpatient setting of this hospital was within acceptable WHO standard value of <25% (ideal range, 13.4–24.1%).9 The figure was better than the national baseline study result (23%)14 and other study reports (24.9–59.2%).4,8,15,16 Even though the result is within the acceptable WHO standard range, professionals and clients’ assessment about their belief and attitudes towards the comparative efficacy of oral and injectable drugs is recommended. This is because professionals and clients may believe that injections are more effective than any other agents to alleviate medical conditions. Of course, injectable drugs are good formulations during critical situation due to their fast onset of action. However, their frequent use will cause pain at the site of injection, the transmission of infectious diseases and wastage of resources.9 In addition, overuse of injectable drugs is uneconomical in terms of cost and sterilization process.25
The present study also revealed that 99.8% of drugs were written from EDL of the country, which is nearly comparable to the ideal WHO value (100%),9 and other reports (96.6–100%).4,10,15,17,21 Prescribing from the EDL have an advantage of maximizing essential drug accessibility, decreasing unwanted drug prescription, reducing potential drug interactions, decreasing untoward drug reaction and promoting treatment outcomes.10
Mean dispensing time was determined to measure the time that a dispenser spends with the clients during evaluation and counseling, excluding the waiting time. According to the WHO recommendation, the mean dispensing time should be >180 seconds. In this study, it was calculated to be 171.9 seconds, which is less than the ideal standard,9 but better than other study reports (59.9–131.5seconds).4,10,21,22 This shorter dispensing time might be due to poor counseling for patients regarding drug therapy during the time of dispensing as a result of busy patient flow or thinking that chronic patients have full information about their drug since they took the drug for a long period. The level of the client`s understanding of their medication is highly affected by the duration of dispensing.9
From totally prescribed drugs about 95.3% were actually dispensed within the outpatient setting of this hospital. This finding was comparable with WHO ideal value of 100%,9 and better than the average percent values of other study reports (76.3–86%).4,18,21 About 23.7% of drugs were found to be labeled. Labeling of patient name, drug name, quantity, date of dispensing, precaution, dose and frequency ranges from 17–100%. The overall labeling adequacy (a label that includes at least patient name, drug name, dose and frequency) was found to be 22.6%. The figure shows a significant deviation from the WHO ideal value of 100%.9 This indicator was assessed to determine the practices of dispensers writing necessary information on the drug they issued. Information can be recorded on drug packages like plastic envelopes, paper envelopes, on the strip and others.26 Labeling have the advantages of promoting awareness and adherence to treatment and it is one of the core indicators of good dispensing practice. A complete and legible label help to identify the content of a drug package and provide clear information about the use of the drug.9 The current study indicated that the overall labeling practice were poor in this hospital, which is in agreement with other hospital labeling practice reports (6–30.4%).4,8,10,18,21,22 This inadequate labeling will maximize the probability of medication error, adverse reactions and treatment failure. The reasons for such poor labeling practice in our hospital might be due to lack of training and negligence. Therefore, urgent managerial interventions are mandatory to improve such poor practice by employing different mechanisms. Among those, availing dispensing aids; enforcing the implementation of 100% labeling of all dispensed drugs by pharmacy personnel; develop a labeling system and disseminate already prepared labels that are easy to write quickly (preprinted) can be mentioned. Besides adequate labeling, patients should be effectively informed about the dosage schedule of the drugs they received. The overall patient knowledge of correct dosage (dose and frequency) was found to be 83% in this study. This result is less than the ideal WHO expected value of 100%,9 which might be due to short contact time (less than the standard) between the dispenser and the patient as shown in this study. This value is nearly comparable with other study reports (61.9–80%).4,8,10 High patient workload, inappropriate counseling, negligence of dispensers, inadequate labeling and poor patient educational background can affect the level of patient knowledge on the correct dosage. To improve such practice preparation of counseling tips that can be used urgently and continuous provision of medical education to dispensers on good dispensing practice are recommended. Considering this parameter into consideration, all 100 patients were interviewed about their pharmacy service satisfaction. The result indicated that 88% of the patients were found to be satisfied with the service they got in the outpatient pharmacy setting. Even though the figure was less than the WHO standard value of 100%,9 it can be considered as a good value because of the short effective dispensing time and inadequacy of labeling in this hospital.
To check the influence of the working environment on rational drug use, WHO health facility indicators were also assessed in the present study. Adequate availability of essential medicines and access to reliable information helps the health personnel to function effectively.27 In this study, 92% of tracer drugs were found to be available during the study period, which is less than the recommended value of 100%.9 This result was better than other reports (80–85%).10,18,21 Full implementation of integrated pharmaceutical logistic system and automated inventory management system as well as developing a standard operating procedure that guides the procurement policy of pharmaceuticals in the hospital can improve the availability of essential drugs. The health status of the patients can be dangerously affected by the shortage of essential drugs that treat common health problems. Shortage of essential drugs in a health facility could be due to shortage from the supplier(s), absence of pharmaceuticals procurement policy, absence of scheduled procurement timetable, lack of transportation and budget constraint.
On the other hand, the purpose of assessing the availability of essential drug lists/formularies and other resources is to verify the extent to which copies of these materials are available and used at this health facility. In this finding, copies of all reading materials, except, national drug list and facility-level drug formulary, were found during the study period. However, the poor practice of using these available materials was observed. Generally, the hospital should establish means to get those materials from government and non-governmental organizations as appropriate and also devise a mechanism to distribute them to the staff.
Conclusion and Recommendations
From the present assessment, we can conclude that all prescriptions used in the facility were standard but lacks one or more parameters, especially weight, address, dosage form, quantity and qualification of prescribers and dispensers. Generic prescribing, injectable drug use and prescribing from essential drug lists were highly appreciable in this setting. On the other hand, the mean number of drugs per prescription and antibiotics prescribing were out of the range of WHO ideal standard. Patient care indicator results were less than the standard value, especially the labeling practice was significantly poor in this setting. Good availability of essential drugs and copies of reading materials/STG/formularies/were verified. However, the poor practice of using these materials was observed during the study period. To identify the root causes of malpractice areas, further studies are recommended. To improve prescribing and dispensing practices educational interventions are also recommended for health care providers. The hospital Drug and Therapeutics Committee (DTC) should shoulder the responsibility of promoting rational prescribing and dispensing practice for improved health care service. Generally, close monitoring of prescribing practice, training of prescribers and dispensers, antibiotic drug use evaluation and availing preprinted labels are recommended.
Abbreviations
WHO, World Health Organization; INRUD, International Network for the rational use of drugs; HIV, Human Immune deficiency Virus; RDU, Rational Drug Use; EDL, Essential Drugs List; AMR, Antimicrobial resistance; STG, Standard treatment guideline; FMHACA, Food, Medicine and Health Care Administration and Control Authority.
Ethical Consideration
This study was conducted in accordance with the Declaration of Helsinki ethical principles and was ethically cleared and approved by Lumame Primary Hospital with a reference number of LPH/231/2020. Permission was formally obtained from the chief executive officer and drug and the therapeutic committee of the hospital before conducting the study. Consent of each participant of the study was taken before interviewed. During the consent process, they were provided with information regarding the purpose of the study.
Acknowledgments
We are grateful to the Chief Executive Officer and Chief Clinical Officer of the hospital for allowing us to conduct this research.
Funding
No specific grant for this study.
Disclosure
The authors declare that they have no competing interests.
References
1. WHO. Promoting rational use of medicines: core components. 2002.
2. DACA. Drug Administration and Control Authority. Training modules on operation and management of special pharmacies. 2003.
3. Laing R, Hogerzeil H, Ross-Degnan D. Ten recommendations to improve use of medicines in developing countries. Health Policy Plan. 2001;16(1):13–20. doi:10.1093/heapol/16.1.13
4. Sisay M, Abdela J, Kano Z, Araya M, Chemdi M, Fiseha A. Drug prescribing and dispensing practices in tertiary care hospital of eastern ethiopia: evaluation with world health organization core prescribing and patient care indicators. Clin Exp Pharmacol. 2017;7(03):2161–1459.1000238. doi:10.4172/2161-1459.1000238
5. WHO, The Use of Essential Drugs. 6th Report of the Expert Committee. Geneva: WHO Technical Report Series 850.3, 1995.
6. Hogerzeil H, Sallami A, Walker GA, Fernando G. Impact of an essential drugs programme on availability and rational use of drugs. Lancet. 1989;333(8630):141–142.
7. Foster S. Supply and use of essential drugs in sub-Saharan Africa: some issues and possible solutions. Soc Sci Med. 1991;32(11):1201–1218. doi:10.1016/0277-9536(91)90035-B
8. Admassie E, Begashaw B, Hailu W. Assessment of drug use practices and completeness of prescriptions in Gondar University Teaching Referral Hospital. Int j Pharm Sci Res. 2013;4(1):265.
9. WHO. How to investigate drug use in health facilities: selected drug use indicators. 1993.
10. Assefa T, Abera B, Bacha T, Beedemariam G. Prescription completeness and drug use pattern in the University Teaching Hospital, Addis Ababa, Ethiopia. J Basic Clin Pharm. 2018;9:4.
11. Bhosale MS, Jadhav NB, Adhav CV. Analysis of completeness and legibility of prescription orders at a tertiary care hospital. Int J Med Public Health. 2013;3:3. doi:10.4103/2230-8598.118975
12. Jun Z, Linyun L, Che Z, Yuanrong Y, Fengxi G, Heng Z. Analysis of outpatient prescription indicators and trends in Chinese Jingzhou area between September 1 and 10, 2006–2009. African J Pharm Pharmacol. 2011;5(2):270–275.
13. Gashaw T, Sisay M, Mengistu G, Amare F. Investigation of prescribing behavior at outpatient settings of governmental hospitals in eastern Ethiopia: an overall evaluation beyond World Health Organization core prescribing indicators. J Pharm Policy Practice. 2018;11(1):26. doi:10.1186/s40545-018-0152-z
14. FMoH. Federal Democratic Republic of Ethiopia Ministry of Health, Assessment of the Pharmaceutical Sector in Ethiopia. 2003:1–44.
15. Desalegn AA. Assessment of drug use pattern using WHO prescribing indicators at Hawassa University teaching and referral hospital, south Ethiopia: a cross-sectional study. BMC Health Serv Res. 2013;13(1):1–6. doi:10.1186/1472-6963-13-170
16. Assen A, Abrha S. Assessment of drug prescribing pattern in dessie referral hospital, dessie. Int J Pharm Sci Res. 2014;5(11):777–781.
17. Balcha TAM. Drug Prescribing Pattern in Mizan-Tepi University Teaching Hospital, South west Ethiopia. 2019.
18. Karande S, Sankhe P, Kulkarni M. Patterns of prescription and drug dispensing. Indian J Pediatr. 2005;72(2):117–121. doi:10.1007/BF02760693
19. Wang H, Li N, Zhu H, Xu S, Lu H, Feng Z. Prescription pattern and its influencing factors in Chinese county hospitals: a retrospective cross-sectional study. PLoS One. 2013;8(5):e63225. doi:10.1371/journal.pone.0063225
20. Chijoke-Nwauche IN, Chukwumezie CA, Udezi TW. Prescribing indicators: a review in the general outpatient clinic of a Nigerian Tertiary Hospital. J Health Sci Res. 2018;3:1–6. doi:10.18311/jhsr/2018/21532
21. Nyabuti AO, Okalebo FA, Guantai E. Examination of WHO/INRUD core drug use indicators at Public Primary Healthcare Centers in Kisii County, Kenya. medRxiv. 2020.
22. Rabie D, Kheder SI. Assessment of prescribing and dispensing practices based on WHO core prescribing indicators in hospital and community pharmacies in Khartoum State-Sudan. J Med Informatics Decision Making. 2020;1(3):1. doi:10.14302/issn.2641-5526.jmid-20-3493
23. Jabo SA, Tebeka AG, Asebe DS, et al. Assessment of medication prescription pattern at bole health center, Ethiopia. Int J Sci Rep. 2018;4(1):15–18. doi:10.18203/issn.2454-2156.IntJSciRep20175937
24. WHO. Antimicrobial Resistance, Global Report on Surveillance. Geneva, Switzerland; 2014.
25. Summoro TS, Gidebo KD, Kanche ZZ, Woticha EW. Evaluation of trends of drug-prescribing patterns based on WHO prescribing indicators at outpatient departments of four hospitals in southern Ethiopia. Drug Des Devel Ther. 2015;9:4551. doi:10.2147/DDDT.S83588
26. Hogerzeil HV. Promoting rational prescribing: an international perspective. Br J Clin Pharmacol. 1995;39(1):1–6. doi:10.1111/j.1365-2125.1995.tb04402.x
27. Bertoldi AD, Helfer AP, Camargo AL, Tavares N, Karanavos P. Medicine prices, availability and affordability in Southern Brazil: a study of public and private facilities. Citeseer. 2010.
 © 2021 The Author(s). This work is published and licensed by Dove Medical Press Limited. The
full terms of this license are available at https://www.dovepress.com/terms
and incorporate the Creative Commons Attribution
- Non Commercial (unported, 3.0) License.
By accessing the work you hereby accept the Terms. Non-commercial uses of the work are permitted
without any further permission from Dove Medical Press Limited, provided the work is properly
attributed. For permission for commercial use of this work, please see paragraphs 4.2 and 5 of our Terms.
© 2021 The Author(s). This work is published and licensed by Dove Medical Press Limited. The
full terms of this license are available at https://www.dovepress.com/terms
and incorporate the Creative Commons Attribution
- Non Commercial (unported, 3.0) License.
By accessing the work you hereby accept the Terms. Non-commercial uses of the work are permitted
without any further permission from Dove Medical Press Limited, provided the work is properly
attributed. For permission for commercial use of this work, please see paragraphs 4.2 and 5 of our Terms.