")
Back to Journals » Psychology Research and Behavior Management » Volume 16
Assessment of an Epidemic Urgency: Psychometric Evidence for the UCLA Loneliness Scale
Authors Bottaro R , Valenti GD, Faraci P
Received 31 January 2023
Accepted for publication 6 July 2023
Published 26 July 2023 Volume 2023:16 Pages 2843—2855
DOI https://doi.org/10.2147/PRBM.S406523
Checked for plagiarism Yes
Review by Single anonymous peer review
Peer reviewer comments 3
Editor who approved publication: Dr Igor Elman
Rossella Bottaro,1 Giusy Danila Valenti,2 Palmira Faraci1
1Faculty of Human and Social Sciences, University of Enna “Kore”, Enna, Italy; 2Department of Psychological, Educational Sciences and Human Movement, University of Palermo, Palermo, Italy
Correspondence: Rossella Bottaro, Faculty of Human and Social Sciences, University of Enna “Kore”, Cittadella Universitaria, Enna, 94100, Italy, Tel +39 0935 536536, Email [email protected]; [email protected]
Background: In modern industrialized countries, loneliness has been declared an epidemic. The present paper aimed to replicate previous findings about the dimensionality of the UCLA Loneliness Scale-3 version (LS-3) in a sample of Italian adults using Exploratory Structural Equation Modeling (ESEM).
Methods: In Study 1, 1676 participants (Mage= 31.15; SD = 11.89) completed the LS-3. The three-factor ESEM model was performed to replicate the previous Italian version, and a Confirmatory Factor Analysis compared the three- and ten-item short versions. In Studies 2, 3, and 4, we administered measures of anxiety, depression, stress, internet addiction, self-esteem, and social interaction anxiety to 3513 participants (Mage= 30.81; SD = 11.77) to assess the convergent and discriminant validity of LS-3.
Results: The ESEM 3-factor model was replicated using a Target rotation (X2 = 847.597; df = 133; CFI = 0.942; TLI = 0.917; RMSEA = 0.062), whereas the already-known LS-3 short version raised psychometric concerns. Positive relationships with anxiety, depression, stress, internet addiction, and social interaction anxiety, as well as negative association with self-esteem were found.
Conclusion: In conclusion, our findings support the use of the LS-3 in the Italian sample and discourage the administration of the current short forms. The implications for research and clinical practice have been discussed.
Keywords: loneliness, psychometrics, Exploratory Structural Equation Modeling, UCLA
Assessment of an Epidemic Urgency: Psychometric Evidence for the UCLA Loneliness Scale
Loneliness has been described as an epidemic in modern society,1 affecting one-third of people in developed countries.2 It was defined as an “unpleasant experience that occurs when a person’s network of social relations is deficient in some important way, either quantitatively or qualitatively”.3,4 Perlman and Peplau3 identified several manifestations of loneliness throughout history: i) affective, characterized by feelings of dissatisfaction, anxiety, boredom, and interpersonal hostility; ii) motivational and cognitive, which influence initiating social interactions; iii) behavioral, characterized by anxiety or depressive behaviours, a lack of assertiveness, and difficulty discussing their loneliness with others; iv) social and medical issues, such as suicide, alcoholism, and illness. Although transient loneliness is common, chronic or severe levels may have an impact on people’s health and wellbeing.5 Indeed, in twenty-first-century society, this subjective experience is associated with a sense of vulnerability, fragility, and weakness.6 More recently, the Evolutionary Theory of Loneliness7 highlighted that loneliness serves as a biological alarm for all species. The negative affection that comes with loneliness motivates one to repair or replace deficient healthy bonds, and the relief from it is rewarding. The negative nature of loneliness, on the other hand, and the rewarding positive value of social contact result in a dual motivation to resolve loneliness. Loneliness would eventually be harmful to one’s health as well as dangerous. Recent cross-cultural studies have discovered high levels of loneliness in individualistic countries, particularly among men.8 Specifically in Europe,9 the north European countries had the lowest levels of loneliness, while the east European countries had the highest levels. Furthermore, a recent cross-temporal meta-analysis10 found that loneliness levels in emerging adults increased to 0.56 standard deviations on the UCLA Loneliness Scale over the 43-year study period.
Ultimately, the great importance of this construct in modern society makes it necessary to reflect on it at a psychometric level. Particularly, psychometric instruments should be validated for the reference population, especially when they refer to serious health risk factors as well as loneliness. To this end, the first purpose of this study was to deepen the study of the UCLA Loneliness Scale (LS-3).
The UCLA Loneliness Scale: A Brief History
Most studies used the UCLA Loneliness Scale (LS) to assess loneliness, which has long been considered the “gold standard” in this field.11 The LS was created in 1978 at the University of California, Los Angeles (UCLA) in a twenty-item version.12 Despite its widespread use, it quickly became clear that its original version had numerous flaws, including invasive acquiescent response set bias because all items were formulated in the same direction and discriminant validity issues. As a result, only two years later,13 the same authors intended a revised version with ten positive and ten negative items. Furthermore, the LS-revised version has overcome discriminating validity issues in studies that linked loneliness to personality, social desirability, and depression. Following that, Russell14 developed the third version of the LS (LS-3) to address some emerging critical issues, such as: items with double negations, problems with face validity (eg, the item “My social relationships are superficial”, in which the word superficial was deemed ambiguous), the need to extend validation to populations other than university students (eg, older adults), and the introduction of new methods of administration (eg, mail survey). In the original study, the LS-3 consisted of 11 negative and 9 positive items with a Cronbach’s alpha ranging from 0.89 to 0.94 in three different samples (university students, nurses/teachers, and older adults).14 The LS-3 has been validated in several countries, including Canada,15 Turkey,16 Italy,17 Persia,18 and Japan, in line with its widespread use.19
Since the first appearance of version 3, there has been a clear need for practical and economic measures of psychological constructs. Russell,14 for example, intended a 10-item short version based on the selection of items with high item-total correlation (Cronbach’s alpha = 0.89). In addition, the Japanese version of the LS-3 demonstrated optimal reliability of the 10-item short version (Cronbach’s alpha = 0.89) and suggested an even more practical 3-item version (goodness-of-fit index GFI = 1.00; comparative fit index, CFI = 1.000; Cronbach’s alpha = 0.72) in a group of 248 mothers with infants and toddlers. The maintenance of short versions’ psychometric quality has been demonstrated by the fact that the total scores of both short versions correlated highly with those of the original version (r = 0.96, 0.87, respectively).
Ultimately, according to Kemper et al,20 the short measures of psychological constructs are useful to save on cost and time in assessing whether they are capable of preserving their psychometric qualities. Thus, the previous purposeful short version should be supported at a psychometric level with empirical validation and methodological considerations: the briefer version could be useful to improve participation rates in the studies and avoid fatigue or negative reactions in empirical studies, but if it did not have accurate measurements, it could results in low quality of the data.20
Evidence Based on Relations to Other Variables
Loneliness had a negative impact on psychological well-being,21 particularly in industrialized countries.1 The impact of loneliness on mental health has primarily been studied in relation to depressive symptoms,22 which may increase the risk of mortality.23 However, anxiety symptoms, particularly social anxiety, play an important role, potentially reducing the possibility of having social relationships,6 with a significant impact on stress levels.24 Finally, recent research25 focused on the rule of problematic internet use: it can become part of a vicious circle in which loneliness is mitigated by online browsing, which increases loneliness, particularly for people with low self-esteem.26
The Present Study
The purposes of this study were to provide evidence of the replicability of the LS-3’s previous purposed Italian version and examine/compare previous short versions of the tool (ie, 10-item and 3-item versions) in a group of Italian adult speakers (Study 1). Indeed, previous research17 provided evidence only for a little group of Italian university students from a single university in the north of Italy. Finally, the current study is devoted to providing new psychometric evidence about LS as well as testing convergent and discriminant validity for the present version of the LS-3 (Study 2, 3, and 4). To that end, the following hypotheses have been tested using the current supported version of the tool (LS-3):
Hypothesis 1: There will be a positive relationship between loneliness and depression, anxiety, stress, and internet addiction; Hypothesis 2: There will be a negative relationship between loneliness and self-esteem; Hypothesis 3: There will be a positive relationship between loneliness and social interaction anxiety.
Study 1: Support for the UCLA Loneliness Scale Version 3’s Italian Long and Short Versions
For the LS-3, the conventional twenty-item version was previously validated in Italy17 using an Exploratory Structural Equation Model (ESEM) in a group of university students. Moreover, two short versions have been proposed14,19 in other countries. The goals of this study were to provide new evidence about the replicability of the 3-factor ESEM solution in the present sample and compare two Confirmatory Factor Analysis (CFA) models of the LS-3’s previous proposed short versions.
Methods
Participants and Procedure
Participants included 1676 Italian speakers with a mean age of 31.15 (SD = 11.89) and a gender balance of 49.5% males and 50.5% females. There were no participants who preferred not to reveal their gender. To avoid missing data, they completed an online survey using a Google Form with a mandatory response format (note that the mandatory response format is a useful instrument for the online survey to avoid missing data. However, it was useful to reflect on the ethical implications of this choice. The Likert 4-point frequency scale could be a non-overly coercive solution for data collection in terms of loneliness rather than a dichotomous answer that forces you to take a clear position (eg, Yes/No). Further considerations are needed). Participants spent an average of 7 minutes responding to the survey. According to our eligibility criteria, Italians aged 18 and up voluntarily participated in the study. Following an explanation of the study’s objectives, all participants provided informed consent.
The research project proposal was carried out in accordance with the Helsinki Declaration, and it was approved by the Kore University of Enna internal review board for psychological research.
The measures were administered in accordance with the privacy guarantee regulations outlined in Legislative Decree No. 196/2003 and the GDPR (EU Regulation No. 2016/679).
Measures
To detect the sample’s sociodemographic characteristics, ad hoc items were developed. The UCLA Loneliness Scale, Version 3 (UCLA-LS)14 was used in its original 20-item form. Its Italian version17 was used, which employs a 4-point Likert scale ranging from 1 (I never feel this way) to 4 (I often feel this way; eg, “I am unhappy doing so many things alone” and “I feel isolated from others”). This measure had high internal consistency (Cronbach’s α = 0.96; Russell, 1996) and a test–retest correlation of 0.73 over a two-month period.
Data Analyses
After preliminary analysis to test the normality of the data,27 we performed an ESEM 3-factor model for the conventional twenty-item version of the LS-3. Secondly, we compared two CFA models to the previous suggested factorial solutions for the short versions of LS-3 (ie, 10-item and 3-item versions). We used the maximum likelihood robust estimator (MLR), which accounts for normality distortions. According to previous research (for a summary, see 28), we reported the goodness-of-fit indices and measurement quality indicators and selected only the models that met the following cut-off critera: non-significant χ2 (ie, p > 0.01); root mean square error of approximation (RMSEA) 0.06–0.08 marginally acceptable and 0.01–0.05 excellent, non-significant (p > 0.01), 90% confidence interval range should not include zero; comparative fit index (CFI) 0.90–0.95 marginally acceptable and 0.96–0.99 excellent; Tucker-Lewis index (TLI) 0.90–0.95 marginally acceptable and 0.96–0.99 excellent; and standardized root mean squared residual (SRMR) 0.06–0.08 marginally acceptable or 0.01–0.05 excellent. Mplus Version 729 was used for the current analyses.
Selected Items for Short Versions
The original 20-item version of the UCLA-LS3 was the starting point for the previous suggested short versions (see Table 1 to read the text of the items). To test both 10-item and 3-item short forms, we referred to the items that were selected in the Japanese version.19 According to this, the 10-item version included the following items from the original version: 2, 6, 10, 11, 13, 14, 15, 18, 19, 20, and the 3-item version included the following items from the original version: 2, 11, 14.
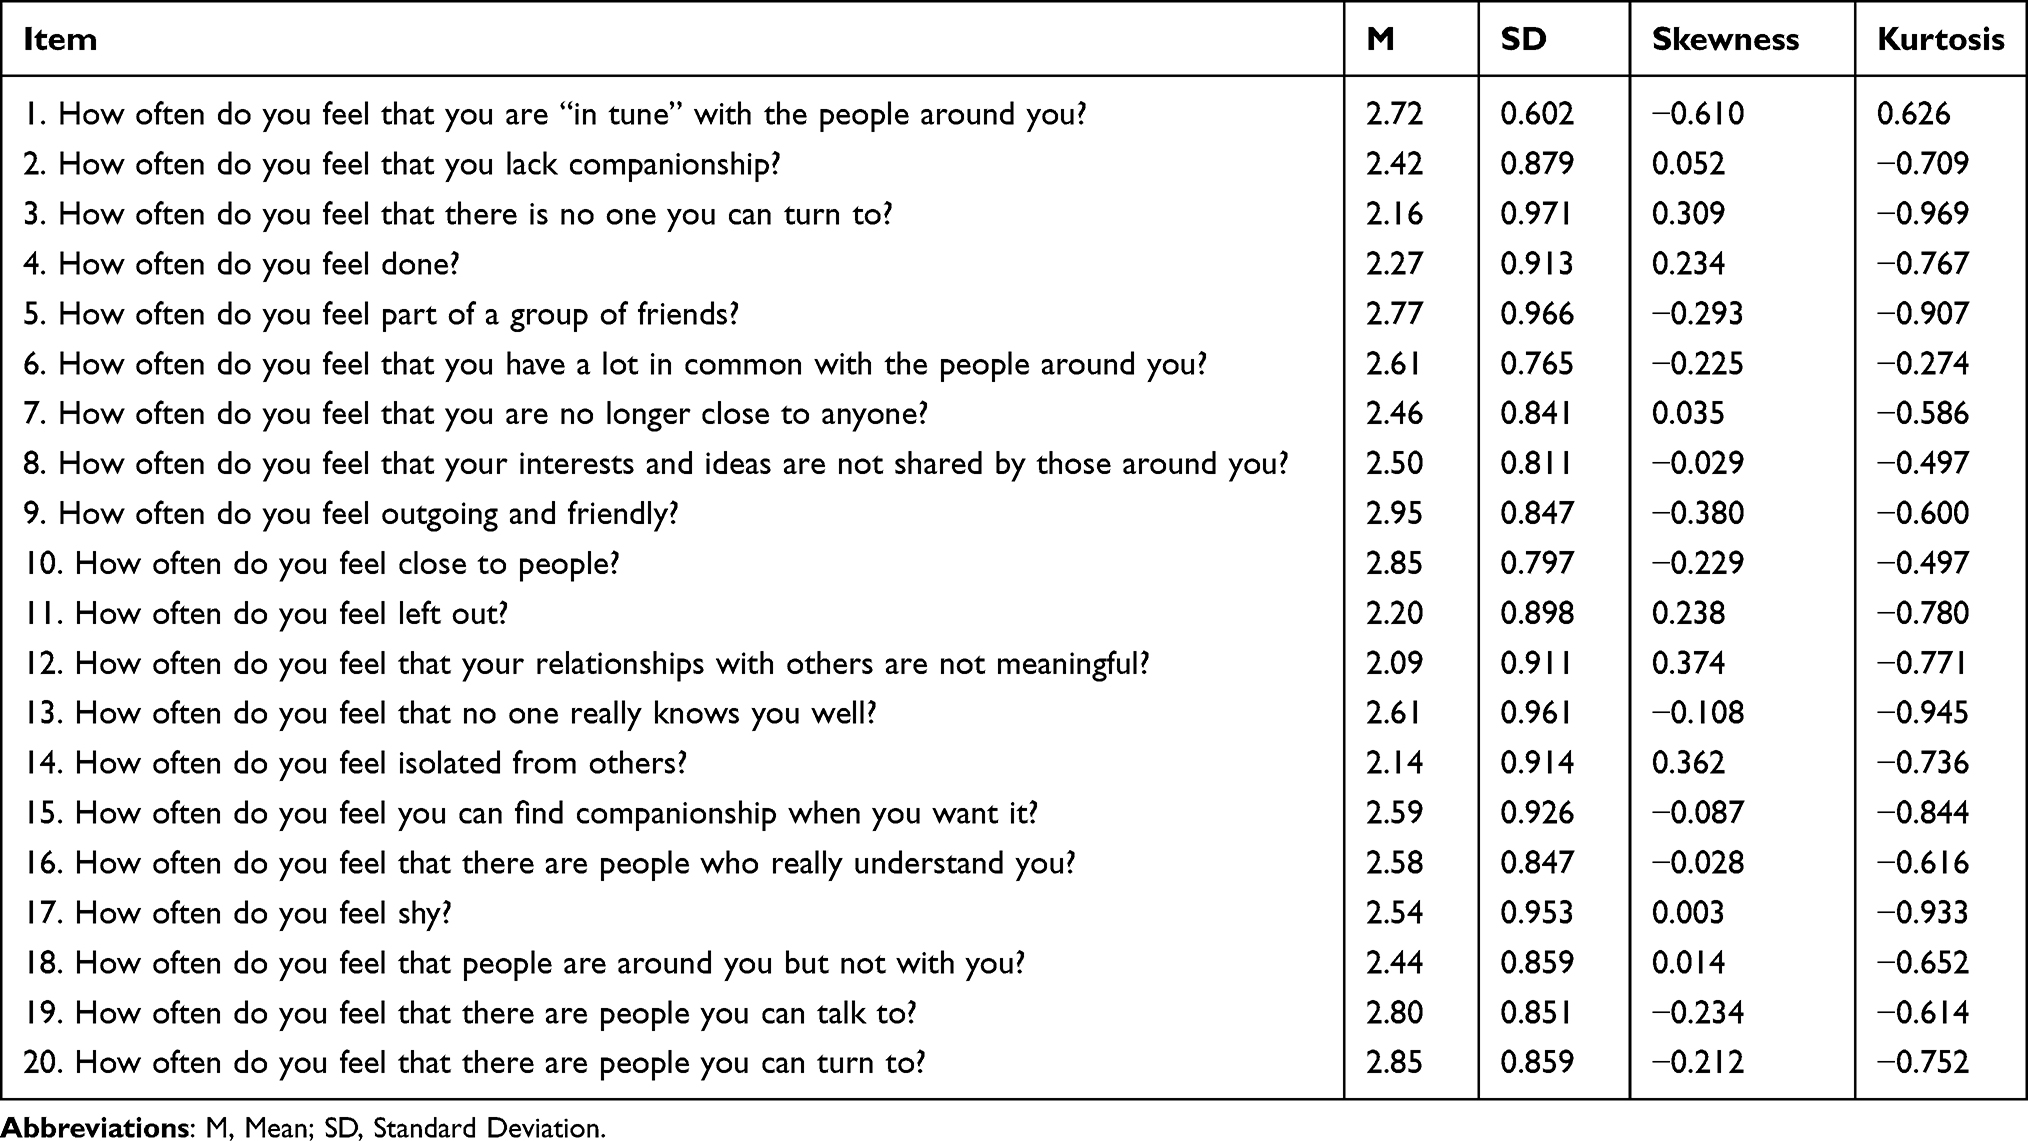 |
Table 1 Descriptive Statistics for the UCLA Loneliness Scale Version 3 |
Results
Preliminary Analyses
Prior to testing the suggested models, the multivariate normality distribution of data was checked through the Mahalanobis distance. Since the Mardia’s coefficient (504.929) exceeded the critical value associated with 21 degrees of freedom (ie, 483), the assumption of multivariate normality was violated (descriptive statistics for each item are in Table 1).
Dimensionality of the LS-3
Firstly, we performed an ESEM 3-factor model (Figure 1) to test the replicability of the previous suggested Italian solution17 in our sample. After deleting the outliers, we replicated the previous model using the Maximum Likelihood (ML) estimator and a Geomin rotation. The G-model (ie, the ESEM 3-factor model using Geomin rotation) showed adequate goodness-of-fit indices (χ2 = 847.597; df = 133; CFI = 0.942; TLI = 0.917; RMSEA = 0.062 [0.058–0.066]; SRMR = 0.028). However, not all target loadings were statistically significant (p < 0.05; Table 2) and the correlations among the latent factors were statistically significant only between the F1 and F2. According to the recent research30,31 that suggested the Target rotation as the preferable choice for the ESEM model with a strong theoretical background in a confirmatory way (ie, in a target rotation, all cross-loadings are targeted to be zero, whereas all of the main loadings are freely estimated), we again performed the T-model (ie, the ESEM 3-factor model using Target rotation). The results showed statistically significant and moderate correlations among all latent factors (Table 2). Furthermore, at item level, the latest solution presented all the statistically significant target loadings (p < 0.001) (Table 2) as well as in the first Italian validation.17 Therefore, our outcomes replicated the previous findings but suggested the use of the Target rotation rather than the Geomin.
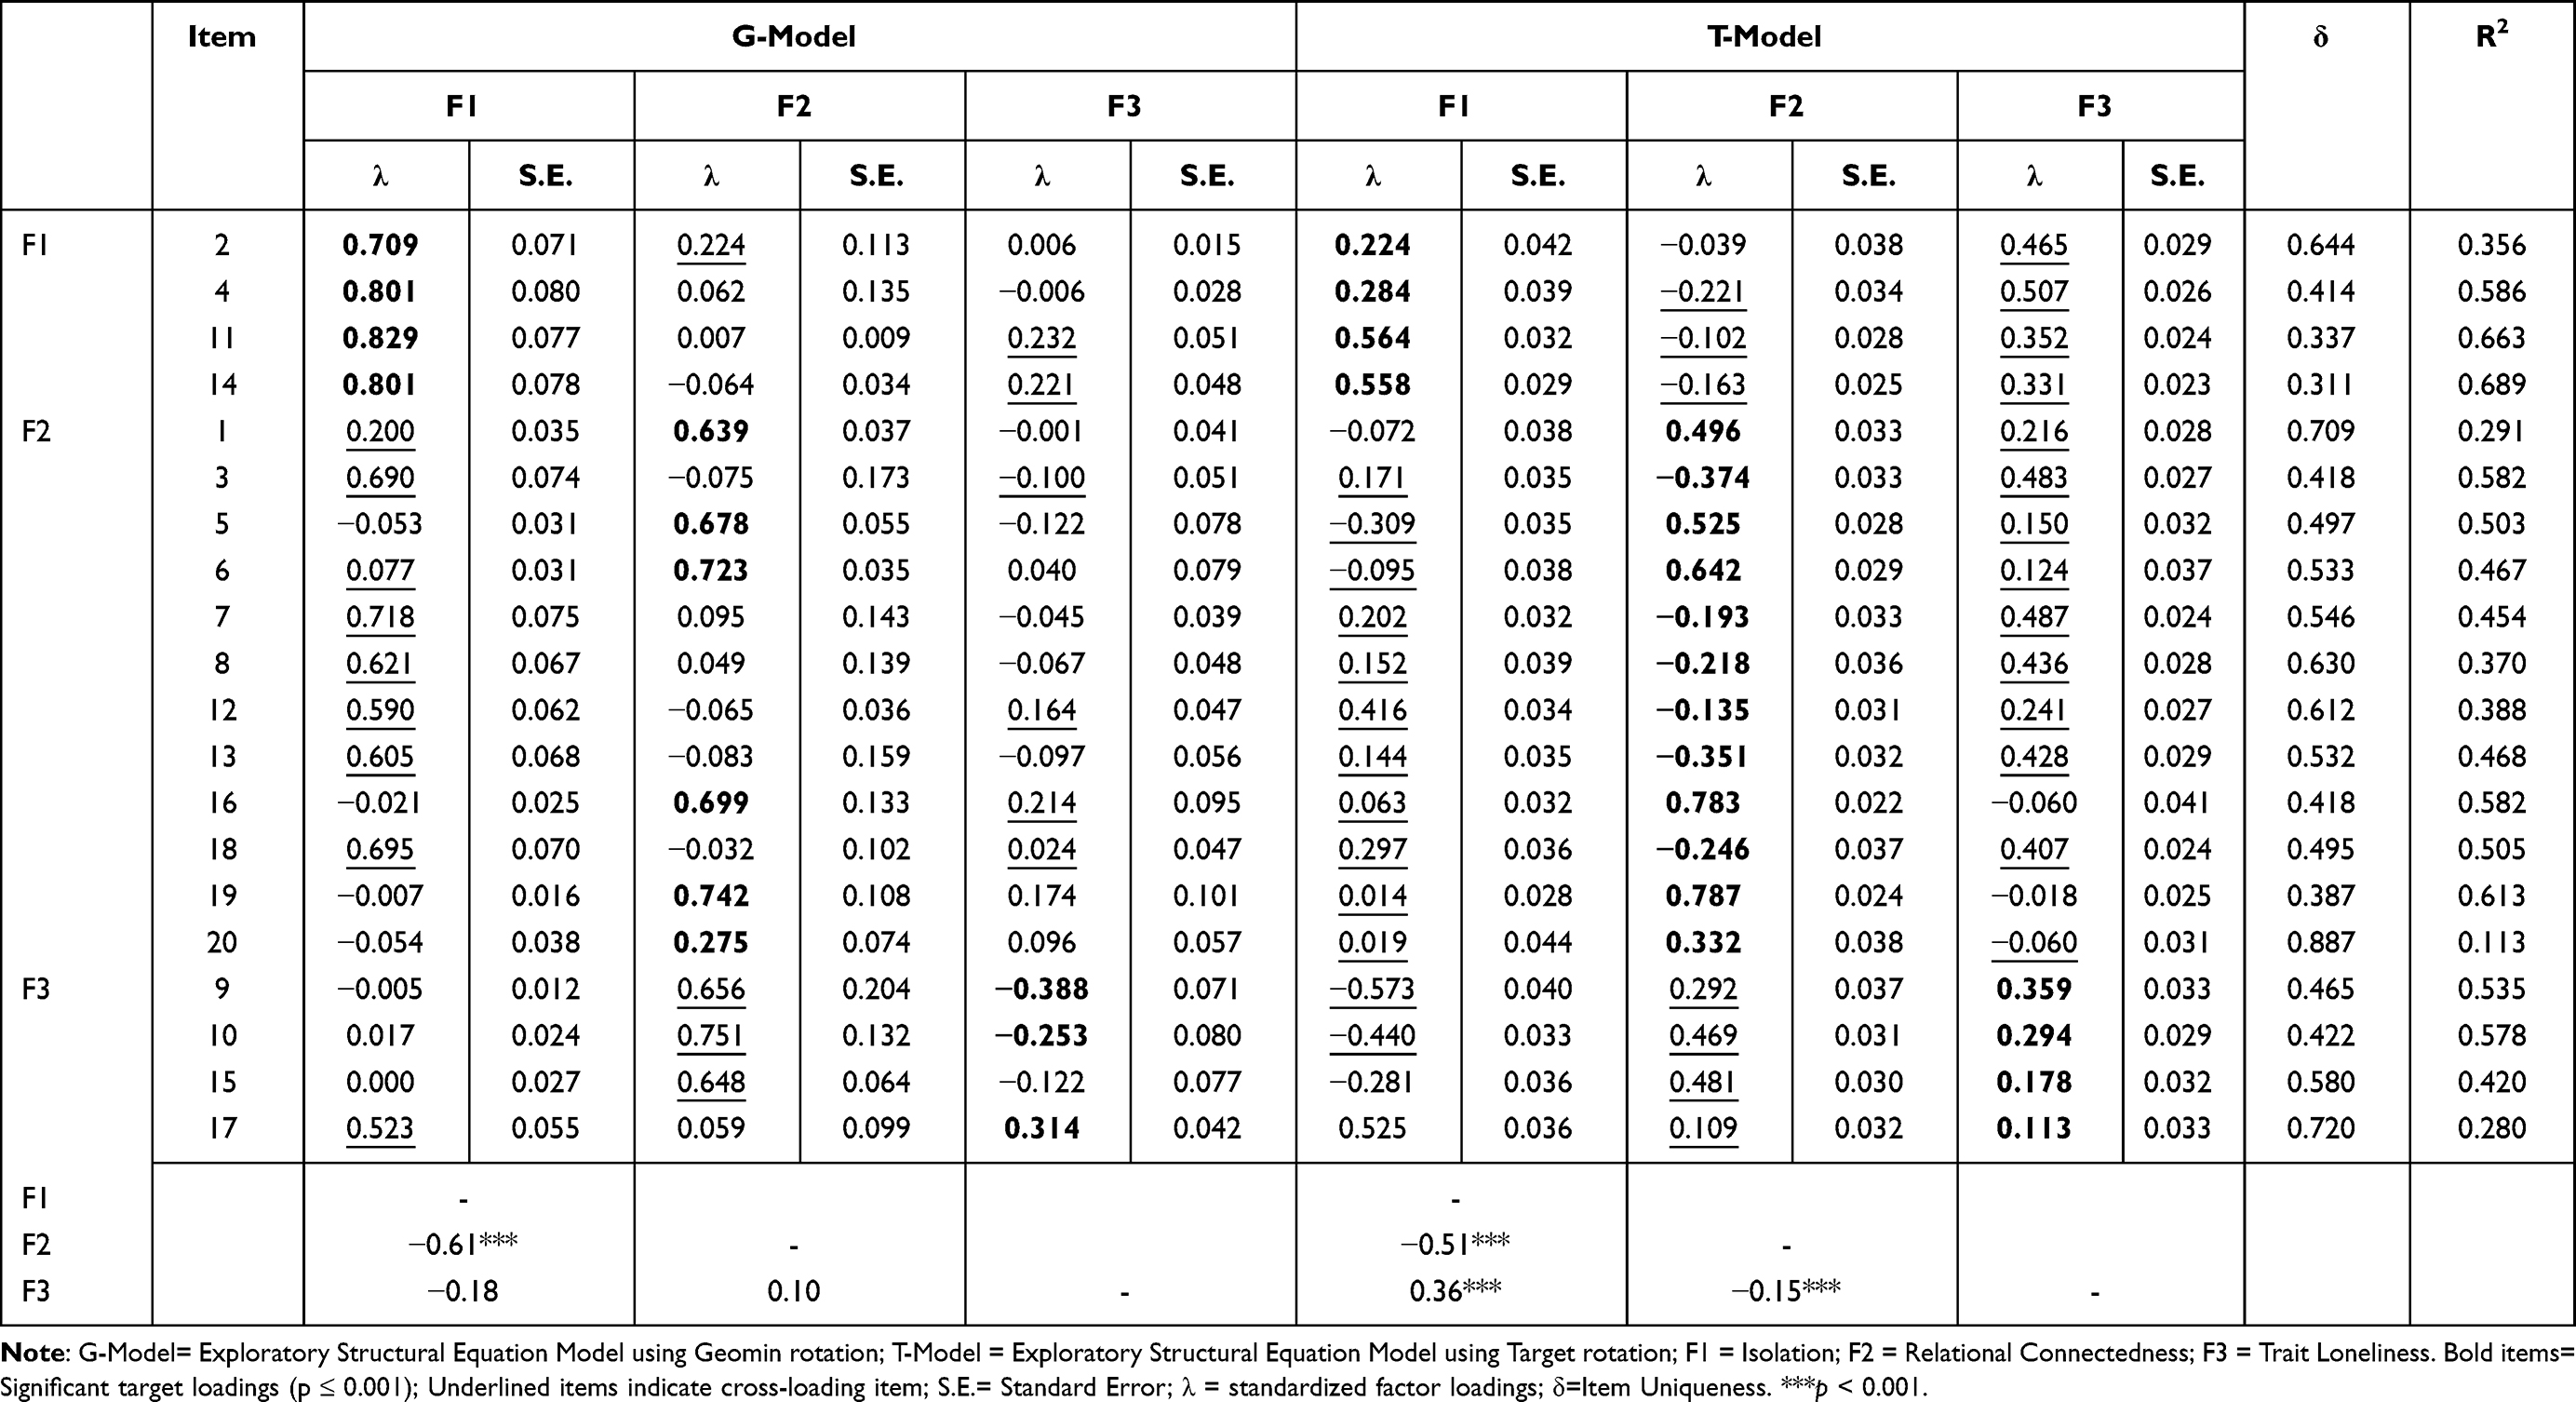 |
Table 2 Standardized Factor Loadings and Correlations Among Factors for the UCLA Loneliness Scale ESEM 20-Item Version |
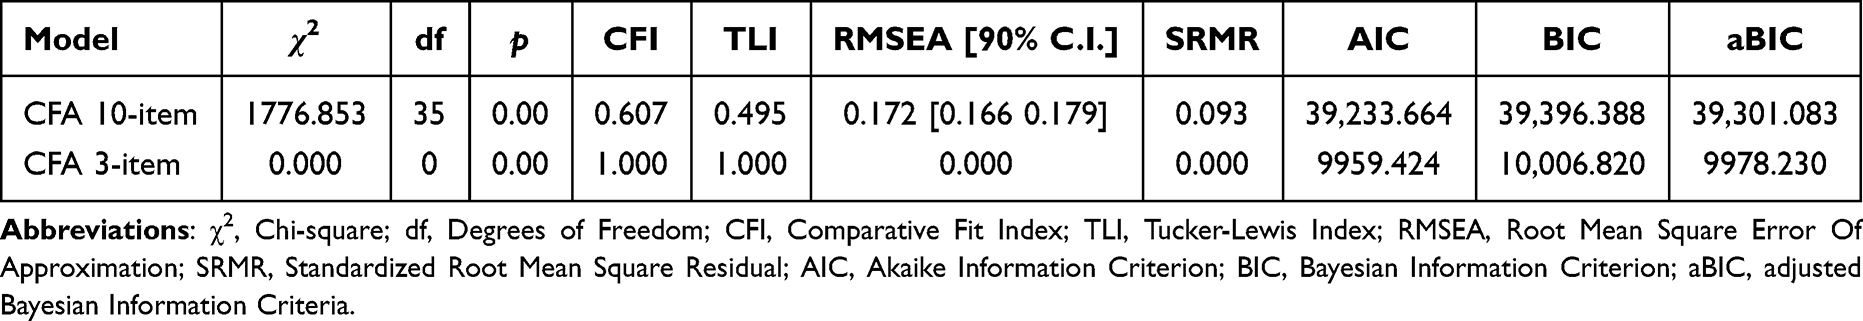 |
Table 3 Fit Indices of Examined UCLA Loneliness Scale Brief Versions Models |
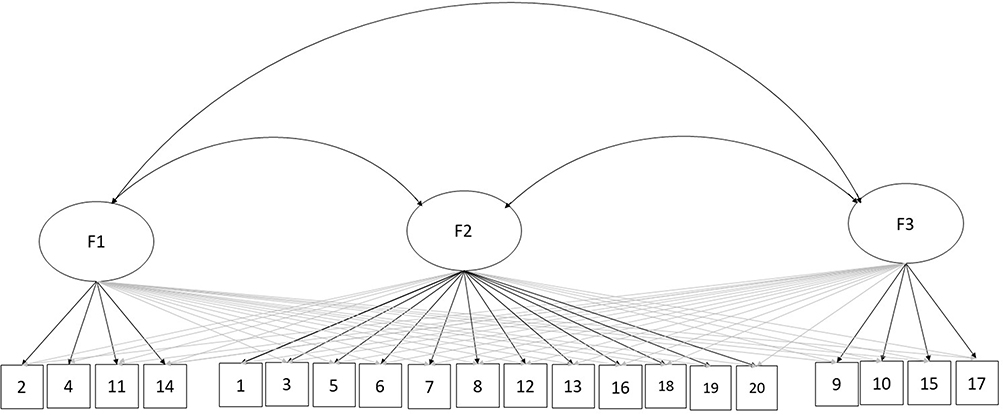 |
Figure 1 Exploratory Structural Equation Model for the 20-item UCLA Loneliness Scale-3 version. Notes: F1, Isolation; F2, Relational Connectedness; F3, Trait Loneliness. |
Secondly, we estimated two CFA models based on previous evidence about the LS-3 short versions. The 10-item short version did not meet acceptability thresholds in fit indices (χ2 = 1776.853; df = 35; CFI = 0.607; TLI = 0.495; RMSEA = 0.172 [0.166–0.179]; SRMR = 0.093; Table 3). However, the 3-item version (LS-3SV) previously proposed by Arimoto and colleagues19 meets the criteria (x2 = 0; df = 0; CFI = 1.00; TLI = 1.00; RMSEA = 0; SRMR = 0; Figure 2).
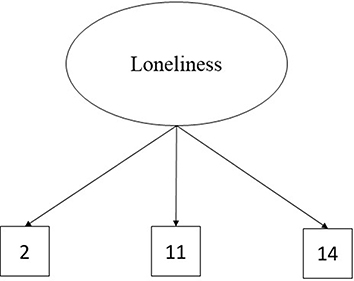 |
Figure 2 Confirmatory Factor Analysis for the UCLA Loneliness Scale-3 3-item Short Version. |
As further confirmation, despite the first model did not meet the criteria, the comparison between models suggested that the model with the lowest chi-square, highest CFI and TLI, and lowest values in AIC, BIC, and aBIC should be the better choice4,28 as well as our 3-item version. Furthermore, all loadings had good values (λ = 0.35, 0.89, 0.79, respectively), according to the threshold criteria (λ > 0.30) and greater than the correspondent in the 10-item version (Table 4). The Cronbach’s alpha of the latter was 0.33, which is not an acceptable value; on the other hand, the Cronbach’s alpha for the LS-3SV was 0.70, which showed adequate reliability. However, it is fundamental to consider the implications of a saturated model as well as the 3-item version. These results appeared strange at first glance: the absence of degrees of freedom (df = 0) indicated a saturated model32 where the number of estimated parameters is equal to the number of data points. Additionally, the value of the chi-square is to be read together with the degrees of freedom; in summary, greater constraints on the model correspond to a lower chi-square value and consequently lower degrees of freedom. In our case, we have a saturated model, and therefore these considerations are taken to the extreme (χ2 = 0). The CFI index was also in line with the Japanese version. In summary, our findings replicate the Japanese results, but our methodological considerations did not support the use of the 3-item version: a saturated model can be considered useless because it has no explanatory power and it is not falsifiable as a natural consequence of its perfect goodness-of-fit indices.
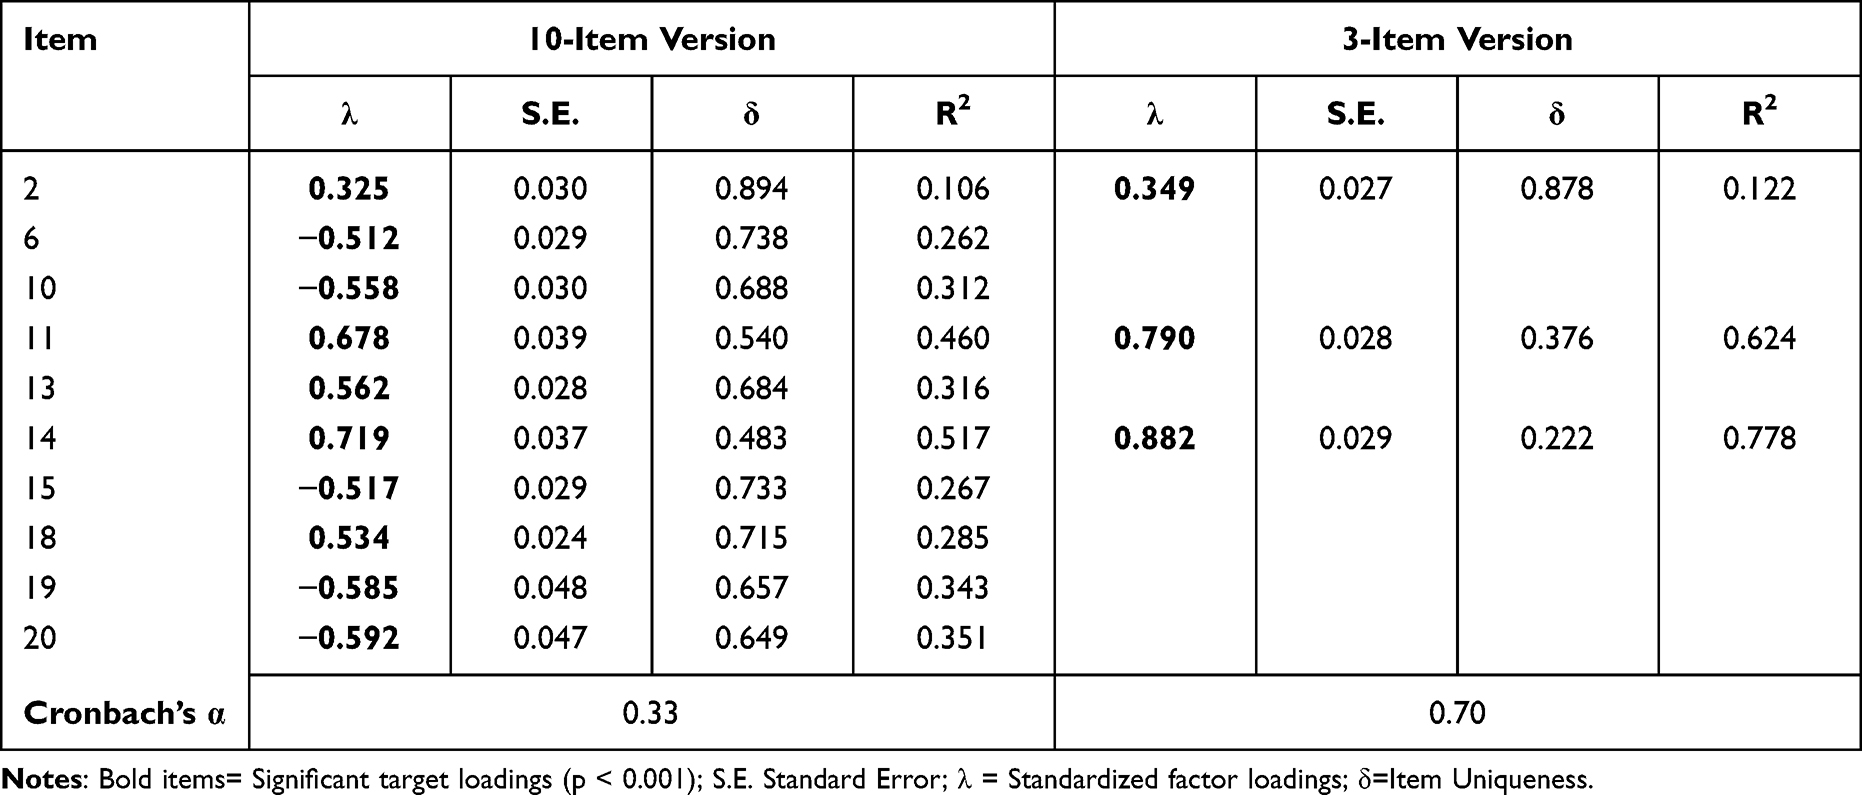 |
Table 4 Standardized Factor Loadings and Reliability of the Loneliness Scale Short Versions |
Convergent Validity Evidence for LS-3
Study 2: Evidence Based on Relations Between Loneliness and Depression, Anxiety, Stress, Internet Addiction
Following a review of the literature, loneliness was found to have significant relationships with other variables.22,24,25,33 We investigated its relationship with depression, anxiety, stress, and internet addiction to test the LS-3’s convergent validity.
Method
Participants and Procedures
The current study included 1445 Italian speakers with an average age of 30.91 (SD = 11.76). They were gender balanced (50.2% males, 49.8% females). To avoid missing data, they completed an online survey using a Google Form with a mandatory response format. Participants spent an average of 15 minutes responding to the survey. See Study 1 for more information on ethics and procedures.
Measures
Based on the findings of Studies 1, we used the LS-3 for our analyses in Study 2. We administered the following psychometric instruments after collecting socio-demographic information via ad hoc questions:
Stress, Anxiety, and Depression
We used the Depression Anxiety Stress Scales-21 (DASS-21)34 in its Italian version35 to assess stress, anxiety, and depression. The 21-item self-reported scale (eg, “I felt a lot of tension and I had difficulty recovering a state of calm”, “I just couldn’t feel any positive emotions”, and “I felt stressed out”) employs a 4-point Likert scale ranging from 0 (never happens to me) to 3 (it almost always happens to me). Each subscale had good internal consistency and temporal stability (Anxiety Cronbach’s α = 0.74; Depression Cronbach’s α = 0.82; Stress Cronbach’s α = 0.85). All of the subscales in the current sample demonstrated good internal consistency (Anxiety Cronbach’s α = 0.86; Depression Cronbach’s α = 0.92; Stress Cronbach’s α = 0.91).
Internet Addiction
The Internet Addiction Test (IAT)36 is a pioneering psychological instrument for assessing Internet Addiction that was developed in a 8-item first version in accordance with the DSM-IV (Diagnostic and Statistical Manual of Mental Disorders-4th edition) criteria for pathological gaming. Next, the authors37 proposed an expanded version with 20 items (eg, “Do people around you complain about the amount of time you spend online?”, “Are your performance at work or your productivity affected negatively by the Internet?”) that assesses the disorder’s severity on a 5-point Likert scale ranging from 0 (not at all) to 5 (always). In the current study, we used the Italian version38 which demonstrated good psychometric properties, including for the two-factor solution (Cronbach’s α = 0.88 and Cronbach α = 0.79 for the Italian version, respectively, and Cronbach’s α = 0.94 for the present sample).
Data Analyses
First, we performed a sensitivity analysis to estimate the minimum effect-size of our results. We also performed a series of Pearson’s correlations to study the validity of the LS-3. SPSS v.25 (IBM, 2017) software was used for correlations and G*Power 3.1 for sensitivity analysis.
Results
Preliminary sensitivity analysis estimated a minimum effect size of 0.06 for our total sample size (N = 1445; α = 0.05, power = 0.80). The correlations between LS-3 and anxiety, depression, stress, and internet addiction were all significant (p < 0.01) and positive (r = 0.39, 0.59, 0.44, 0.42, respectively; Table 5). As a result, high levels of loneliness are related with high levels of mood disturbance and problematic internet use.
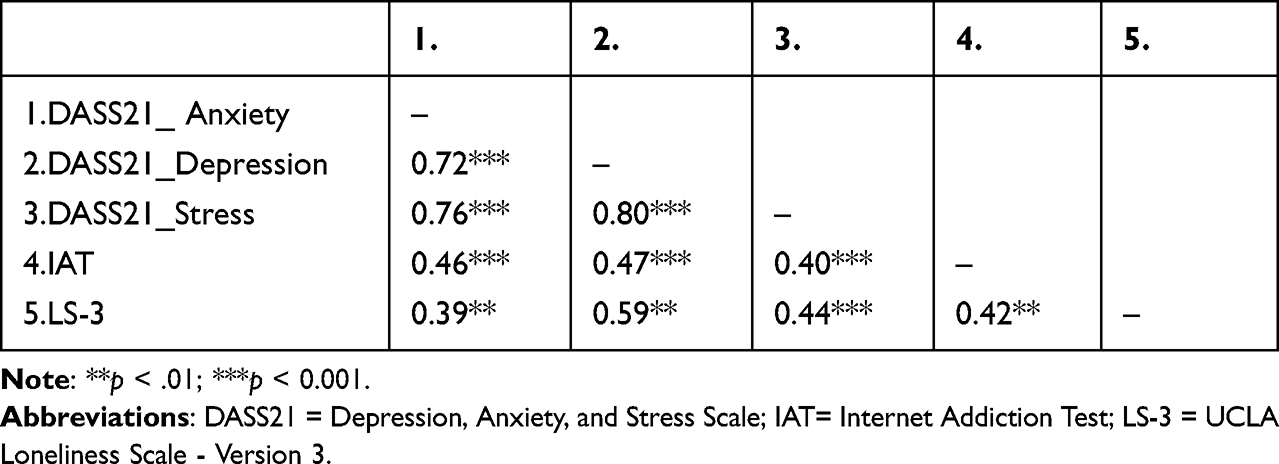 |
Table 5 Correlations Between Loneliness and Other Variables (N = 1445) |
Study 3: Evidence Based on Relations Between Loneliness and Social Interaction Anxiety
According to previous findings,33 loneliness has a positive relationship with social anxiety symptoms. Therefore, to test the convergent validity of LS-3, we investigated its relationship with social interaction anxiety.
Method
Participants and Procedures
The current study included 1093 Italian speakers with an average age of 31.26 (SD = 11.67). Participants were roughly gender balanced (48.6% males; 51.4% females). There were no participants who preferred not to reveal their gender. Participants spent an average of 6 minutes responding to the survey. See Study 1 for more details.
Measures
Based on the findings of Study 1, we chose the LS-3 for our analyses in Study 3. We collected socio-demographic information using ad hoc items; additionally, we administrated the Social Interaction Anxiety Scale (SIAS),39 a 20-item measure used to assess anxiety when engaging in social interactions (eg, “It makes me uncomfortable to meet an acquaintance on the street”, “It’s hard for me to chat with other people”). Respondents are asked to rate their social interaction anxiety on a 4-point Likert scale; the total score reflects the severity of social interaction anxiety (Cronbach’s α = 0.86 for the original version and Cronbach’s α = 0.79 for the present sample). The SIAS Italian version was used in this study.40
Data Analyses
See Study 2.
Results
For our total sample size (N = 1093; α = 0.05, power = 0.80), preliminary sensitivity analysis estimated an effect size of 0.07. The correlation between loneliness and social interaction anxiety showed positive statistically significant association (r = 0.40, p < 0.01).
Discriminant Validity Evidence for LS-3
Study 4: Evidence Based on Relations Between Loneliness and Self-Esteem
According to the literature review, loneliness had a significant relationship with self-esteem. Based on previous findings,26 we studied this association to test the discriminant validity of LS-3.
Method
Participants and Procedures
The current study included 975 Italian speakers with an average age of 30.27 (SD = 11.83). They were roughly gender balanced (48.5% males, 51.5% females). There were no participants who preferred not to reveal their gender. Participants spent an average of 6 minutes responding to the survey. See Study 1 for more details.
Measures
Based on the findings of Study 1, we chose the LS-3 for our analyses in Study 4. We also administrated the Rosenberg Self-Esteem Scale (RSES).41 The RSES is a 10-item (eg, “I think I have a number of qualities” and “I guess I don’t have much to be proud of”) self-reported scale with a 4-point Likert scale ranging from 1 (strongly agree) to 4 (strongly disagree). We used its Italian version,42 which showed good internal coherency (Cronbach’s α = 0.84). Cronbach’s α for the RSES in this study was 0.91.
Data Analyses
See Study 2.
Results
Preliminary sensitivity analysis estimated a minimum effect size of 0.08 for our total sample size (N = 975; α = 0.05, power = 0.80). Loneliness and self-esteem had a negative correlation that was statistically significant but small (r = −0.54, p < 0.01).
Discussion
The present study sought to replicate the previous Italian validation and reflect on the short forms of the UCLA Loneliness Scale Version 3 based on previous research14,19 (ie, ten-and three- item versions). In Study 1, we estimated the ESEM 3-factor model in our sample, which improved the generalizability of the results in a group of Italian adult speakers and not only in university students, as well as in the first published validation, and supported the previous findings. However, according to the recent suggestions,30,31 which encouraged the use of the Target rotation in well-theoretically defined models, we compared the Geomin and Target rotations in favor of the latter. Indeed, this solution provided statistically significant target loadings as well as in previous research.17 Moreover, the target solution showed significant correlations among latent factors. As a psychometric implication, the evolution of the innovative ESEM approach could bring further improvements to the instrument’s theory. Secondly, we estimated the two CFA models, and the LS-3 fit-indices were satisfactory. Indeed, the 3-item version showed better goodness-of-fit indices than the 10-item version; specifically, the latter did not meet the criteria. Furthermore, according to the conventional golden rules4,28 for the comparisons of the Structural Equation Models, the incremental fit indices (ie, CFI and TLI) showed higher values ― similar to those reported in the Japanese version―and the information criteria (ie, AIC, BIC, and aBIC) showed lower values for the 3-item version. At item level, all loadings are greater than the threshold (λ > 0.30) and significantly higher than the corresponding 10-item version. Ultimately, the Cronbach’s alpha showed the superiority of the 3-item version, which was the only one to exceed the threshold (α = 0.70) as well as the Japanese version (α = 0.72). However, despite our findings replicating the Japanese version, this saturated model32 using a CFA approach cannot be supported. Its perfect goodness-of-fit indices make the model useless due to its non-falsifiability.
In Studies 2, 3, and 4, we examined the associations between loneliness and related constructs to explore the convergent and discriminant validity of our purposed short version. Initially, all sensitivity analyses supported the detection of a relatively large minimum detectable effect size. These findings demonstrate correlation analysis’s ability to detect large effects. In particular, in Study 1, we found that loneliness was positively correlated with anxiety, depression, and stress symptoms, which was consistent with both our hypothesis 1 and previous research.22,24,25,33 As a viable interpretation, loneliness may exacerbate mood disturbance, which may encourage social withdrawal or vice versa. Based on this attainable explanation, opportunities for socialization should be prioritized in modern society1 that is often oriented to self-affirmation in order to promote healthier lifestyles. Moreover, although in modern societies many social contacts are carried out online, recent research has shown that despite online contacts help to reduce feelings of loneliness, this socialization strategy is little used by people who feel lonely.43 Furthermore, loneliness was found to be associated with internet addiction in Study 2, supporting our hypothesis 2 and recent research.25 As one possible interpretation, online surfing behavior may reduce the likelihood of social contact or vice versa. As a result, when behavior becomes additive, social life may be jeopardized, resulting in a vicious cycle that may exacerbate loneliness.25 The clinical implication could be very hard: the loneliness combined with discouragement and/or the loss of hope that things will ever be different (ie, fatalism),44 helplessness, a sense of failure, and dysphoria can lead to demoralization45 (ie, a clearly defined syndrome of existential distress that affected people with physical or psychiatric illness), which recently emerged as a risk factor for suicide ideation or behavior.46 In Study 3, we found that high levels of loneliness were associated with high levels of social interaction anxiety, which was consistent with our hypothesis 3 and previous research.6 As a practical implication, patients suffering from social anxiety should be encouraged to engage in interpersonal interaction in safe environments. For example, a group psychotherapeutic setting could help people overcome loneliness by reducing anxiety.
Finally, in Study 4, we studied the relationship between loneliness and self-esteem. According to our hypothesis 2 and previous research,26 high levels of loneliness are moderately related to low levels of self-esteem. As a plausible explanation, lonely people may perceive themselves as unworthy of affection and, as a result, devalue themselves. Other thoughts, on the other hand, may cause people to withdraw from others, such as thinking they are superior or being overly focused on themselves. As a result, these likely thoughts would not necessarily result in a decrease in self-esteem. Based on this consideration, a low correlation can be an indicator of other possible intervening factors that make studying the motivations for loneliness difficult.
Limitation and Implications for Further Research
The current findings should be interpreted in light of some limitations. First, the online survey provided a convenient but not perfectly standardized administration procedure (eg, participants could be in the most disparate places during the response procedure). However, our sensitivity analysis mitigated this problem by making a statistical inference on the effect size based on our sample size. Furthermore, more information about the sample’s socio-demographic characteristics should be gathered to improve the generalizability of the results. Additionally, the presence of different samples made it difficult to compare the findings of convergent and discriminant validity and forced us to present the results separately to avoid biases. Moreover, at the statistical level and using the CFA approach, we did not consider it appropriate to support the use of a short version of the tool; further research should build new short forms that may be extremely useful in clinical contexts such as hospital triage, where speed is critical to quickly detect risk factors, or, in research practice, to avoid the fatigue and consequent poor quality of the collected data. For example, the Item Response Theory Approach could offer new directions to develop more accurate short forms.47 Thereafter, comparisons between clinical and non-clinical groups (eg, patients suffering from neuropsychological issues affecting the attention process) may be useful in order to check for adverse impact.48 Finally, a test-retest study to assess reliability in terms of temporal stability is planned for future research.
Conclusions
The current study provided evidence about the psychometric properties of the short version of the LS-3 in a sample of Italian adults. Expanding the validity of a tool with a larger sample (not only university students) is a resource for its dissemination. At the clinical level, it makes it easier to design tests that may be administered to the general population without the risk of bias. On a research level, it is important to increase knowledge about its convergent and discriminant validity in relation to various psychological constructs. Ultimately, the LS-3 Italian version is a useful psychometric tool to assess loneliness that uses a challenger approach (ie, ESEM); new short forms that take into account the discussed methodological issues should be developed.
Ethics
Approved by the Internal Review Board of UKE – University Kore Enna.
Funding
No financial support was received for this study.
Disclosure
The authors declare no conflict of interest.
References
1. Jeste DV, Lee EE, Cacioppo S. Battling the modern behavioral epidemic of loneliness: suggestions for research and interventions. JAMA Psychiatry. 2020;77(6):553–554. doi:10.1001/jamapsychiatry.2020.0027
2. Cacioppo JT, Cacioppo S. The growing problem of loneliness. Lancet. 2018;391(10119):426. doi:10.1016/s0140-6736(18)30142-9
3. Perlman D, Peplau L. Toward a social psychology of loneliness. Personal Relationships. 1981;3:31–56.
4. Lt H, Bentler PM. Cutoff criteria for fit indexes in covariance structure analysis: conventional criteria versus new alternatives. Structural Equ Modeling. 1999;6(1):1–55. doi:10.1080/10705519909540118
5. Baumeister RF, Leary MR. The need to belong: desire for interpersonal attachments as a fundamental human motivation. Psychol Bull. 1995;117:497–529. doi:10.1037/0033-2909.117.3.497
6. Lim MH, Eres R, Vasan S. Understanding loneliness in the twenty-first century: an update on correlates, risk factors, and potential solutions. Soc Psychiatry Psychiatr Epidemiol. 2020;55(7):793–810. doi:10.1007/s00127-020-01889-7
7. Cacioppo JT, Cacioppo S. Chapter Three - Loneliness in the Modern Age: an Evolutionary Theory of Loneliness (ETL). In: Olson JM, editor. Advances in Experimental Social Psychology. Academic Press; 2018:127–197.
8. Barreto M, Victor C, Hammond C, Eccles A, Richins MT, Qualter P. Loneliness around the world: age, gender, and cultural differences in loneliness. Pers Individ Dif. 2021;169:110066. doi:10.1016/j.paid.2020.110066
9. Surkalim DL, Luo M, Eres R, et al. The prevalence of loneliness across 113 countries: systematic review and meta-analysis. BMJ. 2022:e067068. doi:10.1136/bmj-2021-067068
10. Buecker S, Mund M, Chwastek S, Sostmann M, Luhmann M. Is loneliness in emerging adults increasing over time? A preregistered cross-temporal meta-analysis and systematic review. Psychol Bull. 2021;147(8):787–805. doi:10.1037/bul0000332
11. Robinson JP, Shaver PR, Wrightsman LS. Measures of Personality and Social Psychological Attitudes. Vol. 1. CA: Academic; 1991.
12. Russell D, Peplau LA, Ferguson ML. Developing a measure of loneliness. J Pers Assess. 1978;42(3):290–294. doi:10.1207/s15327752jpa4203_11
13. Russell D, Peplau LA, Cutrona CE. The revised UCLA Loneliness Scale: concurrent and discriminant validity evidence. J Pers Soc Psychol. 1980;39(3):472–480. doi:10.1037//0022-3514.39.3.472
14. Russell DW. UCLA Loneliness Scale (Version 3): reliability, validity, and factor structure. J Pers Assess. 1996;66(1):20–40. doi:10.1207/s15327752jpa6601_2
15. Dussault M, Fernet C, Austin S, Leroux M. Revisiting the factorial validity of the revised UCLA Loneliness Scale: a test of competing models in a sample of teachers. Psychological Reports. 2009;105(3):849–856. doi:10.2466/pr0.105.3.849-856
16. Durak M, Senol-Durak E. Psychometric qualities of the UCLA Loneliness Scale-Version 3 as applied in a Turkish culture. Educ Gerontol. 2010;36(10–11):988–1007. doi:10.1080/03601271003756628
17. Boffo M, Mannarini S, Munari C. Exploratory structure equation modeling of the UCLA Loneliness Scale: a contribution to the Italian adaptation. TPM-Testing Psychometrics Methodol Appl Psychol. 2012;19:345–363 doi:10.4473/TPM19.4.7.
18. Zarei S, Memari AH, Moshayedi P, Shayestehfar M. Validity and reliability of the UCLA loneliness scale version 3 in Farsi. Educ Gerontol. 2016;42(1):49–57. doi:10.1080/03601277.2015.1065688
19. Arimoto A, Tadaka E. Reliability and validity of Japanese versions of the UCLA loneliness scale version 3 for use among mothers with infants and toddlers: a cross-sectional study. BMC Women’s Health. 2019;19(1):105. doi:10.1186/s12905-019-0792-4
20. Kemper CJ, Trapp S, Kathmann N, Samuel DB, Ziegler M. Short versus long scales in clinical assessment: exploring the trade-off between resources saved and psychometric quality lost using two measures of obsessive–compulsive symptoms. Assessment. 2019;26(5):767–782. doi:10.1177/1073191118810057
21. Borawski D. Authenticity and rumination mediate the relationship between loneliness and well-being. Curr Psychol. 2021;40(9):4663–4672. doi:10.1007/s12144-019-00412-9
22. Erzen E, Çikrikci Ö. The effect of loneliness on depression: a meta-analysis. The International Journal of Social Psychiatry. 2018;64(5):427–435. doi:10.1177/0020764018776349
23. Holwerda TJ, van Tilburg TG, Deeg DJH, et al. Impact of loneliness and depression on mortality: results from the Longitudinal Ageing Study Amsterdam. Br J Psychiatry. 2016;209(2):127–134. doi:10.1192/bjp.bp.115.168005
24. Yarcheski A, Mahon NE, Yarcheski TJ. Stress, hope, and loneliness in young adolescents. Psychological Reports. 2011;108(3):919–922. doi:10.2466/02.07.09.Pr0.108.3.919-922
25. Moretta T, Buodo G. Problematic internet use and loneliness: how complex is the relationship? A short literature review. Curr Addiction Rep. 2020;7(2):125–136. doi:10.1007/s40429-020-00305-z
26. Dembińska A, Kłosowska J, Ochnik D. Ability to initiate relationships and sense of loneliness mediate the relationship between low self-esteem and excessive internet use. Curr Psychol. 2022;41(9):6577–6583. doi:10.1007/s12144-020-01138-9
27. Misuraca R, Teuscher U and Faraci P. Is more choice always worse? Age differences in the overchoice effect. Journal of Cognitive Psychology. 2016;28(2):242–255. doi:10.1080/20445911.2015.1118107
28. van Zyl LE, Ten Klooster PM. Exploratory structural equation modeling: practical guidelines and tutorial with a convenient online tool for Mplus. Front Psychiatry. 2021;12:795672. doi:10.3389/fpsyt.2021.795672
29. Muthén LK, Muthén BO. Mplus User’s Guide (7th ed). CA Muthén & Muthén.; 2012.
30. Alamer A, Marsh H. Exploratory structural equation modeling in second language research: an applied example using the dualistic model of passion. Studies Second Language Acquisition. 2022;44(5):1477–1500. doi:10.1017/S0272263121000863
31. Marsh HW, Morin AJS, Parker PD, Kaur G. Exploratory structural equation modeling: an integration of the best features of exploratory and confirmatory factor analysis. Annual Review of Clinical Psychology. 2014;10(1):85–110. doi:10.1146/annurev-clinpsy-032813-153700
32. Raykov T, Marcoulides GA, Patelis T. Saturated versus just identified models: a note on their distinction. The Prostate. 2013;73(1):162–168. doi:10.1177/0013164412457367
33. Lim MH, Rodebaugh TL, Zyphur MJ, Gleeson JF. Loneliness over time: the crucial role of social anxiety. J Abnorm Psychol. 2016;125(5):620–630. doi:10.1037/abn0000162
34. Lovibond SH, Lovibond PF. Depression Anxiety Stress Scales (DASS--21, DASS--42). APA PsycTests. 1995;32:134.
35. Bottesi G, Ghisi M, Altoè G, Conforti E, Melli G, Sica C. The Italian version of the depression anxiety stress scales-21: factor structure and psychometric properties on community and clinical samples. Compr Psychiatry. 2015;60:170–181. doi:10.1016/j.comppsych.2015.04.005
36. Young KS. Psychology of computer use: XL. Addictive use of the Internet: a case that breaks the stereotype. Psychol Rep. 1996;79(3 Pt 1):899–902. doi:10.2466/pr0.1996.79.3.899
37. Young KS. Internet addiction: the emergence of a new clinical disorder. CyberPsychology Behav. 1998;1(3):237–244. doi:10.1089/cpb.1998.1.237
38. Faraci P, Craparo G, Messina R, Severino S. Internet Addiction Test (IAT): which is the best factorial solution? J Med Internet Res. 2013;15(10):e225. doi:10.2196/jmir.2935
39. Mattick RP, Clarke JC. Development and validation of measures of social phobia scrutiny fear and social interaction anxiety. Behavior Res Therapy. 1998;36(4):455–470. doi:10.1016/s0005-7967(97)10031-6
40. Sica C, Musoni I, Bisi B, Lolli V, Sighinolfi C. Social phobia scale e social interaction anxiety scale: traduzione e adattamento italiano. Bollettino Di Psicologia Applicata. 2007;252(59):65.
41. Rosemberg M. Society and the Adolescent Self- Image. Vol Revised Version. Wesleyan University Press; 1989.
42. Prezza M, Trombaccia FR, Armento L. The Rosenberg Self-Esteem Scale: Italian translation and validation. Scandinavian J Gastroenterol Suppl. 1997;223:35–44.
43. van Breen JA, Kutlaca M, Koç Y, et al. Lockdown lives: a longitudinal study of inter-relationships among feelings of loneliness, social contacts, and solidarity during the COVID-19 lockdown in early 2020. Pers Soc Psychol Bull. 2021;48(9):1315–1330. doi:10.1177/01461672211036602
44. Valenti GD, Faraci P. Identifying predictive factors in compliance with the COVID-19 containment measures: a mediation analysis. Psychol Res Behav Manag. 2021;14:1325–1338. doi:10.2147/prbm.s323617
45. Clarke DM, Kissane DW. Demoralization: its phenomenology and importance. Aust N Z J Psychiatry. 2002;36(6):733–742. doi:10.1046/j.1440-1614.2002.01086.x
46. Costanza A, Vasileios C, Ambrosetti J, et al. Demoralization in suicide: a systematic review. J Psychosom Res. 2022;157:110788. doi:10.1016/j.jpsychores.2022.110788
47. Igarashi T. Development of the Japanese version of the three-item loneliness scale. BMC Psychol. 2019;7:
48. Faraci P, Lock M, Wheeler R. Assessing leadership decision-making styles: psychometric properties of the Leadership Judgement Indicator. Psychol Res Behav Manag. 2013;6:117–123. doi: 10.2147/PRBM.S53713
 © 2023 The Author(s). This work is published and licensed by Dove Medical Press Limited. The full terms of this license are available at https://www.dovepress.com/terms.php and incorporate the Creative Commons Attribution - Non Commercial (unported, v3.0) License.
By accessing the work you hereby accept the Terms. Non-commercial uses of the work are permitted without any further permission from Dove Medical Press Limited, provided the work is properly attributed. For permission for commercial use of this work, please see paragraphs 4.2 and 5 of our Terms.
© 2023 The Author(s). This work is published and licensed by Dove Medical Press Limited. The full terms of this license are available at https://www.dovepress.com/terms.php and incorporate the Creative Commons Attribution - Non Commercial (unported, v3.0) License.
By accessing the work you hereby accept the Terms. Non-commercial uses of the work are permitted without any further permission from Dove Medical Press Limited, provided the work is properly attributed. For permission for commercial use of this work, please see paragraphs 4.2 and 5 of our Terms.