Back to Journals » Diabetes, Metabolic Syndrome and Obesity » Volume 14
Assessment for the Correlation Between Diabetic Retinopathy and Metabolic Syndrome: A Cross-Sectional Study
Authors Sun Q, Tang L, Zeng Q ![]() , Gu M
, Gu M ![]()
Received 29 May 2020
Accepted for publication 23 February 2021
Published 22 April 2021 Volume 2021:14 Pages 1773—1781
DOI https://doi.org/10.2147/DMSO.S265214
Checked for plagiarism Yes
Review by Single anonymous peer review
Peer reviewer comments 4
Editor who approved publication: Professor Ming-Hui Zou
Qing Sun,1,2 Liang Tang,2 Qiurong Zeng,2 Mingjun Gu2
1Department of Clinical Nutrition, Fuling Center Hospital of Chongqing City, Chongqing, 408000, People’s Republic of China; 2Department of Endocrinology, Fuling Center Hospital of Chongqing City, Chongqing, 408000, People’s Republic of China
Correspondence: Mingjun Gu
Department of Endocrinology, Fuling Center Hospital of Chongqing City, No. 2 Fuling District, Gaosuntang Road, Chongqing, 408000, People’s Republic of China
Tel +86 13996860971
Email [email protected]
Purpose: In this study, we explored the correlation between diabetic retinopathy (DR) and metabolic syndrome (MetS) among diabetes mellitus (DM) patients.
Methods: Logistic regression analysis was utilized to test the effects of MetS and its indicators on the incidence of DR and vision-related functional burden. The spline smoothing functions of continuous indicators of MetS were used to establish the logistic generalized additive model (GAM). The effective degree of freedom (EDF) =1 was served as a sign of linear relationship. EDF> 1 was a sign of a more complex association between MetS and DR.
Results: The proportion of difficulties of looking for objects on the crowded shelves in the DR group was higher than that in the non-DR group (19.40 vs 12.10, P< 0.05). Elevated fasting glucose (Glu) and blood pressure levels were related to the vision-related functional burden. The risk of DR development increased by 6% [95% confidence interval (CI): 1.03– 1.09, P< 0.001] and 1% (95% CI: 1.01– 1.02, P=0.004) per 1 unit increase in Glu and systolic blood pressure (SBP) of DM patients, respectively. In the univariate GAM, Glu had a linear effect on DR (EDF=1, P< 0.001) with a positive correlation after controlling SBP. And there was a nonlinear correlation between SBP and DR after controlling Glu (EDF=2.44, P=0.024).
Conclusion: Both Glu and blood pressure were associated with the occurrence of DR and vision-related functional burden. Controlling the levels of Glu and blood pressure may reduce the risk of DR and vision loss among DM patients.
Keywords: diabetic retinopathy, generalized additive model, glucose, blood pressure
Introduction
Diabetic retinopathy (DR), a common microvascular complication of diabetes mellitus (DM), is a major cause of blindness among adults of working age.1 It manifests the progressive changes in microvasculature, leading to retinal ischemia, neovascularization, altered retinal permeability and macular edema, which has prominent impacts on the life quality and functional capabilities of humans.2,3 A previous report predicted that the diagnosis of DR is gradually increased between 2005 and 2050, up to 16 million in USA.4 Epidemiologic data have shown that long-term diabetes, poor blood glucose control and hypertension are concerned risk factors for the onset of DR.5 It is necessary to identify risk factors affecting the occurrence of DR for developing clinical management strategies to decline disease progression and prevent visual loss.
Metabolic syndrome (MetS), a complex syndrome of metabolic disorders, manifests a pathological status of metabolic disorder of protein, fat and carbohydrate in human body, first proposed by Reaven in 1988.6 It contains a cluster of risk factors, such as hypertension, dyslipidemia, abdominal obesity and glucose intolerance, which are associated with cardiovascular and cerebrovascular diseases and DM.7–10 Approximately one in four adults suffer from MetS worldwide,11 and the mortality of these individuals is twice as high as people without MetS.12 Studies showed that the presence of MetS was a predictive indicator for cardiovascular disease in type 2 diabetes patients as well as in non-diabetics.12,13 In addition, the correlation between MetS and microvascular complications has been reported, such as DR.
Herein, we utilized the National Health and Nutrition Examination Survey (NHANES) database to investigate the association between DR and MetS in patients with DM by generalized additive model (GAM).
Materials and Methods
Patients
We extracted the data from NHANES (2005–2008) which is a cross-sectional survey for health and nutritional status of the US civilian and non-institutionalized population conducted by National Center of Health Statistics (NCHS) and Centers for Disease Control and Prevention (CDC).14 Subjects were randomly screened based on a complex, stratified multi-stage cluster sampling design. The information collection was carried out by interviews, and corresponding examinations and assessments were conducted in the mobile examination center (MEC). Additional information was available at http://www.cdc.gov/nchs/nhanes.htm. A total of 450 patients with DM were included aged ≥40 years, excluding gestational DM. The definition of diabetes was self-reports from patients or diagnoses from doctors or health professionals.
Diagnostic Criteria
DR was diagnosed by the presence of retinal microaneurysms or retinal blot hemorrhages using an ophthalmic digital imaging system. The severity of DR was assessed according to NHANES Grading Protocol. The detailed classifications were as follows: no retinopathy, mild non-proliferative retinopathy (NPR) and severe NPR/proliferative diabetic retinopathy (PDR), which was defined as “OPDURL4” in the NHANES database.15
In accordance with the Joint Scientific Statement Harmonizing the Metabolic Syndrome,16 MetS was defined as the presence of 3 or more of the following features: hypertension, hypertriglyceridemia, low high-density lipoprotein (HDL), elevated fasting glucose, and abdominal obesity. Elevated blood pressure was defined as systolic blood pressure (SBP) ≥130 mmHg/diastolic blood pressure (DBP) ≥85 mmHg, or self-reported current antihypertensive drug use. Hypertriglyceridemia was identified based on triglyceride (TG) ≥150 mg/dL. Low HDL was a level of <40 mg/dL in men or <50 mg/dL in women. Elevated fasting glucose (Glu) was defined as Glu ≥100 mg/dL, or self-reports of current insulin or oral hypoglycemic drug use. Abdominal obesity was defined as waist >88 cm for female and >102 cm for male.
Functional Difficulties of Vision
According to the self-reported visual functional difficulties, the vision-related functional burden was classified by causes of reading (Q1), close-up work (Q2), looking for objects on the crowded shelves (Q3), walking down the steps, stairs or curbs (Q4), noticing objects to the side during ambulation (Q5) and driving (Q6). The Likert scale was used to identify the functional difficulties of patients’ vision in each category, which was divided into 5 classifications including no difficulty, little difficulty, moderate difficulty, extreme difficulty and incapability of doing due to eyesight. If participants had moderate or extreme difficulties, or could not do activities, they would be categorized as having difficulties in a specific task.
Statistical Analysis
Statistical analyses were performed using R software 3.6.1. Continuous data were presented as the mean ± standard deviation ( ) or [M(Q25, Q75)] and analyzed by t-test or Mann–Whitney U-test. Logistic regression was used to analyze the effect of MetS and its indicators on DR. GAM is an extension of the generalized linear model which allows the evaluation for the curvilinear relationship between outcomes and predictors. The normality of residuals, homoscedasticity, and residual symmetry was used to assess the model assumptions. The spline smoothing functions of continuous indicators of MetS were used to establish the Logistic GAM. The significant variables of univariate analysis were included in GAM to conduct multivariate analysis, which was utilized to analyze nonlinear influencing factors of MetS indicators on DR. The values of effective degree of freedom (EDF) output showed the degree of the smooth curvature. EDF=1 was served as a sign of linear relationship. EDF >1 was a sign of a more complex association between MetS and DR.17 P-value <0.05 was considered statistically significant.
Results
The Baseline Characteristics of DM Patients
A total of 450 DM patients were recruited in this study, including 170 DR cases (37.80%, weighted prevalence: 34.60%) and 290 MetS participants (66.40%, weighted prevalence: 66.30%). The baseline characteristics of patients with DM are shown in Table 1. No significant differences in the MetS incidences of females and males were found between the two groups. The Glu levels in the DR group were higher than that in the non-DR group among females (179.11±87.82 vs 150.61±60.38) and males (181.90±88.18 vs 150.86±56.11), all P<0.05, respectively.
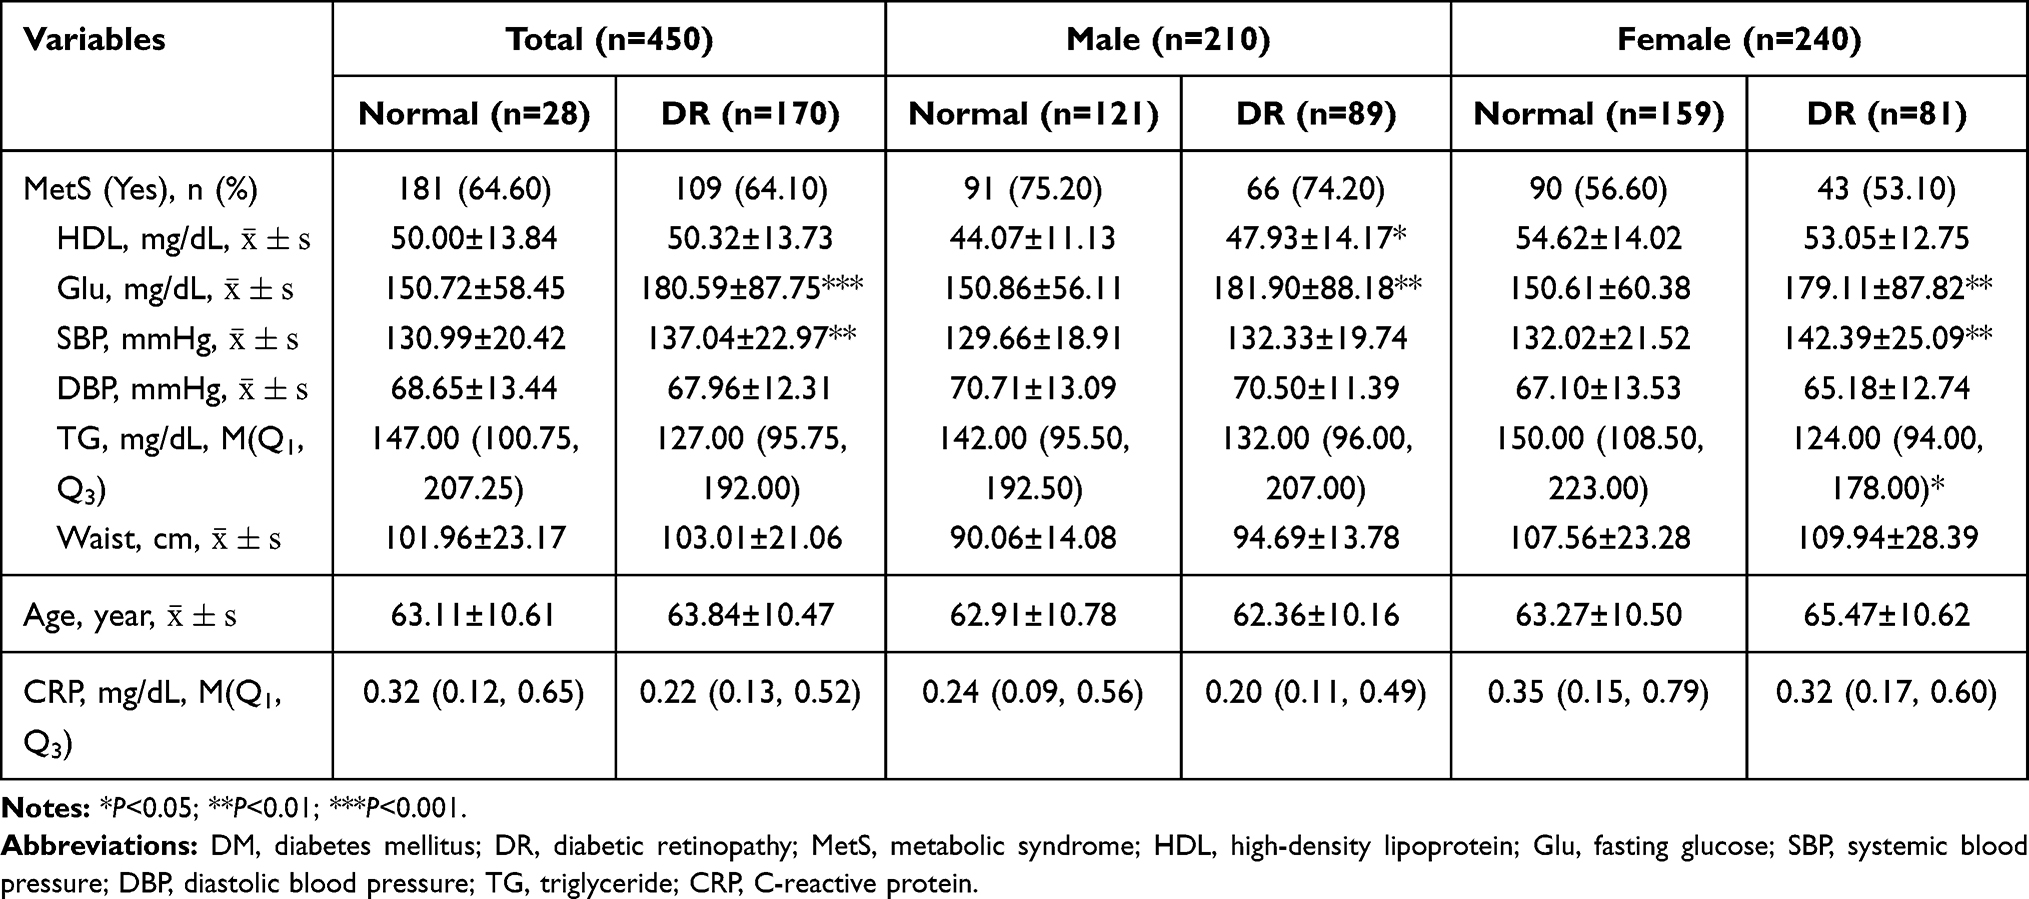 |
Table 1 The Baseline Characteristics of Patients with DM |
Association Between MetS and DR
The proportion of the number of metabolic abnormalities is shown in Table 2 based on the severity of DR. There were 280, 111 and 59 of subjects in no retinopathy, NPR and severe NPR/PDR, respectively. Among total MetS individuals, 181 cases (62.41%) with MetS (the number of metabolic abnormalities ≥3) had no retinopathy, 69 (23.80%) had NPR, and 40 (13.80%) suffered from severe NPR/PDR. The results showed that no statistical differences in groups of no retinopathy, NPR and severe NPR/PDR (χ2=3.679, P=0.961).
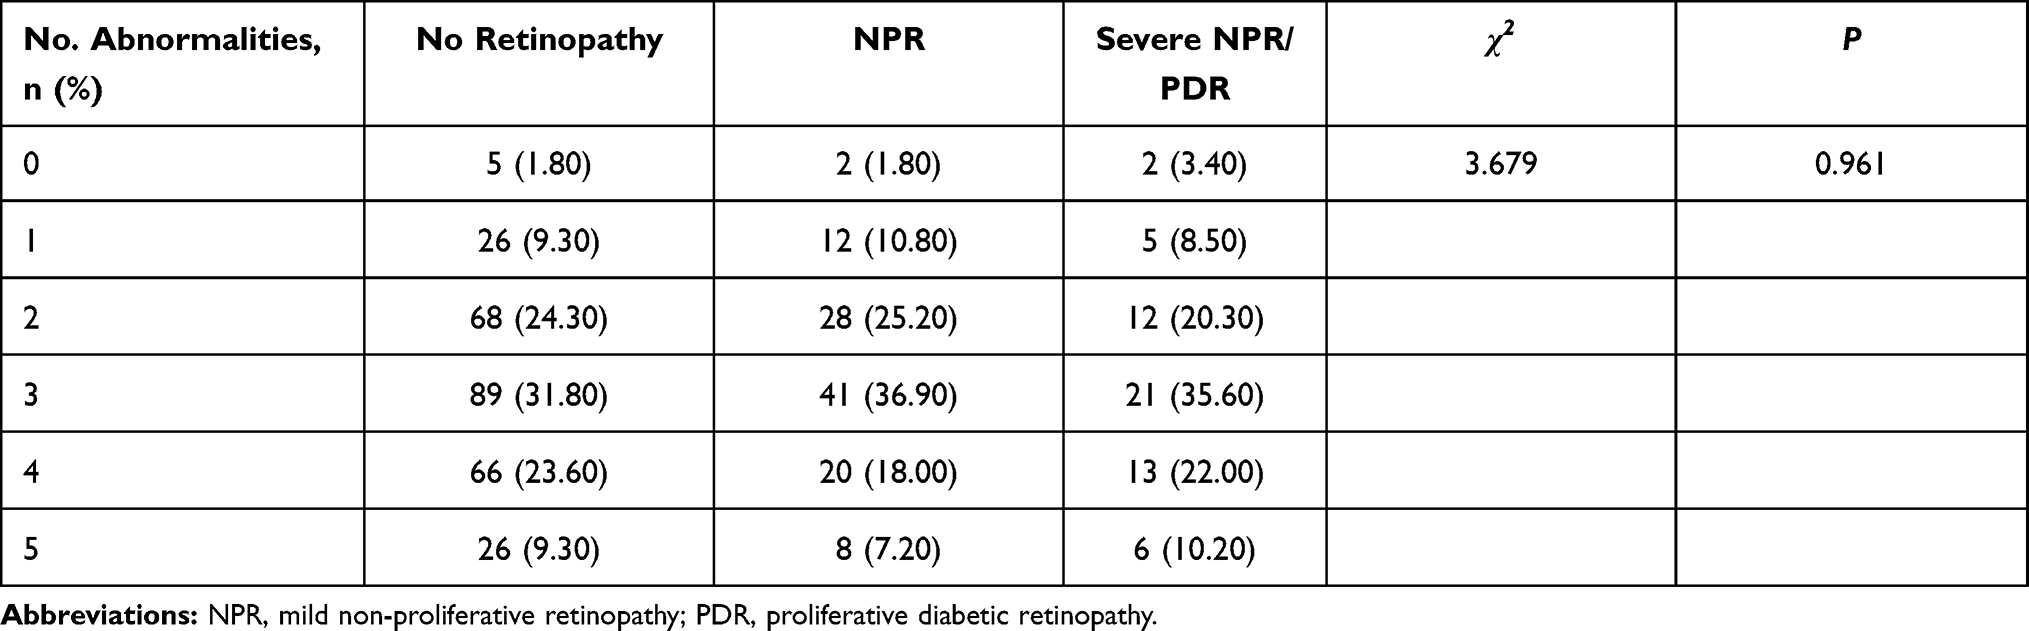 |
Table 2 Comparison for the Number of Metabolic Abnormalities Based on the Severity of DR |
As shown in Table 3, the comparison for metabolic indicators based on the severity of DR was carried out. The mean levels of Glu were 150.72 mg/dL, 170.15 mg/dL and 200.34 mg/dL among no retinopathy, NPR and severe NPR/PDR groups, respectively. The differences were discovered in the levels of Glu (P<0.001) and SBP (P=0.017) in the three groups.
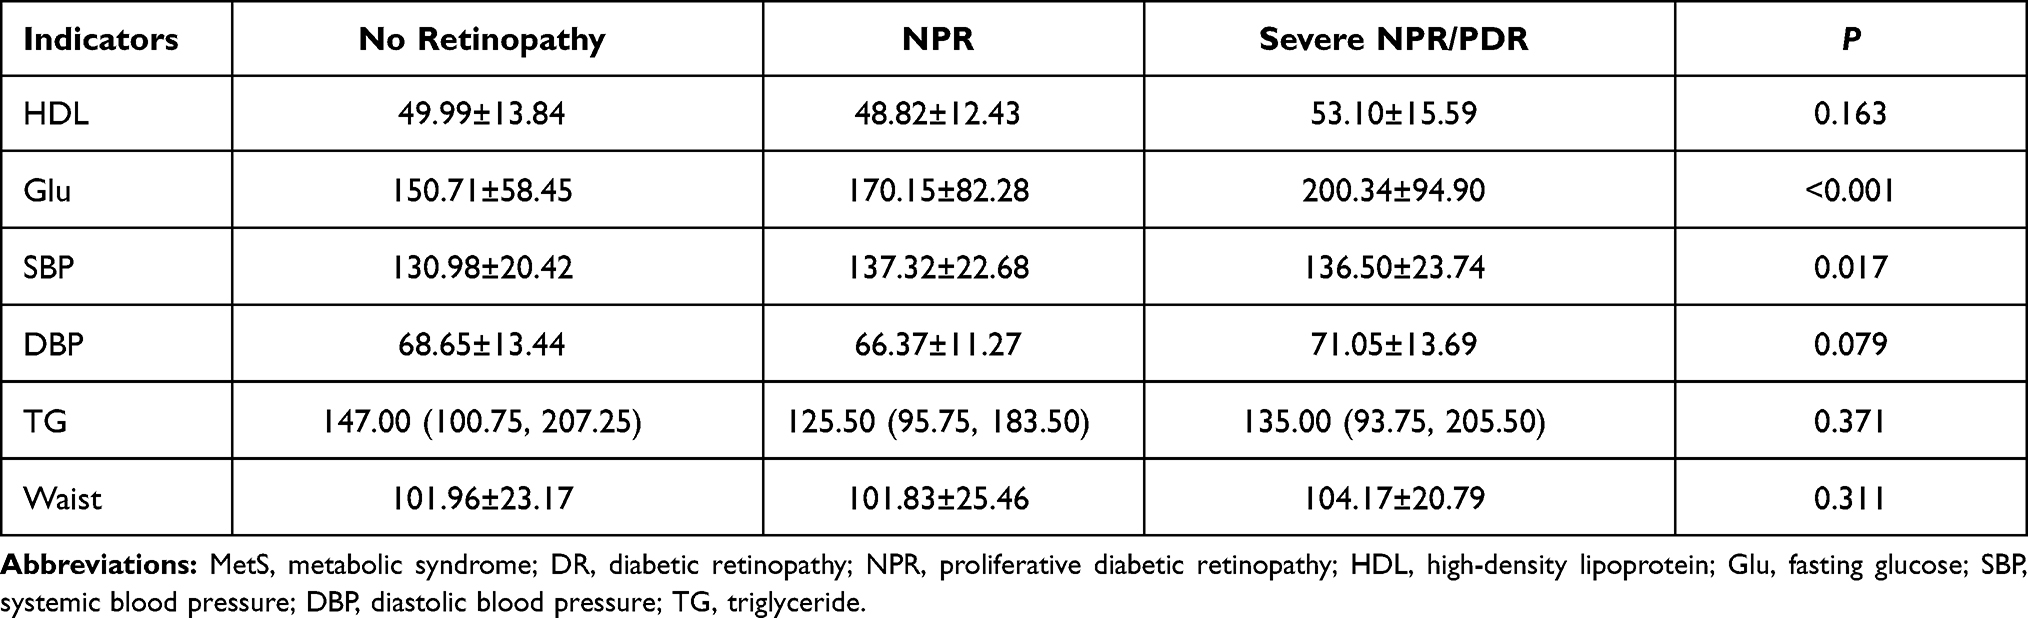 |
Table 3 Association Between MetS Indicators and the Severity of DR |
The association between MetS and DR was assessed using Logistic regression analysis as shown in Table 4. For increasing every 1 unit in Glu among DM patients, the risk of DR development increased by 0.06 times (95% CI: 1.03–1.09, P<0.001). For every 1 unit increase in SBP, the risk of developing DR increased by 0.01 times (95% CI: 1.01–1.02, P=0.004).
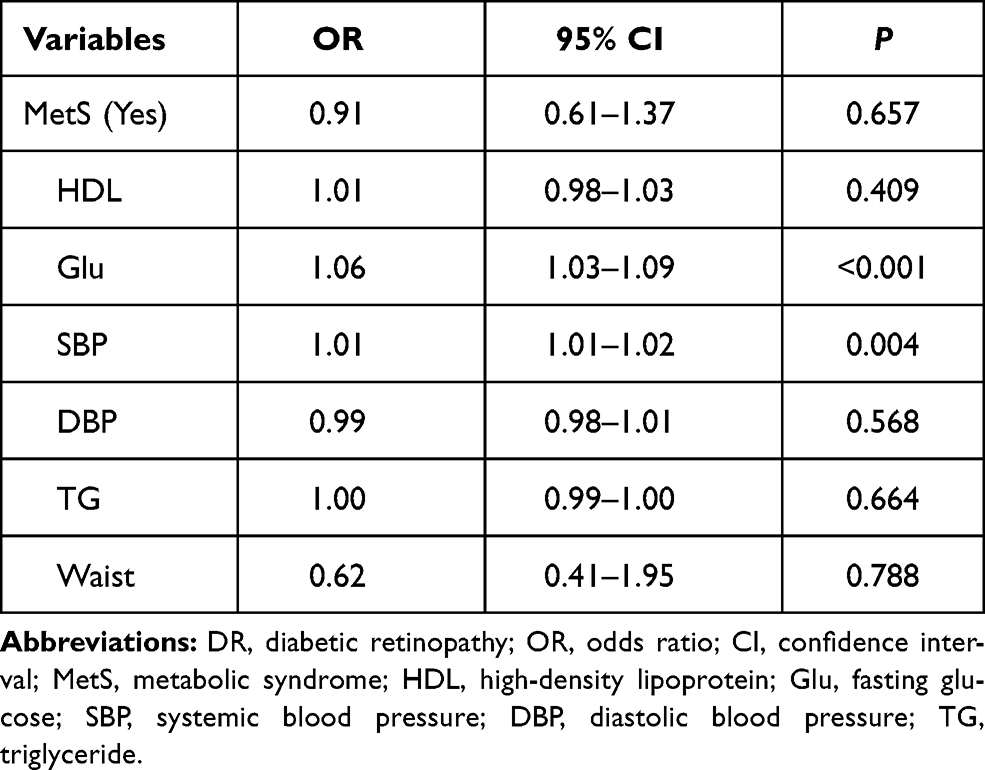 |
Table 4 Association Between MetS and DR |
The Relationship Between MetS and DR Using GAM
The results of univariate analysis showed that an EDF of 6.49 indicated a non-linear fit between Glu and DR (P=0.001). Similarly, an EDF of 1 suggested a linear fit between SBP and DR (P=0.003). There were no differences in waist (EDF=1, P=0.078), TG (EDF=5.44, P=0.083) and HDL (EDF=1, P=0.86) for DR.
The results of the multivariate GAM for DR are shown in Table 5 and Figure 1, which suggested the smooth assessment for MetS in association with DR adjusted for age and gender. After controlling SBP, Glu had a linear effect on DR (EDF=1, P<0.001) with a positive correlation. SBP had a nonlinear influence on DR after controlling Glu (EDF=2.44, P=0.024).
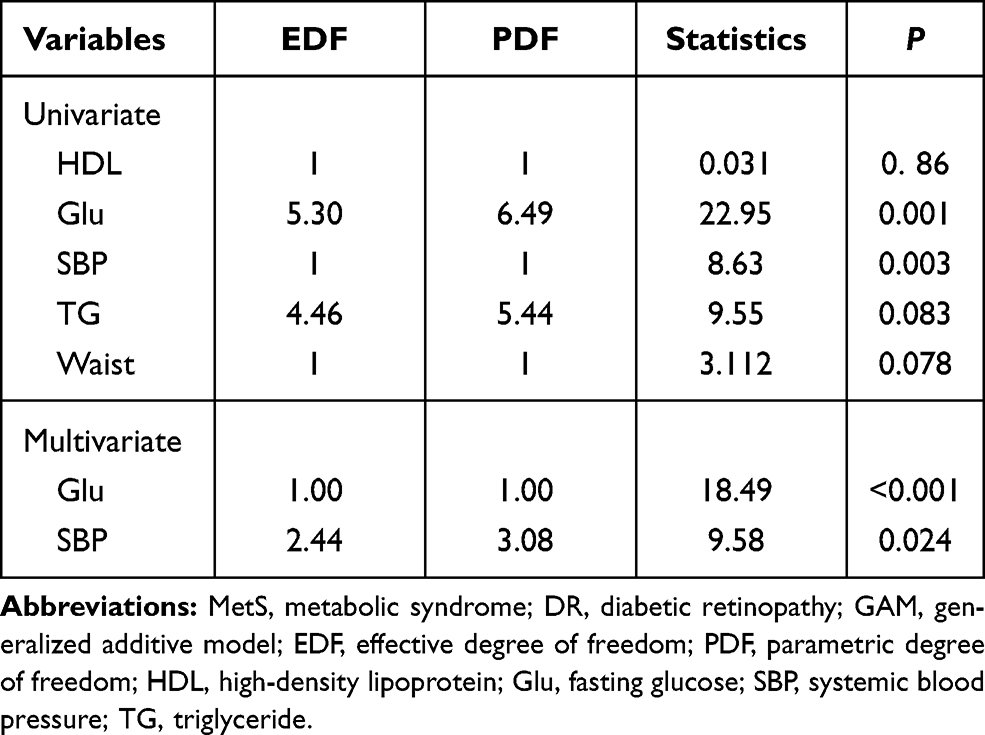 |
Table 5 The Correlation Between MetS and DR Using GAM |
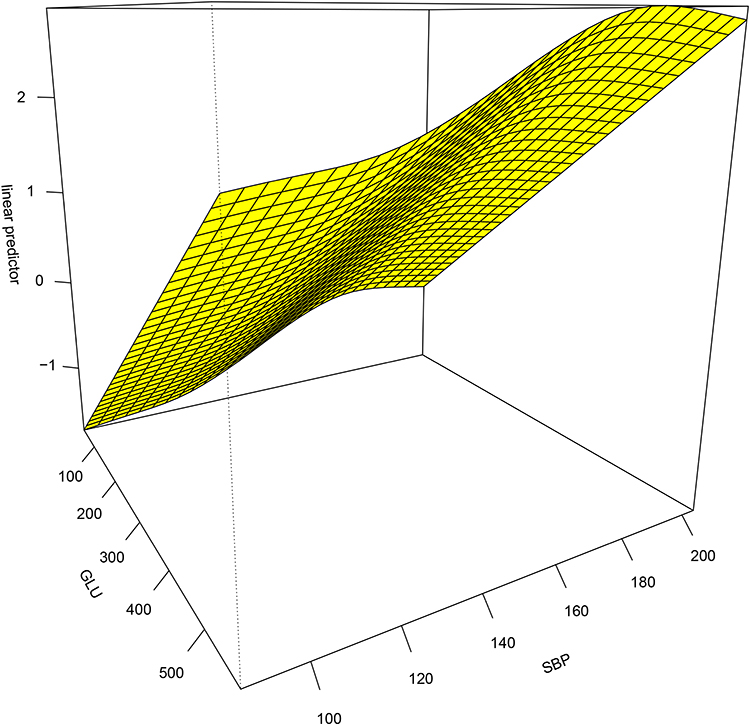 |
Figure 1 The GAM curve of DR. |
Logistic Regression Analysis for the Risk of Vision-Related Functional Burden
The characteristics of vision-related functional burden in DM patients are shown in Table 6. A total of 150 DM cases (33.33%) suffered from the vision-related functional burden. The proportion of Q3 difficulties in the DR group was higher than that in the non-DR group (19.40 vs 12.10, P<0.05). There were no statistical differences in other functional difficulties of vision (Q1, Q2, Q4, Q5 and Q6) in the two groups.
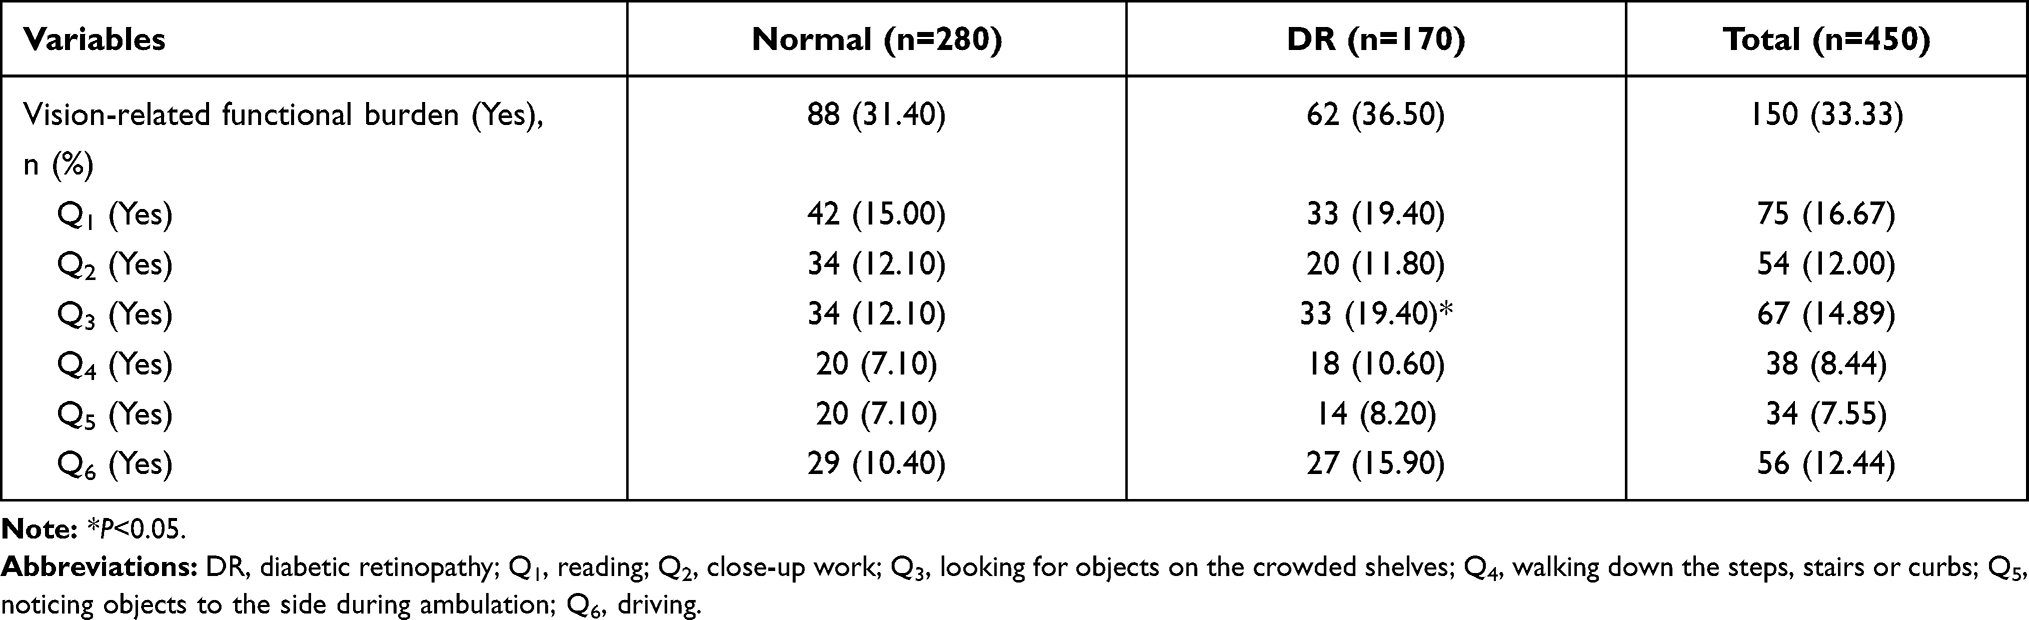 |
Table 6 The Characteristics of Vision-Related Functional Burden in DM Patients |
Logistic regression analysis for the risk of vision-related functional burden is displayed in Table 7. The results showed that the changes of Glu, SBP, DBP and waist were associated with the vision-related functional burden. For increasing every 1 unit in Glu, the risk of vision-related functional burden increased by 0.007 times (95% CI: 1.004–1.011, P<0.001). There were 0.022-fold increase of the risk following per 1 unit increase of SBP (95% CI: 1.007–1.037, P=0.003). For every 1 unit increase in DBP, the risk of undergoing the vision-related functional burden rose by 0.027 times (95% CI: 1.001–1.053, P=0.040).
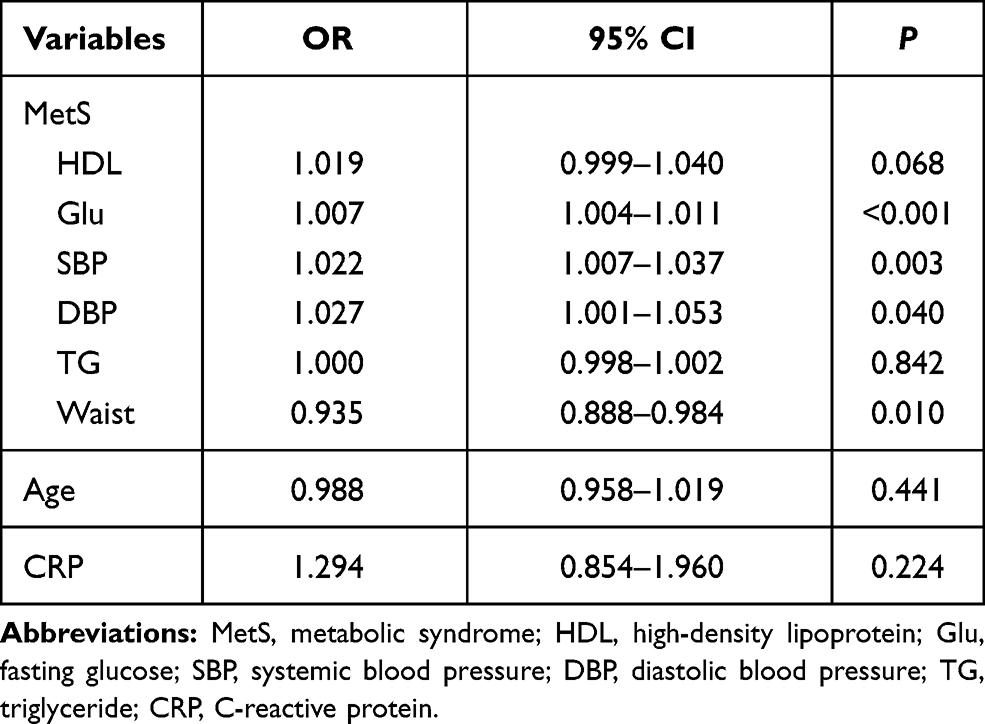 |
Table 7 Logistic Regression Analysis for the Risk of Vision-Related Functional Burden |
Discussion
In this present study, the association between DR and MetS in DM patients was investigated based on NHANES database. We used a GAM to assess a cross-sectional correction of DR and MetS. The findings of multivariate GAM showed that an EDF of Glu was 1, indicating a linear relation with a positive correlation of Glu and DR, and an EDF of SBP was 2.44, suggesting a nonlinear relationship of SBP and DR. We also found that a 0.06-fold and a 0.01-fold increase in the risk of DR with every 1 unit increase in Glu and SBP, respectively. It was indicated that the risk of DR may be predicted by the alternations of Glu and SBP. In addition, approximately 33.33% of DM had the vision-related functional burden. DR patients with the difficulties of looking for objects on the crowded shelves were higher than that of non-DR cases. The elevated levels of Glu, SBP and DBP were associated with the risk of vision-related functional burden.
DM, a frequent chromic hyperglycemic syndrome, affects approximately 200 million humans worldwide. It is estimated that the incidence of DM for all age-groups globally is nearly 4.4% in 2030,18 and the majority of DM patients will suffer from DR, which is a main cause of blindness in young to middle-aged adults in developed countries. It is important to pay attention to the risk factors affecting the occurrence of DR, so as to make medical strategies for reducing disease progression and preventing vision loss. MetS is a complex clinical syndrome characterized by a combination of metabolic diseases, such as obesity, hypertension, diabetes or impaired glucose regulation and dyslipidemia. Isomaa et al reported that the prevalence of MetS in people with normal glucose tolerance, impaired fasting glucose or impaired glucose tolerance, and type 2 DM were 10%, 42%, and 78% for male and 15%, 64%, and 84% for female, respectively.12 An early study also reported a higher incidence of DR in MetS patients, compared with non-MetS population.19 Therefore, the verified correlation between the DR and MetS needs to be identified to reduce the risk of DR.
To the best of our knowledge, prior studies reported conflicted results about the association of Glu level and DR.20–28 In this study, we demonstrated that a linear relationship between Glu and the risk of DR, with a positive correlation. When the normal glycolysis is blocked, glucose cannot be decomposed by a normal pathway, whereas the sorbitol pathway is activated. The aldose reductase can cause high levels of glucose to be converted to sorbitol, which is then converted to fructose by dehydrogenase. Sorbitol and fructose are rarely further metabolized in the cell, and difficultly penetrate the cell membrane due to their polarity. The osmotic pressure is increased owing to the elevated concentrations of sorbitol and fructose in the cell, which lead to the electrolyte imbalance and metabolic disorder. The selective loss of peripheral retinal capillary cells in DM patients is related to the presence of more aldose reductase in peripheral cells.29 An optimized glycemic control demonstrated effective in reducing both new onset and the progression of DR.30 Similarly, our findings showed that the high level of Glu was closely related to the occurrence and development of DR. In addition, we also discovered that nearly one-third of the DM cases had the vision-related functional burden. And the elevated levels of Glu was associated with the risk of vision-related functional burden. It was indicated that the blood sugar control may be effective for the risk reduction of DR and vision loss.
Hypertension, a common comorbidity of DM, has an impact in the development of atherosclerosis that can lead to the endothelial hyperplasia, sclerosis, vascular stenosis and even occlusion, then cause the retinal ischemia, hypoxia, haemangioma, and neovascularization, and eventually result in the occurrence of DR. SBP is served as a major diagnostic parameter of hypertension. A nonlinear correlation between SBP and DR was found in patients with DM in this study. UK Prospective Diabetes Study (UKPDS) reported that via regulating the blood pressure, the incidence of DR decreased by about 34% within 7 years in DM patients.31 Foo et al discovered that both the wide variability and the high average level of SBP were associated with moderate DR among Asian T2DM patients.32 Pang et al mentioned that the risk of DR was increased due to the elevated blood pressure regarding SBP and DBP in objects with impaired glucose regulation.33 These supported our results, suggesting the high level of SBP could influence the occurrence and development of DR. Moreover, elevated SBP and DBP were independent risk factors in vision-related functional burden, indicating the importance of controlling blood pressure.
Pharmacological interventions for glycemic and blood pressure control are effective for preventing or delaying the onset of DR and vision loss in those with DM. In this terrible coronavirus disease 2019 (COVID-19) pandemic moment, restrictions on timely access to medical care suggest the importance of using telemedicine. A recent study has reported the application of the telemedicine for DR screening and follow-up.34 It is indicated that the importance of correct integrated management of all the figures involved in the care of DM patients (caregivers, general practitioners and different specialists) in order to avoid a different management and progression of chronic complications as observed in other diabetic microangiopathies.35 The accurate program of screening and prevention, which would definitely reduce the risk of vision loss, is mandatory.
The strength of this study was the application of the GAM, of which the risk adjustment was better than other common modeling strategies for continuous covariates such as using linear regression models or categorizing linear terms.36,37 Our findings revealed a positive linear correlation between Glu and DR after controlling SBP, and a nonlinear correlation between SBP and DR after controlling Glu. There were several limitations that should be warranted caution for interpreting the data in this study. First, our investigation was a cross-sectional design on assessing the association between DR and MetS among patients with DM. A cross-sectional study may define a statistical correlation, but not a cause-and-effect relationship. Second, only 450 DM cases were included based on the inclusion criteria, which may reduce the statistical power. Third, data such as BMI, insulin resistance, HbA1C levels, number and severity of hypoglycemic episodes, duration and type of DM, other medications that the patient is taking, presence of ocular and other systemic co-morbidities, smoking status, alcohol use, and cognitive status were not periodically evaluated in NHANES surveys. Fourth, further detailed explanation of the relationship between dietary intake and MetS may improve the evaluation of the association between DR and MetS. Additionally, GAMs are statistical models, in which the conventional linear relationships of multiple regression are generalized to permit a much broader class of nonlinear, but still additive relationships between response and predictor variables. A propensity to over-fit is a limitation of GAM.
Conclusion
In the current study, we conducted a cross-sectional investigation to assess the correlation of DR and MetS. Our findings showed that both Glu and SBP were associated with the occurrence of DR. There was a linear positive correlation between Glu and DR risk, and a nonlinear relationship of SBP and DR. Additionally, we also found an increased risk of vision-related functional burden when Glu, SBP or DBP levels elevated. Thus, controlling the levels of Glu and blood pressure may be beneficial in reducing the risk of DR and vision loss among the patients with DM, which may be considered as a component of telemedicine that provides the basis for early clinical intervention.
Ethics Approval and Consent to Participate
NHANES database is an open dataset in the public domain, therefore the research ethics review and the informed consent were not needed for this study.
Funding
No funding was received.
Disclosure
The authors declare that they have no competing interests.
References
1. Cheung N, Mitchell P, Wong TY. Diabetic retinopathy. Lancet. 2010;376(9735):124–136. doi:10.1016/S0140-6736(09)62124-3
2. Wilkinson CP, Ferris FL
3. Kollias AN, Ulbig MW. Diabetic retinopathy: early diagnosis and effective treatment. Dtsch Arztebl Int. 2010;107(5):
4. Vision Health Initiative (VHI) Report. Projection of diabetic retinopathy and other major eye diseases among people with diabetes mellitus United States, 2005–2050. In: Centers for Disease Control and Prevention. Centers for Disease Control and Prevention. Atlanta, GA; 2015.
5. Wong TY, Mwamburi M, Klein R, et al. Rates of progression in diabetic retinopathy during different time periods: a systematic review and meta-analysis. Diabetes Care. 2009;32(12):2307–2313. doi:10.2337/dc09-0615
6. Reaven GM. Banting lecture 1988. Role of insulin resistance in human disease. Diabetes. 1988;37(12):1595–1607. doi:10.2337/diab.37.12.1595
7. Feinkohl I, Janke J, Hadzidiakos D, et al. Associations of the metabolic syndrome and its components with cognitive impairment in older adults. BMC Geriatr. 2019;19(1):77. doi:10.1186/s12877-019-1073-7
8. O’Neill S, O’Driscoll L. Metabolic syndrome: a closer look at the growing epidemic and its associated pathologies. Obes Rev. 2015;16(1):1–12. doi:10.1111/obr.12229
9. Després JP, Lemieux I. Abdominal obesity and metabolic syndrome. Nature. 2006;444(7121):881–887. doi:10.1038/nature05488
10. Eckel RH, Grundy SM, Zimmet PZ. The metabolic syndrome. Lancet. 2005;365(9468):1415–1428. doi:10.1016/S0140-6736(05)66378-7
11. Dunston DW, Zimmet PZ, Wellborn TA. The rising prevalence of diabetes and 1GT. The American diabetes, obesity and lifestyle study. Diabetes Care. 2002;25:829–834. doi:10.2337/diacare.25.5.829
12. Isomaa B, Almgren P, Tuomi T, et al. Cardiovascular morbidity and mortality associated with the metabolic syndrome. Diabetes Care. 2001;24(4):683–689. doi:10.2337/diacare.24.4.683
13. Saely CH, Aczel S, Marte T, Langer P, Hoefle G, Drexel H. The metabolic syndrome, insulin resistance, and cardiovascular risk in diabetic and nondiabetic patients. J Clin Endocrinol Metab. 2005;90(10):5698–5703. doi:10.1210/jc.2005-0799
14. Centers for Disease Control and Prevention National Center for Health Statistics. National health and nutrition examination survey 1988–1994, 2005–2006, and 2007–2008 questionnaires, datasets and related documentation. Available from: https://wwwn.cdc.gov/nchs/nhanes/Default.aspx.
15. Nhanes Digital Grading Protocol: Centers for disease control and prevention. Available from: https://www.cdc.gov/nchs/data/nhanes/nhanes_05_06/NHANES_ophthamology_digital_grading_protocol.pdf.
16. Alberti K, Eckel RH, Grundy SM, et al. Harmonizing the Metabolic Syndrome A Joint Interim Statement of the International Diabetes Federation Task Force on Epidemiology and Prevention; National Heart, Lung, and Blood Institute; American Heart Association; World Heart Federation; International Atherosclerosis Society; and International Association for the Study of Obesity. Circulation. 2009;120(16):1640–1645. doi:10.1161/CIRCULATIONAHA.109.192644
17. Wood SN. Generalized additive models: an introduction with R; Chapman and Hall/CRC. FL, USA: Boca Raton; 2006.
18. Wild S, Roglic G, Green A, Sicree R, King H. Global prevalence of diabetes: estimates for the year 2000 and projections for 2030. Diabetes Care. 2004;27(5):1047–1053. doi:10.2337/diacare.27.5.1047
19. Wong TY, Duncan BB, Golden SH, et al. Associations between the metabolic syndrome and retinal microvascular signs: the atherosclerosis risk in communities study. Invest Ophthalmol Vis Sci. 2004;45(9):2949–2954. doi:10.1167/iovs.04-0069
20. Bragd J, Adamson U, Backlund LB, Lins PE, Moberg E, Oskarsson P. Can glycaemic variability, as calculated from blood glucose self-monitoring, predict the development of complications in type 1 diabetes over a decade? Diabetes Metab. 2008;34(6 Pt 1):612–616. doi:10.1016/j.diabet.2008.04.005
21. Sartore G, Chilelli NC, Burlina S, Lapolla A. Association between glucose variability as assessed by continuous glucose monitoring (CGM) and diabetic retinopathy in type 1 and type 2 diabetes. Acta Diabetol. 2013;50(3):437–442. doi:10.1007/s00592-013-0459-9
22. Gimeno-Orna JA, Castro-Alonso FJ, Boned-Juliani B, Lou Arnal LM. Fasting plasma glucose variability as a risk factor of retinopathy in Type 2 diabetic patients. J Diabetes Complications. 2003;17(2):78–81. doi:10.1016/S1056-8727(02)00197-6
23. Hirakawa Y, Arima H, Zoungas S, et al. Impact of visit-to-visit glycemic variability on the risks of macrovascular and microvascular events and all-cause mortality in type 2 diabetes: the ADVANCE trial. Diabetes Care. 2014;37(8):2359–2365. doi:10.2337/dc14-0199
24. Takao T, Ide T, Yanagisawa H, Kikuchi M, Kawazu S, Matsuyama Y. The effect of fasting plasma glucose variability on the risk of retinopathy in type 2 diabetic patients: retrospective long-term follow-up. Diabetes Res Clin Pract. 2010;89(3):296–302. doi:10.1016/j.diabres.2010.03.027
25. Takao T, Ide T, Yanagisawa H, Kikuchi M, Kawazu S, Matsuyama Y. The effects of fasting plasma glucose variability and time-dependent glycemic control on the long-term risk of retinopathy in type 2 diabetic patients. Diabetes Res Clin Pract. 2011;91(2):e40–e42. doi:10.1016/j.diabres.2010.10.009
26. Cardoso CRL, Leite NC, Moram CBM, Salles GF. Long-term visit-to-visit glycemic variability as predictor of micro- and macrovascular complications in patients with type 2 diabetes: the Rio de Janeiro Type 2 Diabetes Cohort Study. Cardiovasc Diabetol. 2018;17(1):33. doi:10.1186/s12933-018-0677-0
27. Takao T, Inoue K, Suka M, Yanagisawa H, Iwamoto Y. Optimal cutoff values of fasting plasma glucose (FPG) variability for detecting retinopathy and the threshold of FPG levels for predicting the risk of retinopathy in type 2 diabetes: a longitudinal study over 27years. Diabetes Res Clin Pract. 2018;140:228–235. doi:10.1016/j.diabres.2018.03.051
28. Li W, Liu X, Yanoff M, Cohen S, Ye X. Cultured retinal capillary pericytes die by apoptosis after an abrupt fluctuation from high to low glucose levels: a comparative study with retinal capillary endothelial cells. Diabetologia. 1996;39(5):537–547. doi:10.1007/BF00403300
29. Perrott RL, North RV, Drasdo N, Ahmed KA, Owens DR. The influence of plasma glucose upon pulsatile ocular blood flow in subjects with type II diabetes mellitus. Diabetologia. 2001;44(6):700–705. doi:10.1007/s001250051678
30. Boussageon R, Bejan-Angoulvant T, Saadatian-Elahi M, et al. Effect of intensive glucose lowering treatment on all cause mortality, cardiovascular death, and microvascular events in type 2 diabetes: meta-analysis of randomized controlled trials. BMJ. 2011;343:d4169. doi:10.1136/bmj.d4169
31. UK Prospective Diabetes Study (UKPDS) Group. Intensive blood-glucose control with sulphonylureas or insulin compared with conventional treatment and risk of complications in patients with type 2 diabetes (UKPDS 33). Lancet. 1998;352(9131):837–853. doi:10.1016/S0140-6736(98)07019-6
32. Foo V, Quah J, Cheung G, et al. HbA1c, systolic blood pressure variability and diabetic retinopathy in Asian type 2 diabetics. J Diabetes. 2017;9(2):200–207. doi:10.1111/1753-0407.12403
33. Pang C, Jia L, Jiang S, et al. Determination of diabetic retinopathy prevalence and associated risk factors in Chinese diabetic and pre-diabetic subjects: shanghai diabetic complications study. Diabetes-Metab Res. 2012;28(3):276–283. doi:10.1002/dmrr.1307
34. Sasso FC, Pafundi PC, Gelso A, et al. Telemedicine for screening diabetic retinopathy: the no BLIND Italian multicenter study. Diabetes-Metab Res. 2019;35(3):e3113.
35. Minutolo R, Sasso FC, Chiodini P, et al. Management of cardiovascular risk factors in advanced type 2 diabetic nephropathy: a comparative analysis in nephrology, diabetology and primary care settings. J Hypertens. 2006;24(8):1655–1661. doi:10.1097/01.hjh.0000239303.93872.31
36. Benedetti A, Abrahamowicz M. Using generalized additive models to reduce residual confounding. Stat Med. 2004;23(24):3781–3801. doi:10.1002/sim.2073
37. Moore L, Hanley JA, Turgeon AF, Lavoie A. A comparison of generalized additive models to other common modeling strategies for continuous covariates: implications for risk adjustment. J Biometrics Biostat. 2011;2(1):1000109.
 © 2021 The Author(s). This work is published and licensed by Dove Medical Press Limited. The
full terms of this license are available at https://www.dovepress.com/terms
and incorporate the Creative Commons Attribution
- Non Commercial (unported, 3.0) License.
By accessing the work you hereby accept the Terms. Non-commercial uses of the work are permitted
without any further permission from Dove Medical Press Limited, provided the work is properly
attributed. For permission for commercial use of this work, please see paragraphs 4.2 and 5 of our Terms.
© 2021 The Author(s). This work is published and licensed by Dove Medical Press Limited. The
full terms of this license are available at https://www.dovepress.com/terms
and incorporate the Creative Commons Attribution
- Non Commercial (unported, 3.0) License.
By accessing the work you hereby accept the Terms. Non-commercial uses of the work are permitted
without any further permission from Dove Medical Press Limited, provided the work is properly
attributed. For permission for commercial use of this work, please see paragraphs 4.2 and 5 of our Terms.