Back to Journals » Clinical Epidemiology » Volume 12
Assessment Causality in Associations Between Serum Uric Acid and Risk of Schizophrenia: A Two-Sample Bidirectional Mendelian Randomization Study
Authors Luo Q, Wen Z, Li Y, Chen Z ![]() , Long X, Bai Y, Huang S, Yan Y, Lin R
, Long X, Bai Y, Huang S, Yan Y, Lin R ![]() , Mo Z
, Mo Z
Received 4 November 2019
Accepted for publication 16 January 2020
Published 26 February 2020 Volume 2020:12 Pages 223—233
DOI https://doi.org/10.2147/CLEP.S236885
Checked for plagiarism Yes
Review by Single anonymous peer review
Peer reviewer comments 3
Editor who approved publication: Professor Irene Petersen
Qianqian Luo,1–5,* Zheng Wen,1–5,* Yuanfan Li,1–5 Zefeng Chen,1–5 Xinyang Long,1–5 Yulan Bai,1–5 Shengzhu Huang,1–4 Yunkun Yan,1–4 Rui Lin,1–5 Zengnan Mo1–4,6
1Center for Genomic and Personalized Medicine, Guangxi Medical University, Nanning 530021, Guangxi, People’s Republic of China; 2Guangxi Key Laboratory for Genomic and Personalized Medicine, Nanning 530021, Guangxi, People’s Republic of China; 3Guangxi Collaborative Innovation Center for Genomic and Personalized Medicine, Nanning 530021, Guangxi, People’s Republic of China; 4Guangxi Key Laboratory of Colleges and Universities, Nanning 530021, Guangxi, People’s Republic of China; 5School of Public Health, Guangxi Medical University, Nanning 530021, Guangxi, People’s Republic of China; 6Institute of Urology and Nephrology, First Affiliated Hospital of Guangxi Medical University, Nanning 530021, Guangxi, People’s Republic of China
*These authors contributed equally to this work
Correspondence: Zengnan Mo; Rui Lin
Center for Genomic and Personalized Medicine, Guangxi Medical University, 22 Shuangyong Road, Nanning 530021, Guangxi, People’s Republic of China
Tel/Fax +86771-5353342; +86771-5641040
Email [email protected]; [email protected]
Purpose: Although increasing lines of evidence showed associations between serum uric acid (UA) levels and schizophrenia, the causality and the direction of the associations remain uncertain. Thus, we aimed to assess whether the relationships between serum UA levels and schizophrenia are causal and to determine the direction of the association.
Patients and Methods: Two-sample bidirectional Mendelian randomization (MR) analyses and various sensitivity analyses were performed utilizing the summary data from genome-wide association studies within the Global Urate Genetics Consortium and the Psychiatric Genomics Consortium. Secondary MR analyses in both directions were conducted within summary data using genetic risk scores (GRSs) as instrumental variables.
Results: Three MR methods provided no causal relationship between serum UA and schizophrenia. Furthermore, GRS approach showed similar results in the three MR methods after adjustment for heterogeneity. By contrast, inverse variance weighted method, weighted median and GRS approach suggested a causal effect of schizophrenia risk on serum UA after adjustment for heterogeneity (per 10-symmetric percentage increase in schizophrenia risk, beta: − 0.039, standard error (SE): 0.013, P = 0.003; beta: − 0.036, SE: 0.018, P = 0.043; beta: − 0.039, SE: 0.013, P = 0.002; respectively). Moreover, in both directions’ analyses, the heterogeneity and sensitivity tests suggested no strong evidence of bias due to pleiotropy.
Conclusion: Schizophrenia may causally affect serum UA levels, whereas the causal role of serum UA concentrations in schizophrenia was not supported by our MR analyses. These findings suggest that UA may be a useful potential biomarker for monitoring treatment or diagnosis of schizophrenia rather than a therapeutic target for schizophrenia.
Keywords: schizophrenia, uric acid, Mendelian randomization, genetic risk score, causality
Introduction
Schizophrenia is a serious and considerably heritable mental illness resulting in severe disability.1,2 Life expectancy for people with schizophrenia is approximately 10–25 years shorter than that for the general people.3,4 Studies have indicated that schizophrenia may be related to oxidative damage, as abnormal levels of major antioxidants were observed in patients with schizophrenia.5–7 Circulating uric acid (UA) is a major antioxidant of plasma and protects cells from oxidative damage.8,9 Study reported approximately 60% of free radical scavenging activity was represented by UA in human blood.10 In addition, patients with schizophrenia were found to have significantly lower UA levels than normal controls, and further decreased UA levels were observed after haloperidol withdrawal in the controlled clinical trial.5 Meanwhile, in a case-control study, significantly lower UA levels were reported in patients with first-episode schizophrenia (FSPR) rather in controls, suggesting oxidative damage remains in the antioxidant system in the early course of schizophrenia.7 Furthermore, a meta-analysis of cross-sectional studies reported every 1 mg/dL lower UA concentration decreased 23–59% FSPR risk.11,12
Although the association between UA and schizophrenia was observed in cumulative studies, whether reduced UA is a cause or a consequence of schizophrenia remains unclear. Reverse causality could be one of the explanations for this association since decreased UA is a defensive consequence of schizophrenia because of the UA antioxidative properties.10 Moreover, it has been demonstrated that serum UA levels were related to numerous factors, such as dietary factors and smoking,13 and such factors may be potential confounders and not all to be adjusted in the reported studies. Thus, understanding the role of UA in schizophrenia and insights into the causal nature of these observed relationships require further investigation.
It is well known that both schizophrenia and UA are highly heritable. A meta-analysis of twin studies and a Swedish population-based study estimated the heritability of schizophrenia ranged from 64% to 81%.14,15 A large genome-wide association study (GWAS) identified 128 single nucleotide polymorphisms (SNPs) significantly associated with schizophrenia which explained approximately 3.4% of the variance in schizophrenia risk.16 As for UA, approximately 40–73% of heritability was estimated by the twin study,17 path analyses and segregation analyses.18,19 Recently, 28 SNPs were identified significantly associated with serum UA level in a large GWAS,20 and the proportion of explained variance was approximately 7%.
For those heritable phenotypes evidenced from GWAS, the causal association between them now can be assessed by Mendelian randomization (MR) study (ie, utilizing genetic variants as an instrumental variable (IV) to estimate the causal relationship between exposure and a medically relevant outcome).21–23 During gamete formation, alleles are randomly allocated and genetic variants have effects that are potentially lifelong. Thus, other confounding factors are probably not going to confound the relationship of genetic variants with risk of a disease outcome.24 Moreover, unlike traditional epidemiology studies, association between genetic variants and outcomes cannot be generated by reverse causality, since genomes are determined at conception. So, we performed the bidirectional MR study to identify whether reverse causality is present in earlier epidemiology studies. MR study has been used for testing a causal effect for a range of traits and diseases,25–32 leading to our understanding for the aetiological architecture of complex diseases. Compared with one-sample MR, the two-sample MR method does not rely on individual-level genotype data and can estimate the causal association between exposure factors and outcome variables through the existing GWAS summarized statistics.33 Thus, the causal association between UA and schizophrenia risk can be assessed by MR. In the present study, we will use GWAS summarized data to analyze the causal relationship between serum UA levels and schizophrenia risk with two-sample bidirectional MR method.
Materials and Methods
The schematic of the two-sample bidirectional MR analysis is shown in Figure 1. Briefly, serum UA levels affect schizophrenia risk were analyzed first (Figure 1A), then followed the analysis on schizophrenia risk affects serum UA levels (Figure 1B).
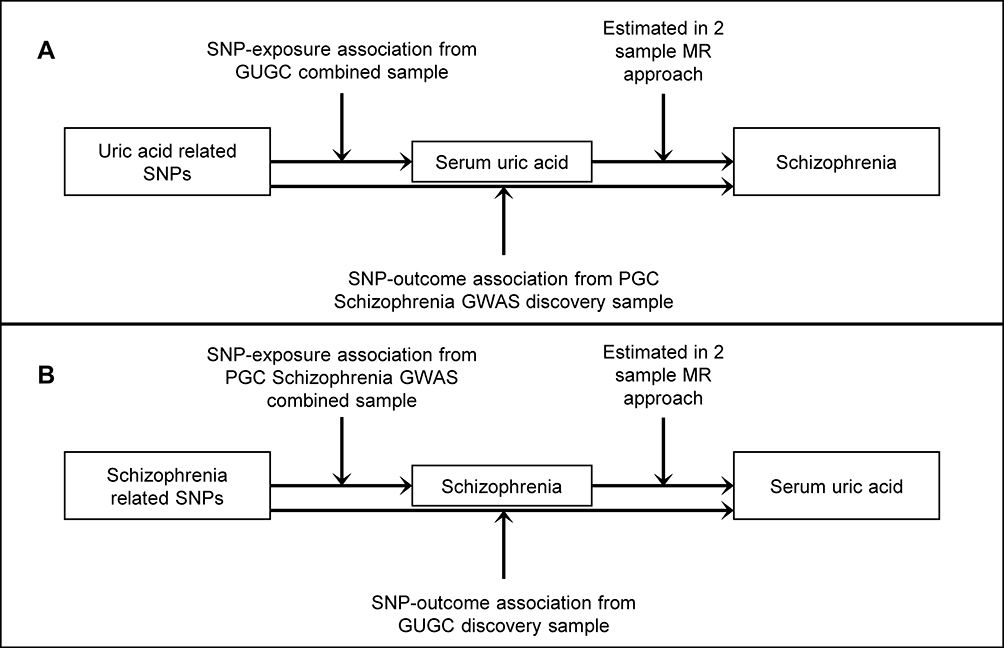 |
Figure 1 Two-sample bidirectional Mendelian randomization study of the association of serum uric acid (UA) and schizophrenia. Notes: (A) Data sources for investigating whether serum UA causes schizophrenia. (B) Data sources for studying whether the biological risk of schizophrenia causally affects serum UA.Abbreviations: SNP, single nucleotide polymorphism; GUGC, Global Urate Genetics Consortium; PGC, Psychiatric Genomics Consortium; MR, Mendelian randomization. |
Selection of Datasets and Genetic Variants
Serum UA to Schizophrenia
The datasets from the serum UA Global Urate Genetics Consortium (GUGC) GWAS and the Psychiatric Genomics Consortium (PGC) GWAS were used for the analysis. The GUGC GWAS comprised more than 140 000 individuals of European ancestry.20 Twenty-eight SNPs associated with serum UA levels were selected from GUGC GWAS, which were identified to be of genome-wide significance (P<5×10⁻⁸) in the combined sample (discovery sample + replication sample). These variants are not in linkage disequilibrium and were used in the previous MR studies.34,35 A central assumption of MR is that the SNPs included in the genetic instrument are uncorrelated with confounders.22 In the context of UA – schizophrenia/schizophrenia – UA relationship, smoking is most likely a very important confounder.36,37 Information queried from publicly available databases of human genotype-phenotype associations, PhenoScanner V2 and GWAS Catalog, was used to assess associations of these SNPs with smoking confounder.38,39 Of the 28 SNPs related to serum UA therein, we excluded 1 SNP (rs653178) for being related with smoking confounder (Table S1) and 1 SNP (rs17632159) for being palindromic.40 Finally, 26 independent SNPs were used as IVs for serum UA. All these 26 SNPs associated with serum UA were directly matched in the summary data of gene (SNP)–outcome (schizophrenia risk) association estimates.
We obtained the summary data of gene (SNP)–outcome (schizophrenia risk) association estimates from the PGC GWAS discovery sample,16 which included 35,476 cases of schizophrenia and 46,839 controls. The summary statistics were downloaded from the public access (http://www.med.unc.edu/pgc/downloads (SCZ2)).
We also conducted data harmonization to prevent bias due to errors according to a previous report (Tables S2 and S3).40
Schizophrenia to Serum UA
We utilized variants at genome-wide significance (P<5×10⁻⁸) as genetic instrument for schizophrenia; these variants were from the combined sample (discovery sample + replication sample) of the PGC schizophrenia GWAS, which comprised 36,989 cases and 113 075 controls (principally of European ancestry).16 A total of 128 SNPs were identified genome-wide significance and 2 SNPs (rs11210892, rs8042374) were excluded for being related with smoking confounder queried from PhenoScanner V2 and GWAS Catalog (Table S4),38,39 and 7 SNPs (rs11139497, rs12325245, rs12522290, rs215411, rs2851447, rs4240748, rs9841616) were excluded for being palindromic.40 Of the remaining 119 SNPs, 45 SNPs were directly matched in the summary data of gene (SNP)–outcome (serum UA) association estimates. Finally, 45 independent SNPs were used as IVs for schizophrenia.
We obtained the summary data of gene (SNP)–outcome (serum UA) association estimates from the GUGC GWAS discovery sample of up to 110 347 individuals from 48 studies.20
We also conducted data harmonization to prevent bias due to errors according to a previous report (Tables S5 and S6).40
Statistical Analyses
Statistical Analyses for MR
Three MR methods were used in two sets of two-sample MR analyses: (1) inverse variance weighted (IVW) method,41 in which the SNP–outcome estimation is regressed on the SNP–exposure estimation. This approach assumes that all SNPs are valid instruments; thus, the overall bias is zero; (2) MR Egger regression analysis, whose slope represents the causal effect estimate,42 is robust to invalid instruments against directional pleiotropy;43 and (3) weighted median approach, which assesses consistently regardless of whether up to half of the weight comes from invalid instruments.44
In the MR analyses, ln (exposure) was used in both directions. That is, in the calculation of the effect size values for every exposure SNP, a unit increment in ln (exposure) is equivalent to a 10-symmetric percentage (s%) increment in exposure level, which corresponds to the beta coefficient (ie, logit of risk estimate) for a binary outcome or a unit change of a continuous outcome.45 Therefore, the causal estimate value for every exposure SNP is displayed for the outcome, which corresponds to a 10-s% increment in real exposure level.
We conducted all analyses utilizing R (version 3.5.3) with the R package “TwosampleMR”.33 We transformed all the causal effect estimates (beta coefficients) to odds ratios (ORs). Two-tail P<0.05 was considered statistically significant. We used only freely accessible summarized data in this study; therefore, this work did not require ethical approval.
Heterogeneity and Sensitivity Tests
Cochran’s Q test was used to estimate heterogeneities between SNPs.46 This test assumes that all valid IVs assess the equivalent effect.47 A P-value of <0.1 was considered statistically significant (ie, indicating the possibility of pleiotropy) for the Cochran’s Q test. We removed stepwise the SNPs with potential pleiotropic effects (ie, after adjustment for heterogeneity) to limit false positives,48 and then repeated the analyses until the Cochran’s Q test did not differ from the null. We then performed MR Egger regression, whose intercept represents bias due to directional pleiotropy.42 For MR Egger regression, intercept P<0.05 (the MR Egger regression) indicates SNPs with directional pleiotropy.42 Furthermore, a “leave-one-out” analysis was conducted to assess whether the causal estimate was driven by a single SNP.
Power Calculation and Weak Instrument Bias
For the forward-direction MR analysis (SNPs–serum UA–schizophrenia), the power was assessed at a two-sided α of 0.05 in accordance with the method of Brion et al (https://shiny.cnsgenomics.com/mRnd/) (Table S7).49 The forward-direction MR analysis would have 100% power to detect a statistically significant effect. The power level ensured that the associations did not arise from chance.
In MR, an F-statistic value of more than 10 reflects as a strong instrument.50 The F-statistic value for each of the 45 SNP IVs for schizophrenia was more than 10 in the reverse-direction MR (Table S8), which meant the IVs for schizophrenia were strong and a causal estimate was unlikely to be biased due to weak instruments.
Sample Overlap
Conventionally, if overlap data sets on the SNP–exposure and SNP–outcome are used, the estimates can be biased and a spurious causal estimate can be yielded.51 In the present study, data from the serum UA GUGC GWAS and the PGC GWAS on the exposure and outcome were taken from non-overlapping datasets,16,20 suggesting that the estimate was less biased and any bias was in the direction of the null.
Associations Between Exposure Genetic Risk Score (GRS) and Outcome in Both Directions
To obtain the combined estimate of the relationship of exposure-influencing alleles with the outcome, MR analyses were performed using weighted GRS as IVs in both directions by using the same summary data described above. In forward-direction MR, the GRS consisted of 21 SNPs (after removal of five SNPs with potential pleiotropic effects from the 26 IVs (SNPs)) that were related to serum UA level (P<5×10⁻⁸) in the combined sample (discovery sample + replication sample) of the GUGC GWAS (GRSUA).20 In the reverse-direction MR, the GRS comprised 44 SNPs (after removal of one SNP with potential pleiotropic effects from the 45 IVs (SNPs)) that were related to schizophrenia (P<5×10⁻⁸) in the combined sample (discovery sample + replication sample) of the PGC GWAS (GRSSCZ).16 We conducted the analyses utilizing R (version 3.5.3) with the “gtx” R package (version 0.0.8 for Windows), whose grs.summary module has the GRS function. The grs.summary module merely used single SNP association summarized data obtained from the results of the GWAS analysis, which is similar to a method which regresses an outcome onto an additive GRS. For uncorrelated SNPs, the causal estimate α value can be estimated by  , and the standard error seα can be estimated by
  . Here, ω denotes the estimated effects on the intermediate trait or biomarker, and β values are estimated effects on the response variable or outcome with standard errors seβ. This approach is described in detail elsewhere.52 Furthermore, previous studies reported that this MR method utilizing meta-GWAS summary data was equally efficient to that using individual-level data.41,53 Moreover, goodness-of-fit tests were conducted to adjust for the heterogeneity of SNPs in both GRSs.
Results
MR Results of Serum UA to Schizophrenia
All the three MR approaches (IVW method, MR Egger regression and weighted median approach) provided no causal relationship between serum UA and schizophrenia (per 10-s% increment in UA, OR: 0.942, 95% confidence interval (95% CI): 0.866–1.025, P = 0.163; OR: 0.964, 95% CI: 0.854–1.087, P = 0.555; OR: 0.965, 95% CI: 0.908–1.026, P = 0.260; respectively) (Table 1). Similar results were observed by using the three different MR methods after removing the five SNPs with potential pleiotropic effects (rs1165151, rs3741414, rs478607, rs6770152, rs7953704), indicating the lack of causal association between serum UA and schizophrenia (per 10-s% increment in UA, OR: 0.962, 95% CI: 0.908–1.020, P = 0.195; OR: 0.972, 95% CI: 0.895–1.054, P = 0.496; OR: 0.968, 95% CI: 0.908–1.031, P = 0.307; respectively) (Table 1).
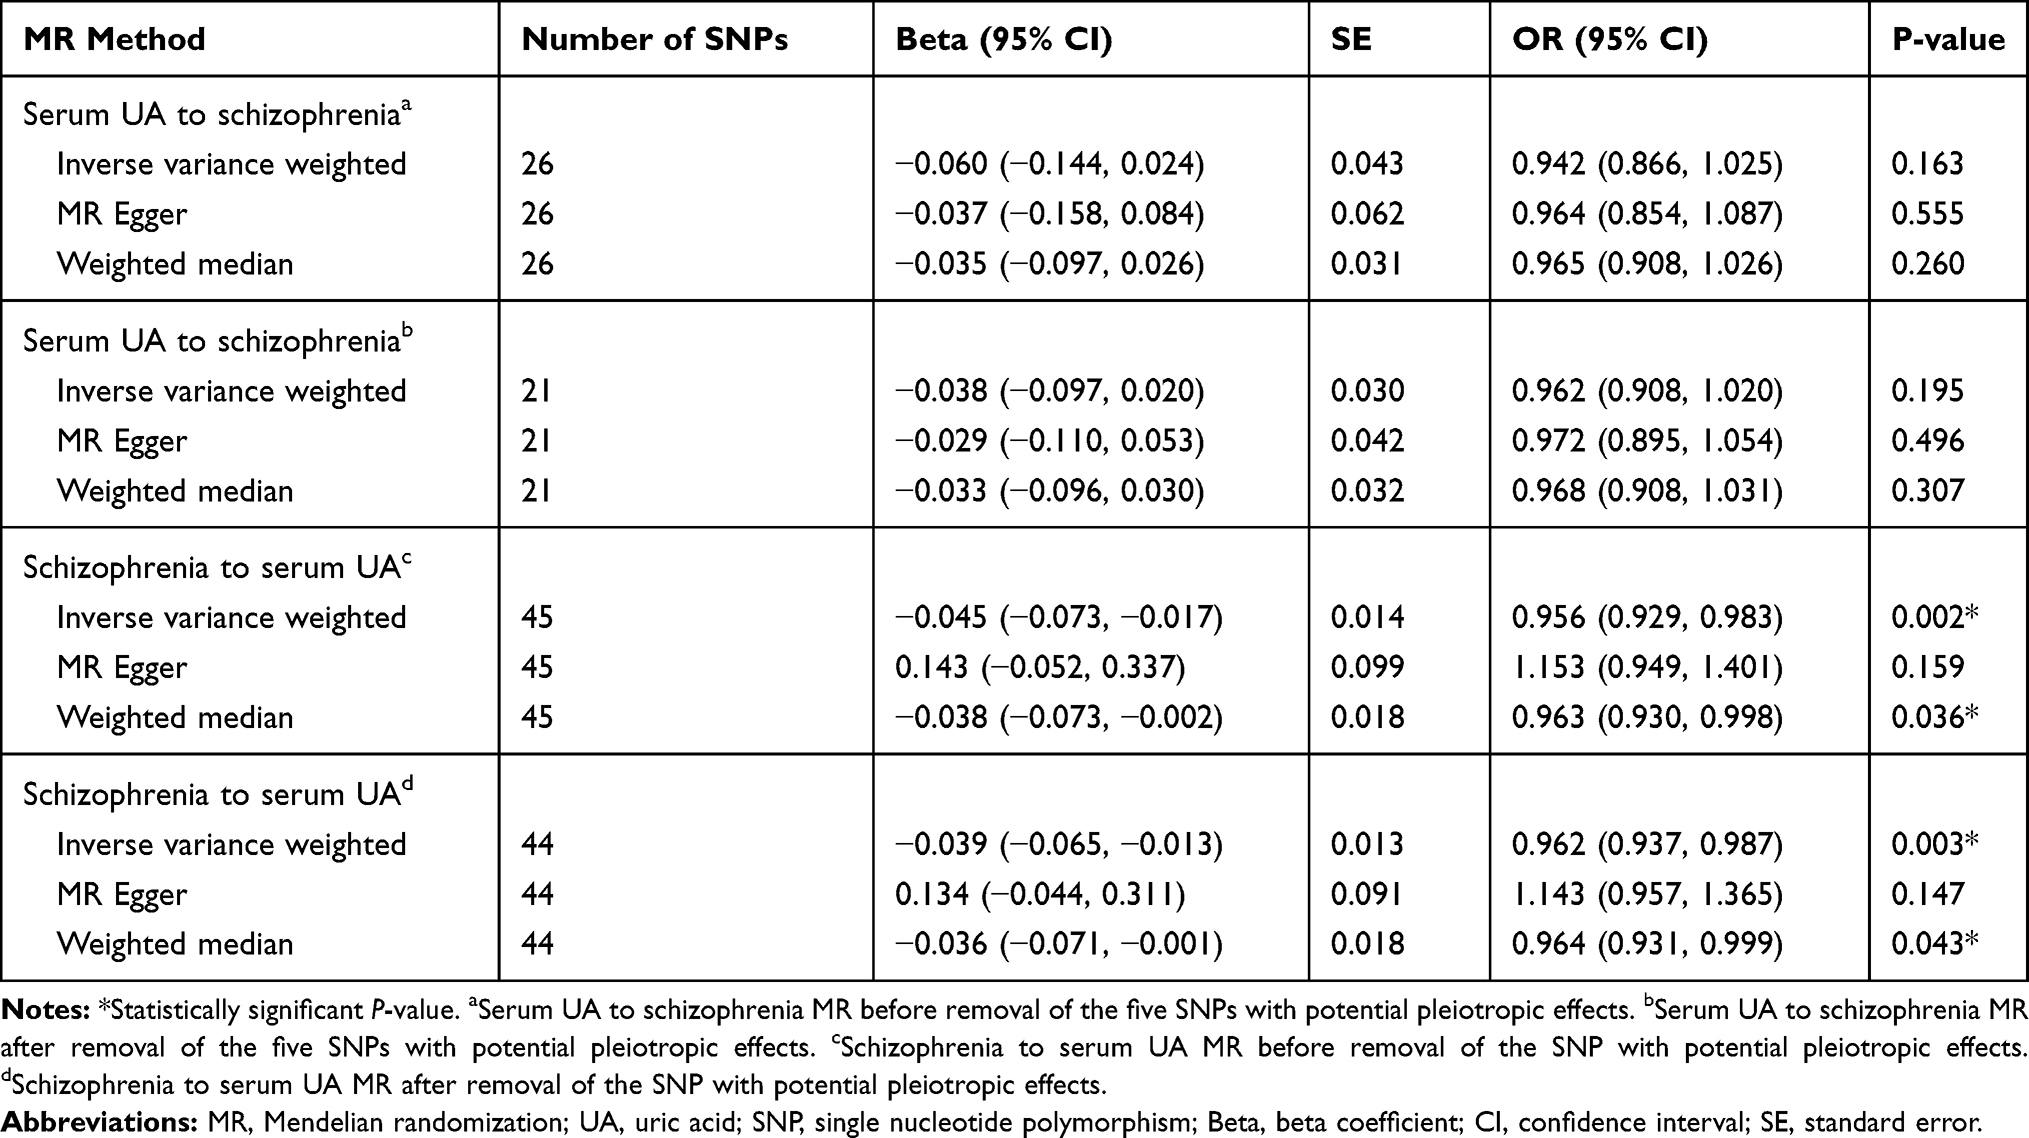 |
Table 1 Results of Two-Sample Bidirectional MR Analyses on the Causal Effects Between Serum UA and Schizophrenia |
MR Results of Schizophrenia to Serum UA
The results of IVW method showed a causal effect of schizophrenia risk on serum UA before and after removal of the SNP (rs10803138) with potential pleiotropic effects (per 10-s% increase in schizophrenia risk, beta: −0.045, standard error (SE): 0.014, P = 0.002; beta: −0.039, SE: 0.013, P = 0.003; respectively) (Table 1). Meanwhile, a causal relationship between schizophrenia risk and serum UA was demonstrated by the weighted median approach before and after removal of the SNP (rs10803138) with potential pleiotropic effects as well (per 10-s% increase in schizophrenia risk, beta: −0.038, SE: 0.018, P = 0.036; beta: −0.036, SE: 0.018, P = 0.043; respectively) (Table 1). However, no causal association was observed between schizophrenia risk and serum UA by using MR Egger regression analysis before and after removal of the SNP (rs10803138) with potential pleiotropic effects (per 10-s% increase in schizophrenia risk, beta: 0.143, SE: 0.099, P = 0.159; beta: 0.134, SE: 0.091, P = 0.147; respectively) (Table 1). The result of MR Egger regression was inconsistent with those findings from IVW and weighted median method.
GRSUA and Schizophrenia, GRSSCZ and Serum UA
Consistent with the MR results of serum UA to schizophrenia, the GRSUA revealed no causal effect of serum UA on schizophrenia risk (per 10-s% increment in UA, OR: 0.963, 95% CI: 0.913–1.015, P = 0.154) (Table 2, Figure 2). Meanwhile, a consistent causal relationship was found with the MR results of schizophrenia to serum UA. The GRSSCZ showed a significant effect of schizophrenia on serum UA (per 10-s% increase in schizophrenia risk, beta: −0.039, SE: 0.013, P = 0.002) (Table 2, Figure 3).
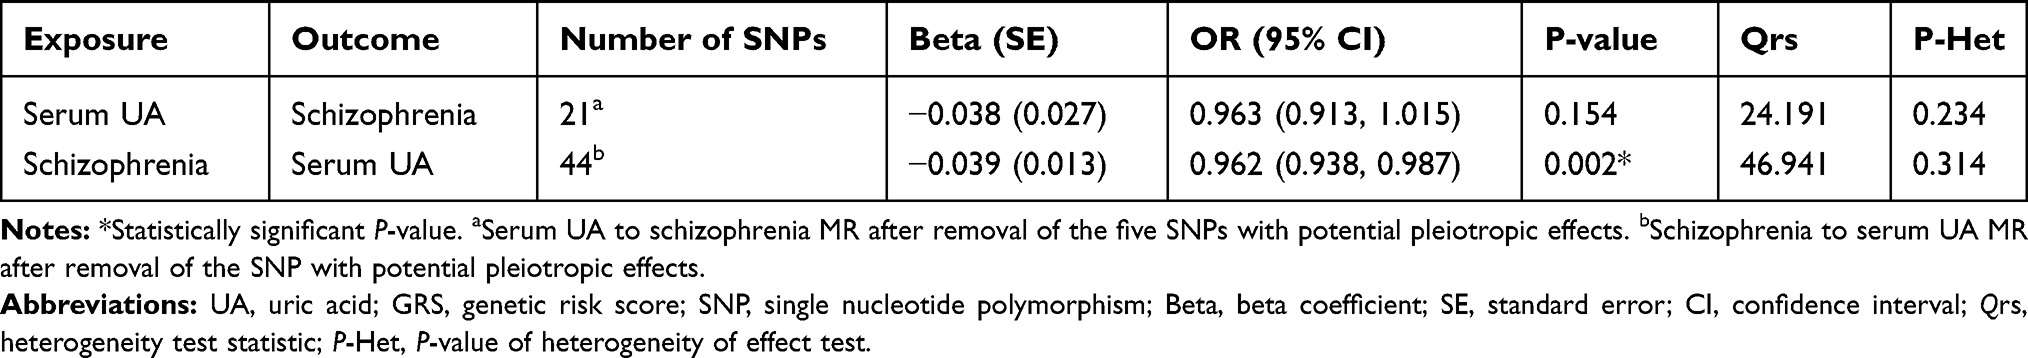 |
Table 2 The Effect of the GRS Instrument of Serum UA on Schizophrenia and the Effect of the GRS Instrument of Schizophrenia on Serum UA |
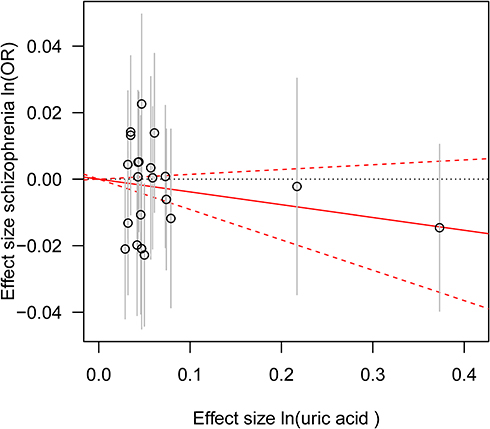 |
Figure 2 Genetic risk score GRSUA for schizophrenia. Notes: The estimated effects on schizophrenia risk (vertical axis) are plotted against the estimated effects on serum UA (horizontal axis). The 95% confidence interval (CI) for each individual UA-associated SNP is shown by vertical grey lines. The estimate of causal effect of serum UA levels on schizophrenia risk is shown by a red solid line with gradient, and 95% CI is denoted by red dashed lines.Abbreviation: OR, odds ratio. |
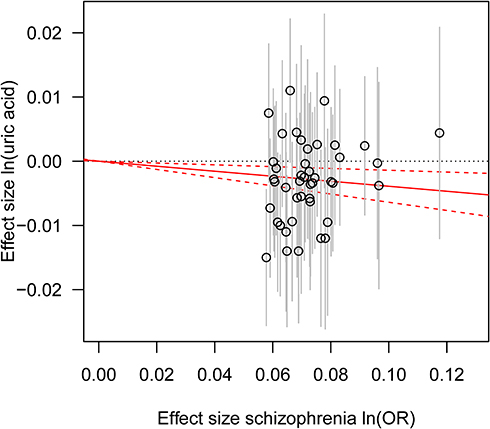 |
Figure 3 Genetic risk score GRSSCZ for serum UA. Notes: The estimated effects on serum UA (vertical axis) are plotted against estimated effects on schizophrenia risk (horizontal axis). The 95% confidence interval (CI) for each individual schizophrenia-associated SNP is shown by vertical grey lines. The estimate of causal effect of schizophrenia risk on serum UA levels is shown by a red solid line with gradient, and 95% CI is denoted by red dashed lines.Abbreviation: OR, odds ratio. |
Heterogeneity and Sensitivity Tests
Cochran’s Q test showed certain heterogeneity among both serum UA IV estimates based on the 26 SNPs and schizophrenia IV estimates based on the 45 SNPs (Table 3). The heterogeneity may indicate the possibility of pleiotropic effects of the SNPs. We subsequently performed a stepwise removal of SNPs until the Cochran’s Q test did not differ from the null, and finally, 5 SNPs were removed from the serum UA IV and 1 SNP was removed from the schizophrenia IV (Table 3). Of note, the MR Egger regression revealed no evidence that the result was likely to be biased by directional pleiotropy for serum UA to schizophrenia MR before and after removal of the five SNPs with potential pleiotropic effects (intercept = −0.003, P = 0.606; intercept = −0.001, P = 0.742; respectively) and for schizophrenia to serum UA MR before and after removal of the SNP with potential pleiotropic effects (intercept = −0.014, P = 0.063; intercept = −0.013, P = 0.060; respectively) (Table 3). The “leave-one-out” analysis showed the IVW causal association estimate was not driven by a single SNP either (Figures S1−S4).
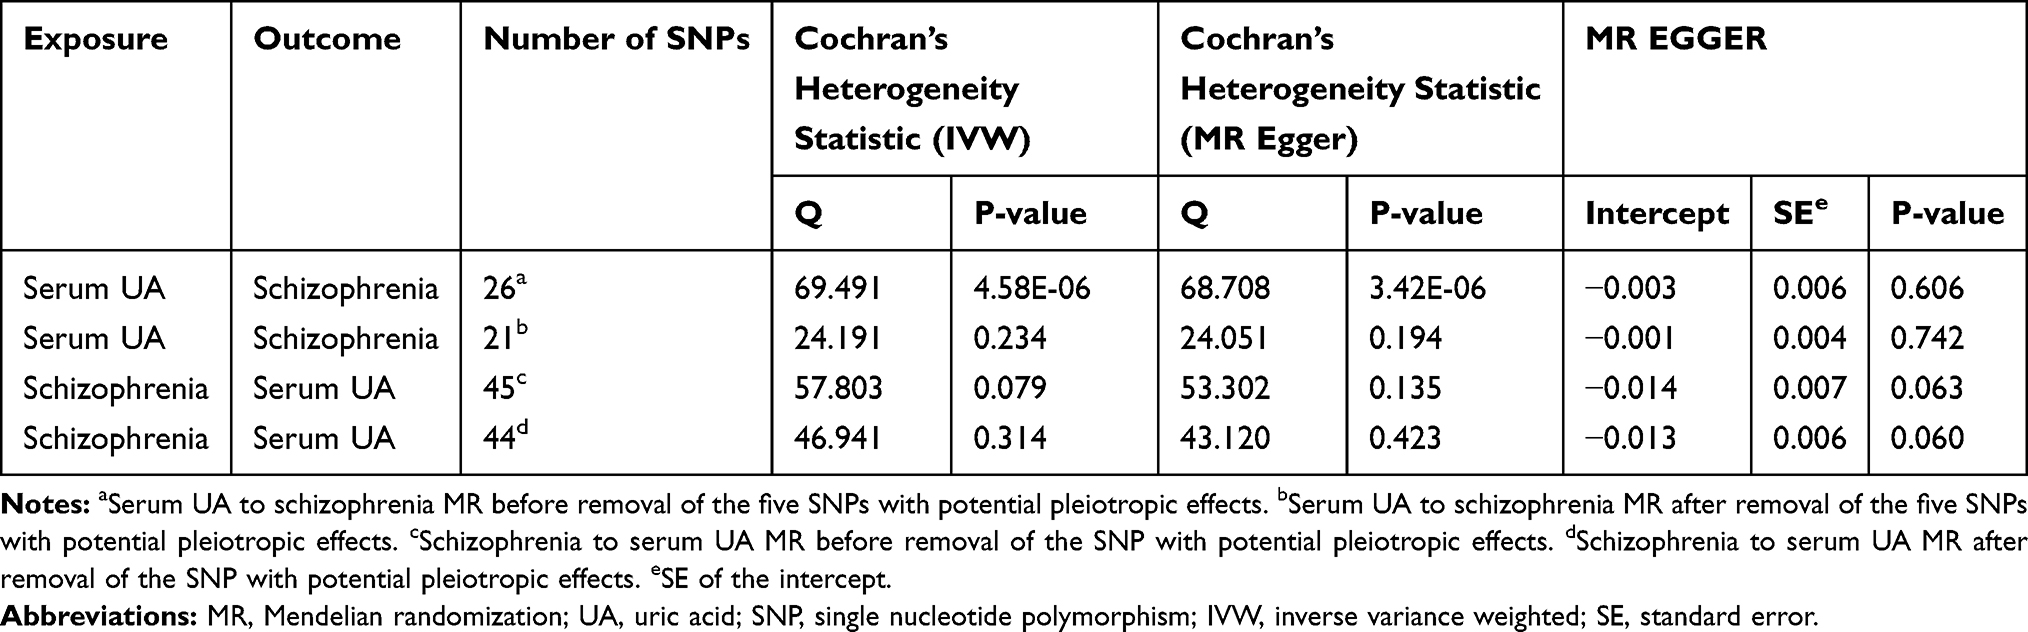 |
Table 3 Cochran’s Heterogeneity Statistic and MR Egger Intercept, Indicating Horizontal Pleiotropy for Two-Sample Bidirectional MR Analyses Between Serum UA and Schizophrenia |
As for GRSexposure and outcome, the results showed no evidence of the heterogeneity effects on outcome risk relative to the estimated effects on exposure in both directions (Qrs = 24.191, P-Het = 0.234 in forward-direction MR; Qrs = 46.941, P-Het = 0.314 in reverse-direction MR) (Table 2). Taken together, the results of both directions were unlikely to be biased by directional pleiotropy.
Discussion
To our knowledge, this is the first to use a two-sample bidirectional MR approach with various sensitivity analyses to investigate the causal relationship between serum UA and schizophrenia. Our results provide evidence that the effect of schizophrenia risk on serum UA may be causal, whereas the MR estimate for the serum UA-to-schizophrenia relation is unlikely to be causal.
The published observational studies on the association between serum UA levels and schizophrenia have yielded inconsistent results.54–57 The case-control studies found the schizophrenia group had lower serum UA levels than the healthy control group.56,57 However, Gültekin et al found UA levels in patients with schizophrenia were higher than in healthy males,55 and a cross-sectional study did not find significant differences in blood UA levels between patients with schizophrenia and controls.54 All these studies did not control for the dietary confounding factors which may affect the serum UA levels.13 Confounding factors (dietary factors and smoking) and other residual confounding elements naturally could not be fully excluded in epidemiological studies,13 which might bias the observed estimates. A way to control for confounding factors is MR study, which uses genetic IVs that were randomly allocated during conception; thus, lifestyle or sociodemographic factors are probably not going to confound genetic predictors of exposure, as stated previously.58 Therefore, we used SNPs as IVs to assess whether serum UA is associated with schizophrenia and determine whether the association is causally independent of confounding factors by MR.
In the present study, the results from all the three MR methods provided no causal relationship between serum UA and schizophrenia risk. Cochran’s Q test suggested heterogeneity in the first forward-direction MR (serum UA to schizophrenia MR before removal of the 5 SNPs with potential pleiotropic effects). After excluding the 5 SNPs with potential pleiotropic effects, the three MR methods’ estimates still provided no causal relationship between serum UA and schizophrenia risk. Moreover, Cochran’s Q test did not show heterogeneity among the serum UA IV estimates, and MR Egger regression result did not show any bias by directional pleiotropy. Therefore, bias may not exist by not violating one of the assumptions of MR that any genetic effect on the outcome was indirect but via exposure. In accordance with these MR results, the results from GRSUA and schizophrenia analysis also supported that serum UA was not causally related to schizophrenia.
Our study also indicated the effect of schizophrenia risk on serum UA may be causal. Both IVW method and weighted median approach suggested a causal effect of the schizophrenia risk on serum UA, and the MR Egger regression analysis suggested a null causal effect. When the genetic variants are uncorrelated, the IVW method using summarized data gives similar estimates to the two-stage least squares estimate that commonly used in the individual-level data.41 Furthermore, the IVW method had greater empirical power than that of two-stage least squares estimate.41 As for the weighted median approach, which assesses consistently when up to half of the weight comes from invalid IVs, it is shown to have better finite-sample Type 1 error rates than the IVW method.44 Moreover, compared to MR Egger regression analysis, the weighted median approach has the strength of holding prominent accuracy in the estimates.44 Thus, the effect of the schizophrenia risk on serum UA was potentially causal, as indicated by the IVW and weighted median approach. When we further analyzed the relationship between GRSSCZ and serum UA, we found GRSSCZ was related to serum UA as well. The schizophrenia SNPs, separately or combined as the GRS, were causally related to serum UA. Taken together, the genetic risk for schizophrenia may causally reduce the serum UA levels.
Recent studies have shown that the prevalence of smoking in patients with schizophrenia was about 60%.37,59 Some evidence has demonstrated that smoking reduced serum UA levels.36,60,61 So smoking may be a potential confounder for the relationship between serum UA and schizophrenia risk. Considering the confounding effects, we removed those SNPs associated with smoking as well as associated with UA and schizophrenia, and the causal relationship between schizophrenia and UA still persisted. Previously, studies have indicated the schizophrenia-to-low serum UA causality is biologically plausible. Schizophrenia is related to a complex pathophysiology and is a result of radical-mediated neurotoxicity.56 The antioxidative properties of UA include reaction with and inactivation of peroxynitrite,62 nitric oxide and hydroxyl radical.63,64 In the deactivating procedure, UA is demolished and easily oxidized at a comparable rate.10 Because of the antioxidative properties, serum UA levels deplete in a state of oxidative stress, as observed in patients with schizophrenia. Furthermore, UA is the final product of purine metabolism (xanthine oxidase catalyzes the conversion of xanthine to UA), in which the conversions of guanosine to guanine or xanthosine to xanthine are reversible.2 In patients with FSPR, significantly higher levels of xanthosine and lower levels of guanine were seen compared to healthy control subjects, and diminished product–precursor ratios indicate a shift favorable to xanthosine production from xanthine, thereby decreasing the UA levels.2 Therefore, a low UA may be a consequence of schizophrenia. A study on the metabolomics of schizophrenia observed a reduction of UA in the patient with schizophrenia group in comparison with the control group, suggesting that UA is a potential biomarker for monitoring the therapy or diagnosis of schizophrenia.65 Although decreased UA is a defensive consequence of schizophrenia, further studies are needed to clarify precise mechanisms.
Our study has several strengths. First, the sample size is large. In particular, the summary data from PGC GWAS comprising a total of 36,989 schizophrenia cases increased our analysis power. Moreover, our study using MR methods as well as GRS analysis increases the reliability of the results, and both showed a consistent result. Our sensitivity analyses also indicated robustness. To the best of our knowledge, no existing MR study has investigated on the causal relationship between serum UA and schizophrenia. Our work is the first to use a two-sample bidirectional MR approach with a variety of sensitivity analyses to investigate the causal relationship between serum UA and schizophrenia.
However, our study has several limitations. First, only 45 SNPs of the 119 remaining non-palindromic SNPs significantly associated with schizophrenia were matched in the outcome data directly and used as IVs for schizophrenia. We also did not find proxy SNPs in the schizophrenia-to-serum UA MR. If the relationships of the excluded SNPs with serum UA differed from the relationships of the included SNPs, then our results would be biased. However, using excessive proxy SNPs may produce unreliable results. Second, the subjects used in our analyses mostly are European ancestry, which minimized the possibility of population stratification bias. However, given that causality may rely upon ethnicity and selection bias, performing further MR studies in other populations is expected. Finally, the summarized data in our MR analyses did not classify schizophrenia (ie, into FSPR and chronic schizophrenia). Hence, further stratification of schizophrenia needs to conduct in future analyses if possible.
Conclusion
We conducted the first two-sample bidirectional MR analysis to assess the causal relationship between serum UA concentrations and schizophrenia. A causal role of serum UA concentrations in schizophrenia was not supported by our MR analyses, suggesting that diminishing serum UA levels may not mean hazard increment for schizophrenia in European individuals and UA does not seem to be a relevant therapeutic target. By contrast, our evidence supported the causal effect of schizophrenia risk on serum UA, suggesting that serum UA may be a potential biomarker for monitoring the therapy or diagnosis of schizophrenia. Earlier observational studies were susceptible to reverse causation because it is the pathophysiology, behavior or treatment of people with schizophrenia seem to influence uric acid levels.
Abbreviations
UA, uric acid; MR, Mendelian randomization; GRS, genetic risk score; FSPR, first-episode schizophrenia; GWAS, genome-wide association study; SE, standard error; IV, instrumental variable; SNP, single nucleotide polymorphism; GUGC, Global Urate Genetics Consortium; PGC, Psychiatric Genomics Consortium; IVW, inverse variance weighted; s%, symmetric percentage; OR, odds ratio; CI, confidence interval.
Acknowledgments
We thank the GUGC and the PGC for providing the summarized data from the GWAS of UA and schizophrenia for these analyses. This work was supported by National Natural Science Foundation of China [grant number 81770759]; the Major Project of Guangxi Innovation Driven [grant number AA18118016]; and National Key Research and Development Program of China [grant number 2017YFC0908000]. The funding sources had no role in the study design, data collection, data analysis, results interpretation of the present study, and in the writing of the manuscript.
Author Contributions
All authors contributed to data analysis, drafting or revising the article, gave final approval of the version to be published, and agreed to be accountable for all aspects of the work.
Disclosure
The authors report no conflicts of interest in this work.
References
1. van Dongen J, Boomsma DI. The evolutionary paradox and the missing heritability of schizophrenia. Am J Med Genet B Neuropsychiatr Genet. 2013;162B(2):122–136. doi:10.1002/ajmg.b.32135
2. Yao JK, Dougherty GG
3. Laursen TM. Life expectancy among persons with schizophrenia or bipolar affective disorder. Schizophr Res. 2011;131(1–3):101–104. doi:10.1016/j.schres.2011.06.008
4. Laursen TM, Munk-Olsen T, Vestergaard M. Life expectancy and cardiovascular mortality in persons with schizophrenia. Curr Opin Psychiatr. 2012;25(2):83–88. doi:10.1097/YCO.0b013e32835035ca
5. Yao JK, Reddy R, van Kammen DP. Reduced level of plasma antioxidant uric acid in schizophrenia. Psychiatry Res. 1998;80(1):29–39. doi:10.1016/S0165-1781(98)00051-1
6. Yao JK, Reddy R, van Kammen DP. Abnormal age-related changes of plasma antioxidant proteins in schizophrenia. Psychiatry Res. 2000;97(2–3):137–151. doi:10.1016/S0165-1781(00)00230-4
7. Reddy R, Keshavan M, Yao JK. Reduced plasma antioxidants in first-episode patients with schizophrenia. Schizophr Res. 2003;62(3):205–212. doi:10.1016/S0920-9964(02)00407-3
8. Pingmuangkaew P, Tangvarasittichai O, Tangvarasittichai S. Association of elevated serum uric acid with the components of metabolic syndrome and oxidative stress in abdominal obesity subjects. Indian J Clin Biochem. 2015;30(3):286–292. doi:10.1007/s12291-014-0462-0
9. Ishizaka Y, Yamakado M, Toda A, Tani M, Ishizaka N. Relationship between serum uric acid and serum oxidative stress markers in the Japanese general population. Nephron Clin Pract. 2014;128(1–2):49–56. doi:10.1159/000362456
10. Ames BN, Cathcart R, Schwiers E, Hochstein P. Uric acid provides an antioxidant defense in humans against oxidant- and radical-caused aging and cancer: a hypothesis. Proc Natl Acad Sci U S A. 1981;78(11):6858–6862. doi:10.1073/pnas.78.11.6858
11. Li X, Meng X, Timofeeva M, et al. Serum uric acid levels and multiple health outcomes: umbrella review of evidence from observational studies, randomised controlled trials, and Mendelian randomisation studies. BMJ. 2017;357:j2376. doi:10.1136/bmj.j2376
12. Flatow J, Buckley P, Miller BJ. Meta-analysis of oxidative stress in schizophrenia. Biol Psychiatry. 2013;74(6):400–409. doi:10.1016/j.biopsych.2013.03.018
13. Pae C-U, Paik I-H, Lee C, Lee S-J, Kim J-J, Lee C-U. Decreased plasma antioxidants in schizophrenia. Neuropsychobiology. 2004;50(1):54–56. doi:10.1159/000077942
14. Sullivan PF, Kendler KS, Neale MC. Schizophrenia as a complex trait: evidence from a meta-analysis of twin studies. Arch Gen Psychiatry. 2003;60(12):1187–1192. doi:10.1001/archpsyc.60.12.1187
15. Lichtenstein P, Yip BH, Bjork C, et al. Common genetic determinants of schizophrenia and bipolar disorder in Swedish families: a population-based study. Lancet. 2009;373(9659):234–239. doi:10.1016/S0140-6736(09)60072-6
16. Schizophrenia Working Group of the Psychiatric Genomics C. SBiological insights from 108 schizophrenia-associated genetic loci. Nature. 2014;511(7510):421–427. doi:10.1038/nature13595
17. Kalousdian S, Fabsitz R, Havlik R, Christian J, Rosenman R. Heritability of clinical chemistries in an older twin cohort: the NHLBI Twin Study. Genet Epidemiol. 1987;4(1):1–11. doi:10.1002/gepi.1370040102
18. Rice T, Vogler GP, Perry TS, Laskarzewski PM, Province MA, Rao DC. Heterogeneity in the familial aggregation of fasting serum uric acid level in five North American populations: the lipid research clinics family study. Am J Med Genet. 1990;36(2):219–225. doi:10.1002/(ISSN)1096-8628
19. Wilk JB, Djousse L, Borecki I, et al. Segregation analysis of serum uric acid in the NHLBI family heart study. Hum Genet. 2000;106(3):355–359. doi:10.1007/s004390000243
20. Kottgen A, Albrecht E, Teumer A, et al. Genome-wide association analyses identify 18 new loci associated with serum urate concentrations. Nat Genet. 2013;45(2):145–154. doi:10.1038/ng.2500
21. Smith GD, Ebrahim S. Mendelian randomization: prospects, potentials, and limitations. Int J Epidemiol. 2004;33(1):30–42. doi:10.1093/ije/dyh132
22. Sheehan NA, VD P, Burton R, Tobin MD. Mendelian randomisation and causal inference in observational epidemiology. PLoS Med. 2008;5(8):1205–1210. doi:10.1371/journal.pmed.0050177
23. Bochud M, Rousson V. Usefulness of Mendelian randomization in observational epidemiology. Int J Environ Res Public Health. 2010;7(3):711–728. doi:10.3390/ijerph7030711
24. Smith GD, Ebrahim S. ‘Mendelian randomization’: can genetic epidemiology contribute to understanding environmental determinants of disease? Int J Epidemiol. 2003;32(1):1–22. doi:10.1093/ije/dyg070
25. Qian Y, Ye D, Wu DJ, et al. Role of cigarette smoking in the development of ischemic stroke and its subtypes: a Mendelian randomization study. Clin Epidemiol. 2019;11:725–731. doi:10.2147/CLEP.S215933
26. Gao X, Meng LX, Ma KL, et al. The bidirectional causal relationships of insomnia with five major psychiatric disorders: a Mendelian randomization study. Eur Psychiatry. 2019;60:79–85. doi:10.1016/j.eurpsy.2019.05.004
27. Polimanti R, Gelernter J, Stein DJ. Genetically determined schizophrenia is not associated with impaired glucose homeostasis. Schizophr Res. 2018;195:286–289. doi:10.1016/j.schres.2017.10.033
28. Hartwig FP, Borges MC, Horta BL, Bowden J, Davey Smith G. Inflammatory biomarkers and risk of schizophrenia: a 2-sample Mendelian randomization study. JAMA Psychiatry. 2017;74(12):1226–1233. doi:10.1001/jamapsychiatry.2017.3191
29. Noyce AJ, Kia DA, Hemani G, et al. Estimating the causal influence of body mass index on risk of parkinson disease: a Mendelian randomisation study. PLoS Med. 2017;14(6):e1002314. doi:10.1371/journal.pmed.1002314
30. Xu L, Borges MC, Hemani G, Lawlor DA. The role of glycaemic and lipid risk factors in mediating the effect of BMI on coronary heart disease: a two-step, two-sample Mendelian randomisation study. Diabetologia. 2017;60(11):2210–2220. doi:10.1007/s00125-017-4396-y
31. Zhang B, Shu X-O, Delahanty RJ, et al. Height and breast cancer risk: evidence from prospective studies and Mendelian randomization. J Natl Cancer Inst. 2015;107:11. doi:10.1093/jnci/djv219
32. Casas JP, Bautista LE, Smeeth L, Sharma P, Hingorani AD. Homocysteine and stroke: evidence on a causal link from mendelian randomisation. Lancet. 2005;365(9455):224–232. doi:10.1016/S0140-6736(05)70152-5
33. Hemani G, Zheng J, Elsworth B, et al. The MR-base platform supports systematic causal inference across the human phenome. Elife. 2018;7:e34408. doi:10.7554/eLife.34408
34. Keenan T, Zhao W, Rasheed A, et al. Causal assessment of serum urate levels in cardiometabolic diseases through a Mendelian randomization study. J Am Coll Cardiol. 2016;67(4):407–416. doi:10.1016/j.jacc.2015.10.086
35. Yuan H, Yang W. Genetically determined serum uric acid and alzheimer’s disease risk. J Alzheimers Dis. 2018;65(4):1259–1265. doi:10.3233/JAD-180538
36. Tsuchiya M, Asada A, Kasahara E, Sato EF, Shindo M, Inoue M. Smoking a single cigarette rapidly reduces combined concentrations of nitrate and nitrite and concentrations of antioxidants in plasma. Circulation. 2002;105(10):1155–1157. doi:10.1161/hc1002.105935
37. de Leon J, Diaz FJ. A meta-analysis of worldwide studies demonstrates an association between schizophrenia and tobacco smoking behaviors. Schizophr Res. 2005;76(2–3):135–157. doi:10.1016/j.schres.2005.02.010
38. Kamat MA, Blackshaw JA, Young R, et al. PhenoScanner V2: an expanded tool for searching human genotype-phenotype associations. Bioinformatics. 2019;35(22):4851–4853. doi:10.1093/bioinformatics/btz469
39. Buniello A, MacArthur JAL, Cerezo M, et al. The NHGRI-EBI GWAS Catalog of published genome-wide association studies, targeted arrays and summary statistics 2019. Nucleic Acids Res. 2019;47(D1):D1005–D1012. doi:10.1093/nar/gky1120
40. Hartwig FP, Davies NM, Hemani G, Davey Smith G. Two-sample Mendelian randomization: avoiding the downsides of a powerful, widely applicable but potentially fallible technique. Int J Epidemiol. 2016;45(6):1717–1726. doi:10.1093/ije/dyx028
41. Burgess S, Butterworth A, Thompson SG. Mendelian randomization analysis with multiple genetic variants using summarized data. Genet Epidemiol. 2013;37(7):658–665. doi:10.1002/gepi.21758
42. Burgess S, Thompson SG. Interpreting findings from Mendelian randomization using the MR-Egger method. Eur J Epidemiol. 2017;32(5):377–389. doi:10.1007/s10654-017-0255-x
43. Bowden J, Davey Smith G, Burgess S. Mendelian randomization with invalid instruments: effect estimation and bias detection through Egger regression. Int J Epidemiol. 2015;44(2):512–525. doi:10.1093/ije/dyv080
44. Bowden J, Davey Smith G, Haycock PC, Burgess S. Consistent estimation in mendelian randomization with some invalid instruments using a weighted median estimator. Genet Epidemiol. 2016;40(4):304–314. doi:10.1002/gepi.2016.40.issue-4
45. Cole TJ. Sympercents: symmetric percentage differences on the 100 log(e) scale simplify the presentation of log transformed data. Stat Med. 2000;19(22):3109–3125. doi:10.1002/1097-0258(20001130)19:22<3109::AID-SIM558>3.0.CO;2-F
46. Egger M, Smith GD, Phillips AN. Meta-analysis: principles and procedures. BMJ. 1997;315(7121):1533–1537. doi:10.1136/bmj.315.7121.1533
47. Greco MFD, Minelli C, Sheehan NA, Thompson JR. Detecting pleiotropy in Mendelian randomisation studies with summary data and a continuous outcome. Stat Med. 2015;34(21):2926–2940. doi:10.1002/sim.v34.21
48. Prins BP, Abbasi A, Wong A, et al. Investigating the causal relationship of C-reactive protein with 32 complex somatic and psychiatric outcomes: a large-scale cross-consortium Mendelian randomization study. PLoS Med. 2016;13(6):e1001976. doi:10.1371/journal.pmed.1001976
49. Brion M-JA, Shakhbazov K, Visscher PM. Calculating statistical power in Mendelian randomization studies. Int J Epidemiol. 2013;42(5):1497–1501. doi:10.1093/ije/dyt179
50. Pierce BL, Ahsan H, Vanderweele TJ. Power and instrument strength requirements for Mendelian randomization studies using multiple genetic variants. Int J Epidemiol. 2011;40(3):740–752. doi:10.1093/ije/dyq151
51. Burgess S, Davies NM, Thompson SG. Bias due to participant overlap in two-sample Mendelian randomization. Genet Epidemiol. 2016;40(7):597–608. doi:10.1002/gepi.21998
52. Dastani Z, Hivert MF, Timpson N, et al. Novel loci for adiponectin levels and their influence on type 2 diabetes and metabolic traits: a multi-ethnic meta-analysis of 45,891 individuals. PLoS Genet. 2012;8(3):e1002607. doi:10.1371/journal.pgen.1002607
53. Voight BF, Peloso GM, Orho-Melander M, et al. Plasma HDL cholesterol and risk of myocardial infarction: a mendelian randomisation study. Lancet. 2012;380(9841):572–580. doi:10.1016/S0140-6736(12)60312-2
54. Fujimaki K, Toki S, Yamashita H, Oyamada T, Yamawaki S. Predictors of negative symptoms in the chronic phase of schizophrenia: a cross-sectional study. Psychiatry Res. 2018;262:600–608. doi:10.1016/j.psychres.2017.09.051
55. Gultekin BK, Kesebir S, Kabak SG, Ergun FF, Tatlidil Yaylaci E. Are uric acid levels different from healthy subjects in bipolar affective disorder and schizophrenia?: Relationship between clinical improvement and episode severity in male patients. Noro Psikiyatr Ars. 2014;51(3):229–232. doi:10.4274/npa.y6827
56. Dadheech G, Sharma P, Gautam S. Oxidative stress-induced response of some endogenous antioxidants in schizophrenia. Indian J Clin Biochem. 2012;27(3):278–283. doi:10.1007/s12291-012-0193-z
57. Akanji AO, Ohaeri JU, Al-Shammri SA, Fatania HR. Associations of blood levels of insulin-like growth factor (IGF)-I, IGF-II and IGF binding protein (IGFBP)-3 in schizophrenic Arab subjects. Clin Chem Lab Med. 2007;45(9):1229–1231. doi:10.1515/CCLM.2007.265
58. Smith GD, Lawlor DA, Harbord R, Timpson N, Day I, Ebrahim S. Clustered environments and randomized genes: a fundamental distinction between conventional and genetic epidemiology. PLoS Med. 2007;4(12):e352. doi:10.1371/journal.pmed.0040352
59. Salokangas RK, Honkonen T, Stengard E, Koivisto AM, Hietala J. Cigarette smoking in long-term schizophrenia. Eur Psychiatry. 2006;21(4):219–223. doi:10.1016/j.eurpsy.2005.07.008
60. Haj Mouhamed D, Ezzaher A, Neffati F, Douki W, Gaha L, Najjar MF. Effect of cigarette smoking on plasma uric acid concentrations. Environ Health Prev Med. 2011;16(5):307–312. doi:10.1007/s12199-010-0198-2
61. Gee Teng G, Pan A, Yuan JM, Koh WP. Cigarette smoking and the risk of incident gout in a prospective cohort study. Arthritis Care Res (Hoboken). 2016;68(8):1135–1142. doi:10.1002/acr.22821
62. Keller JN, Kindy MS, Holtsberg FW, et al. Mitochondrial manganese superoxide dismutase prevents neural apoptosis and reduces ischemic brain injury: suppression of peroxynitrite production, lipid peroxidation, and mitochondrial dysfunction. J Neurosci. 1998;18(2):687–697. doi:10.1523/JNEUROSCI.18-02-00687.1998
63. van der Veen RC, Hinton DR, Incardonna F, Hofman FM. Extensive peroxynitrite activity during progressive stages of central nervous system inflammation. J Neuroimmunol. 1997;77(1):1–7. doi:10.1016/S0165-5728(97)00013-1
64. Davies KJ, Sevanian A, Muakkassah-Kelly SF, Hochstein P. Uric acid-iron ion complexes. A new aspect of the antioxidant functions of uric acid. Biochem J. 1986;235(3):747–754. doi:10.1042/bj2350747
65. Xuan J, Pan G, Qiu Y, et al. Metabolomic profiling to identify potential serum biomarkers for schizophrenia and risperidone action. J Proteome Res. 2011;10(12):5433–5443. doi:10.1021/pr2006796
 © 2020 The Author(s). This work is published and licensed by Dove Medical Press Limited. The
full terms of this license are available at https://www.dovepress.com/terms
and incorporate the Creative Commons Attribution
- Non Commercial (unported, 3.0) License.
By accessing the work you hereby accept the Terms. Non-commercial uses of the work are permitted
without any further permission from Dove Medical Press Limited, provided the work is properly
attributed. For permission for commercial use of this work, please see paragraphs 4.2 and 5 of our Terms.
© 2020 The Author(s). This work is published and licensed by Dove Medical Press Limited. The
full terms of this license are available at https://www.dovepress.com/terms
and incorporate the Creative Commons Attribution
- Non Commercial (unported, 3.0) License.
By accessing the work you hereby accept the Terms. Non-commercial uses of the work are permitted
without any further permission from Dove Medical Press Limited, provided the work is properly
attributed. For permission for commercial use of this work, please see paragraphs 4.2 and 5 of our Terms.