Back to Journals » OncoTargets and Therapy » Volume 8
Assessing the potential value of long interspersed element-1 hypomethylation in colorectal cancer: evidence from retrospective studies
Authors Tang J, Wang Z, Fang J
Received 7 July 2015
Accepted for publication 12 September 2015
Published 5 November 2015 Volume 2015:8 Pages 3265—3276
DOI https://doi.org/10.2147/OTT.S91941
Checked for plagiarism Yes
Review by Single anonymous peer review
Peer reviewer comments 3
Editor who approved publication: Dr William C. Cho
Jie-Ting Tang,1,2 Zhen-Hua Wang,1,2 Jing-Yuan Fang1,2
1Division of Gastroenterology and Hepatology, Renji Hospital, 2Shanghai Institute of Digestive Disease, School of Medicine, Shanghai Jiao Tong University, Shanghai, People’s Republic of China
Background and aims: Long interspersed element-1 (LINE-1) hypomethylation may play an important role in colorectal cancer (CRC). Studies were identified that investigated LINE-1 methylation levels in CRC compared with normal controls.
Methods: The random-effects model was used to estimate standardized mean difference with 95% confidence intervals according to the heterogeneity between the studies. We explored the relationship between LINE-1 hypomethylation and microsatellite instability (MSI) status, clinical features, and molecular features in CRC patients using a fixed-effects model.
Results: A total of 7396 CRC patients were included in the meta-analysis. LINE-1 methylation was significantly lower in CRC patients than in controls (P=0.000). Mean LINE-1 methylation was significantly lower in non-MSI-high than in MSI-high tumors (P=0.000). LINE-1 hypomethylation was found more frequently in patients with a family history compared with those without family history (P=0.002). Patients with left colon cancer had lower LINE-1 methylation than those with right colon cancer (P=0.001). LINE-1 methylation was not associated with body mass index or patient sex. LINE-1 hypomethylation was found in p21 lost tumors (P=0.000). LINE-1 methylation levels were not associated with KRAS or PIK3CA-mutation status.
Conclusion: LINE-1 hypomethylation is a potential biomarker for risk of CRC and associated with various clinical and molecular features of CRC.
Keywords: LINE-1, hypomethylation, colorectal cancer, MSI
Introduction
Epigenomic alterations, including DNA methylation, histone acetylation, and RNA editing are important mechanisms during human carcinogenesis.1–3 A considerable number of DNA methylation occurs in repetitive sequences. Long interspersed element-1 (LINE-1) is an interspersed repetitive DNA retrotransposon leading to genomic instability in cancer cells via influencing gene expression status.4 It duplicates via a copy-and-paste mechanism and rearranges the genome continuously. Its promoter is internally located in 5′ untranslated region ranging from +1 to 909 bp.5 The methylation status of LINE-1 was first demonstrated in cancer cell lines in 1993.6 LINE-1 hypomethylation was detected in head and neck squamous cell carcinoma, bladder cancer, gastric cancer, and so on, and was demonstrated to be associated with poor prognosis.7–10 Epigenetic changes of LINE-1 occur early during the process of carcinogenesis. LINE-1 methylation levels were found to be nearly normally distributed in CRC patients. Studies showed that LINE-1 methylation levels seemed to be checkered in CRC cell lines.11,12 Recently, an increasing number of studies have evaluated LINE-1 methylation levels in association with tumor progression of CRC. However, some of the results remain controversial in several studies.11,13 In a previous meta-analysis, LINE-1 hypomethylation in blood and tissues was evaluated in several types of cancer including CRC.14 Nevertheless, the results remain insufficient, and the role of LINE-1 hypomethylation in specific subgroups is needed to be better clarified. Hence, we conducted a meta-analysis to pool available trial data to more precisely estimate the values of LINE-1 hypomethylation in CRC patients.
Materials and methods
Search strategy
Systematic computerized searches of publications before January 2015 were performed using the PubMed, Embase, and the Web of Science databases. For both of the databases, keywords of (“colorectal cancer [CRC]” or “colorectal carcinoma”) AND (“LINE-1” or “long interspersed element-1”) AND (“hypomethylation” or “methylation”) were used to search eligible studies. Moreover, the bibliographies from selected articles and review articles were scrutinized to trace other potentially relevant studies.
Inclusion criteria and data extraction
Studies were included in the quantitative analysis only if they satisfied the following criteria: (1) case-control design, and (2) studies with available mean values and standard deviations (SDs) of LINE-1 methylation levels. The first two authors independently reviewed the papers for eligibility and quality. Disagreements were resolved by the third author. Data, including the first author’s name, year of publication, ethnicity, total number of cases and controls, testing methods for methylation analysis, testing materials in each study, and mean values and the SD of global DNA methylation levels for each group were collected.
Statistical analysis
The Stata version 11.0 software (StataCorp LP, College Station, TX, USA) was used for all data analyses. Heterogeneity of effect sizes across the studies was examined using the Q statistic. If the P-value was <0.05, then the random-effects model (DerSimonian and Laird method) was used to estimate the standardized mean difference (SMD) with 95% confidence interval (CI).15 Otherwise, a fixed-effects model (Mantel–Haenszel method) was used. Additionally, the magnitude of the between-study heterogeneity was also assessed by the I2 value. An I2 value of 0% denoted no observed heterogeneity, whereas 25% was “low”, 50% was “moderate”, and 75% was “high” heterogeneity.16 Furthermore, subgroup analyses were conducted based on ethnicity, and by methods used to measure global DNA methylation levels. Sensitivity analyses were performed to assess the contributions of single studies to the final results.
Funnel plots with the Begg’s test17 were visually evaluated for any asymmetry to detect a possible publication bias, in which a P-value <0.10 was considered representative of a statistically significant bias.18 Trim and fill analysis was applied if there was publication bias.19
Results
Characteristics of the included studies
Fourteen studies10,12,20–31 were identified according to our search strategy and study selection criteria in the final meta-analysis. In five studies,12,20–22,24 LINE-1 methylation levels were evaluated both in tumor and in normal controls tissues, among which, two papers20,24 included different cancer types, which were separated into substudies. The remaining ten studies10,23,25–32 included only CRC patients. The characteristics of all included studies are summarized in Table 1.
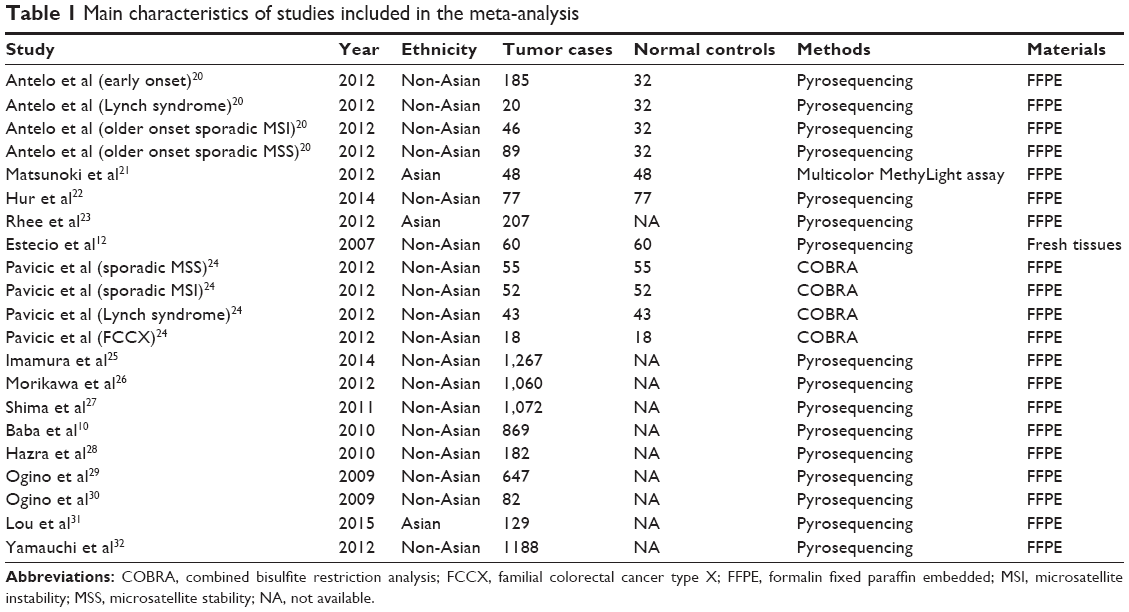 | Table 1 Main characteristics of studies included in the meta-analysis |
LINE-1 methylation levels decreased in CRC
LINE-1 methylation levels were successfully measured both in cancer and in normal controls tissues in five studies,12,20–22,24 including a total of 693 CRC samples. LINE-1 methylation levels were significantly lower in cancer patients than in the control samples (SMD: −2.26; 95% CI: −3.08, −1.45; z=5.44, P=0.000, Figure 1).
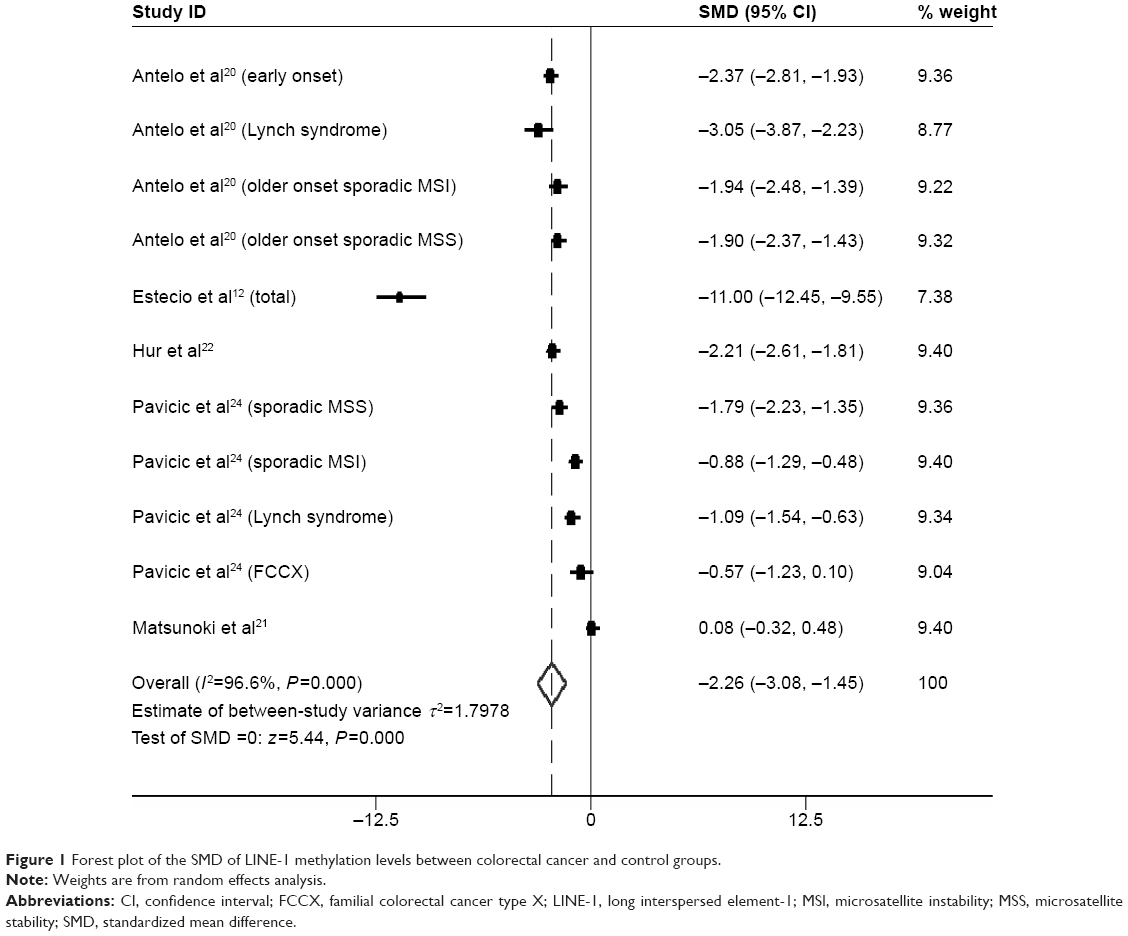 | Figure 1 Forest plot of the SMD of LINE-1 methylation levels between colorectal cancer and control groups. |
However, heterogeneity between studies was significantly high (I2=96.6%); thus, subgroup analysis based on ethnicity was performed. A total of ten studies12,20,22,24 (including substudies) were from non-Asian, and one21 from Asian countries. Methylation levels of LINE-1 were significantly lower in CRC patients than in control samples in the non-Asian subgroup (SMD: −2.48; 95% CI: −3.28, −1.68; P=0.000). Heterogeneity between studies, in the non-Asian subgroup, was still significantly high (I2=95.9%) (Figure 2).
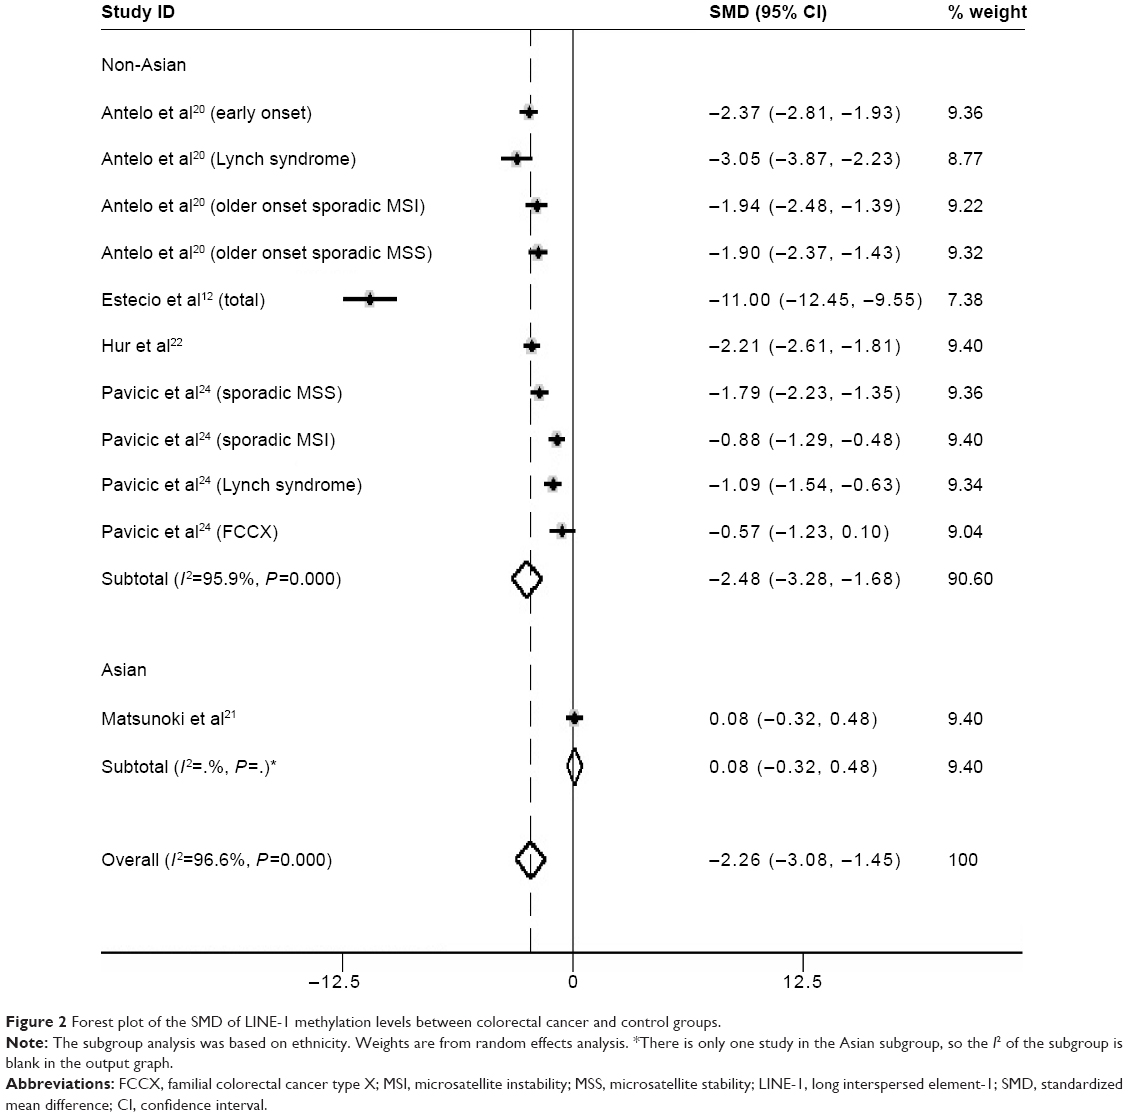 | Figure 2 Forest plot of the SMD of LINE-1 methylation levels between colorectal cancer and control groups. |
Subgroup analysis based on methods used to measure global DNA methylation levels was performed. Pyrosequencing was used in a total of six studies (including substudies), whereas combined bisulfite restriction analysis (COBRA) was used in four studies. Only one study24 used multicolor MethyLight assay to evaluate LINE-1 methylation level. The SMDs for pyrosequencing and COBRA LINE-1 subgroups were −3.53 (95% CI: −4.76, −2.30; P=0.000) and −1.11 (95% CI: −1.60, −0.62; P=0.005), respectively. Heterogeneity between studies was also significantly high (I2=96.6% and 76.3%, respectively) (Figure 3).
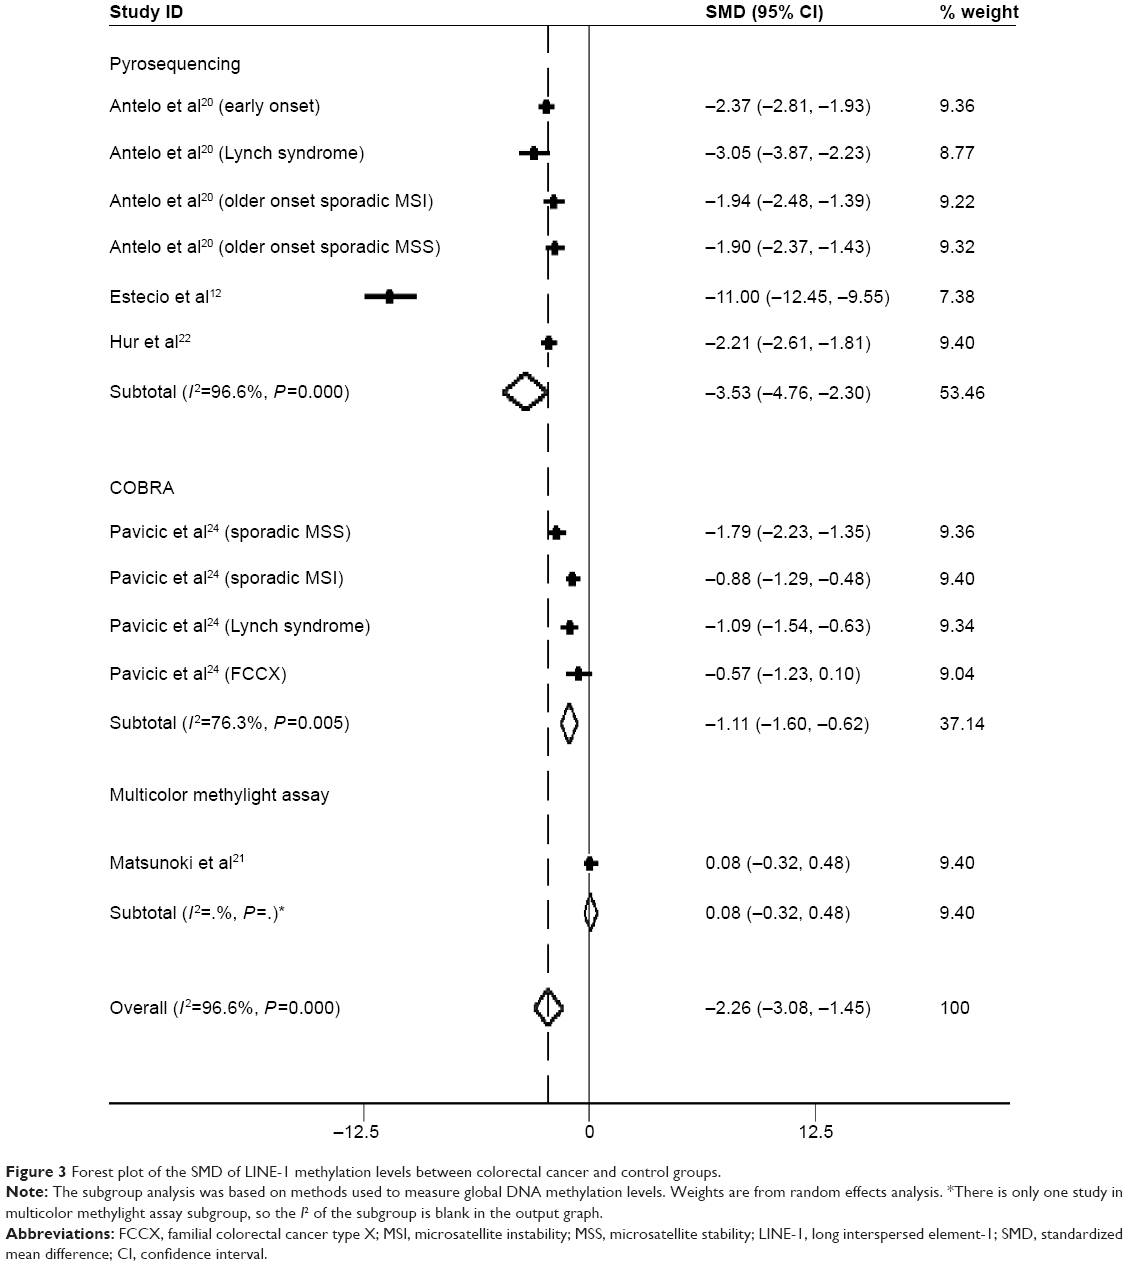 | Figure 3 Forest plot of the SMD of LINE-1 methylation levels between colorectal cancer and control groups. |
Sensitivity analysis and publication bias
Sensitivity analysis was performed to assess the influence of each individual study. The results suggested that no individual studies significantly affected the pooled SMD indicating a statistically robust result (Figure 4A).
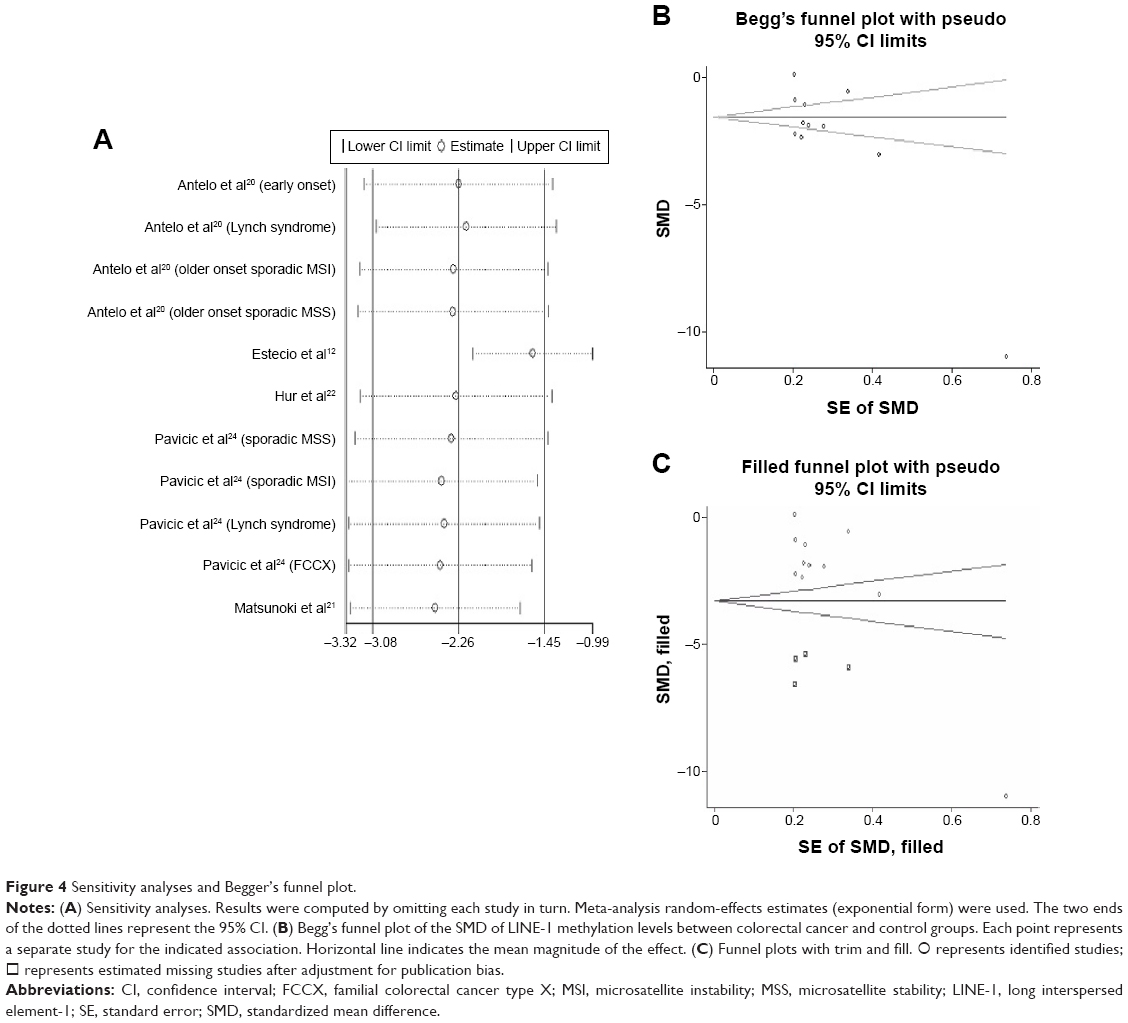 | Figure 4 Sensitivity analyses and Begger’s funnel plot. |
Begg’s funnel plot and Egger’s linear regression test were performed to assess the publication bias of the included studies. The shape of the funnel plot seemed to be asymmetrical in the dominant model (Figure 4B). Therefore, Egger’s test was applied to provide statistical evidence of funnel plot symmetry (t=−2.77, P=0.022). The results suggested that publication bias could not be completely excluded as a factor that influenced the present meta-analysis. Then, trim and fill method was applied. Data from four hypothetical negative unpublished studies were replaced respectively, and the filled funnel plot was symmetrical (Figure 4C). The pooled analysis continued to show a significantly lower level of LINE-1 methylation in cancer patients (SMD: −3.30; 95% CI: −4.50, −2.10; P=0.000).
LINE-1 hypomethylation is inversely related to the MSI status in CRC
The mean LINE-1 methylation level was significantly lower in non-microsatellite instability (MSI)-high tumors than in MSI-high tumors (SMD: −0.42; 95% CI: −0.52, −0.32; P=0.000). There was low heterogeneity between studies (I2=48.3%) (Figure 5).
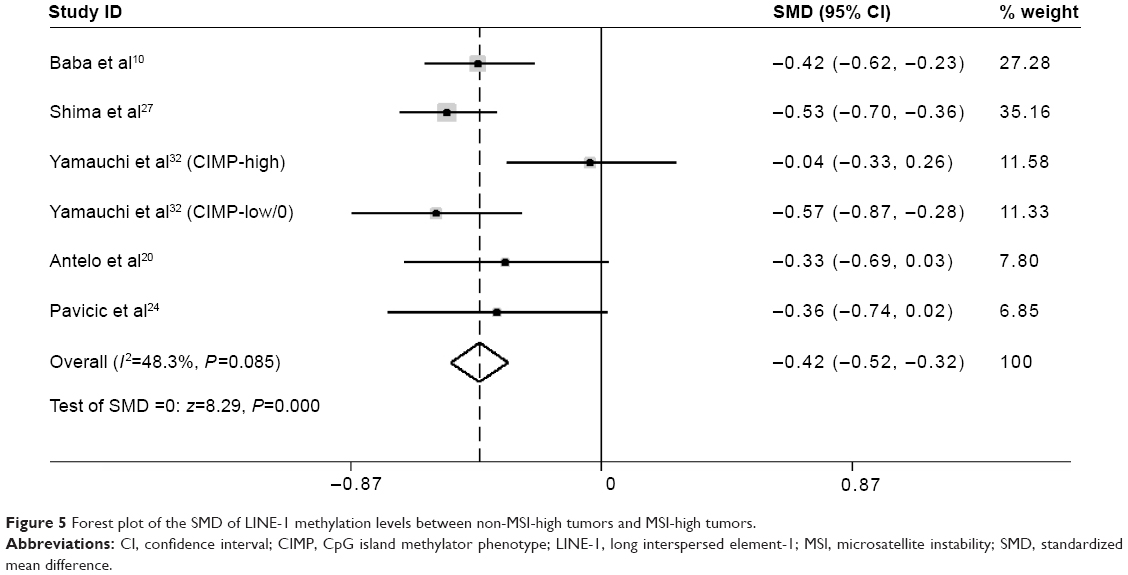 | Figure 5 Forest plot of the SMD of LINE-1 methylation levels between non-MSI-high tumors and MSI-high tumors. |
LINE-1 methylation levels with clinical and molecular features in CRC
No difference of LINE-1 methylation levels was found between males and females (SMD: −0.00; 95% CI: −0.10, 0.10; P=0.974). Heterogeneity between studies was low (I2=41.4%) (Figure 6A).
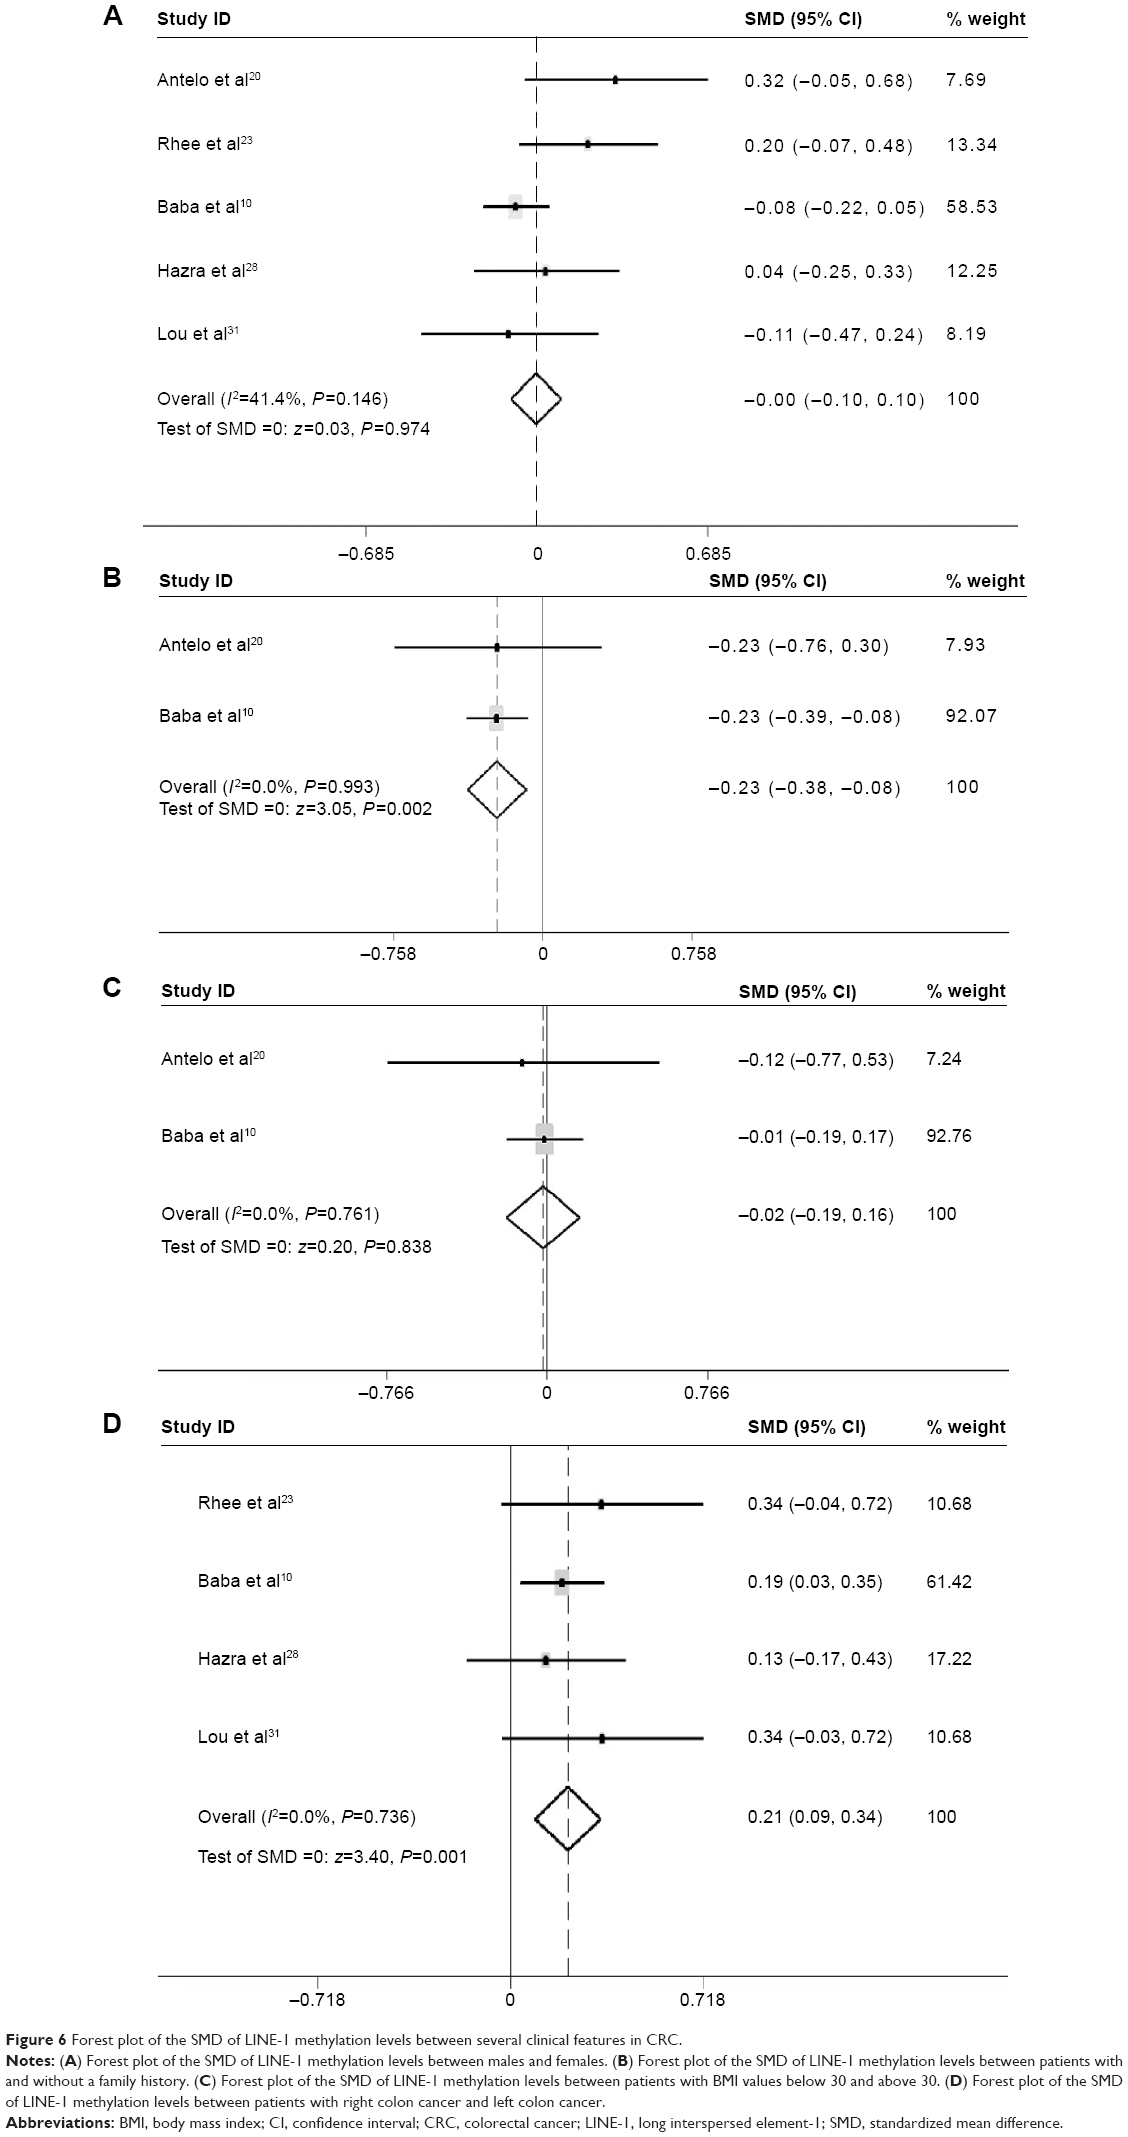 | Figure 6 Forest plot of the SMD of LINE-1 methylation levels between several clinical features in CRC. |
Patients with a family history of CRC had lower LINE-1 methylation level than those without family history (SMD: −0.23; 95% CI: −0.38, −0.08; P=0.002). There was no heterogeneity between studies (I2=0.0%) (Figure 6B).
There was no difference in LINE-1 methylation levels between patients with a body mass index (BMI) below 30 and those with a BMI above 30 (SMD: −0.02; 95% CI: −0.19, 0.16; P=0.8). There was no heterogeneity between studies (I2=0.0%) (Figure 6C).
The LINE-1 methylation levels in right colon cancer were significantly higher than left colon cancer (SMD: 0.21; 95% CI: 0.09, 0.34; P=0.001). There was no heterogeneity between studies (I2=0.0%) (Figure 6D).
No difference in LINE-1 methylation levels was found between KRAS-wild-type tumor and KRAS-mutant tumor (SMD: 0.02; 95% CI: −0.06, 0.11; P=0.597). There was no heterogeneity between studies (I2=0.0%) (Figure 7A).
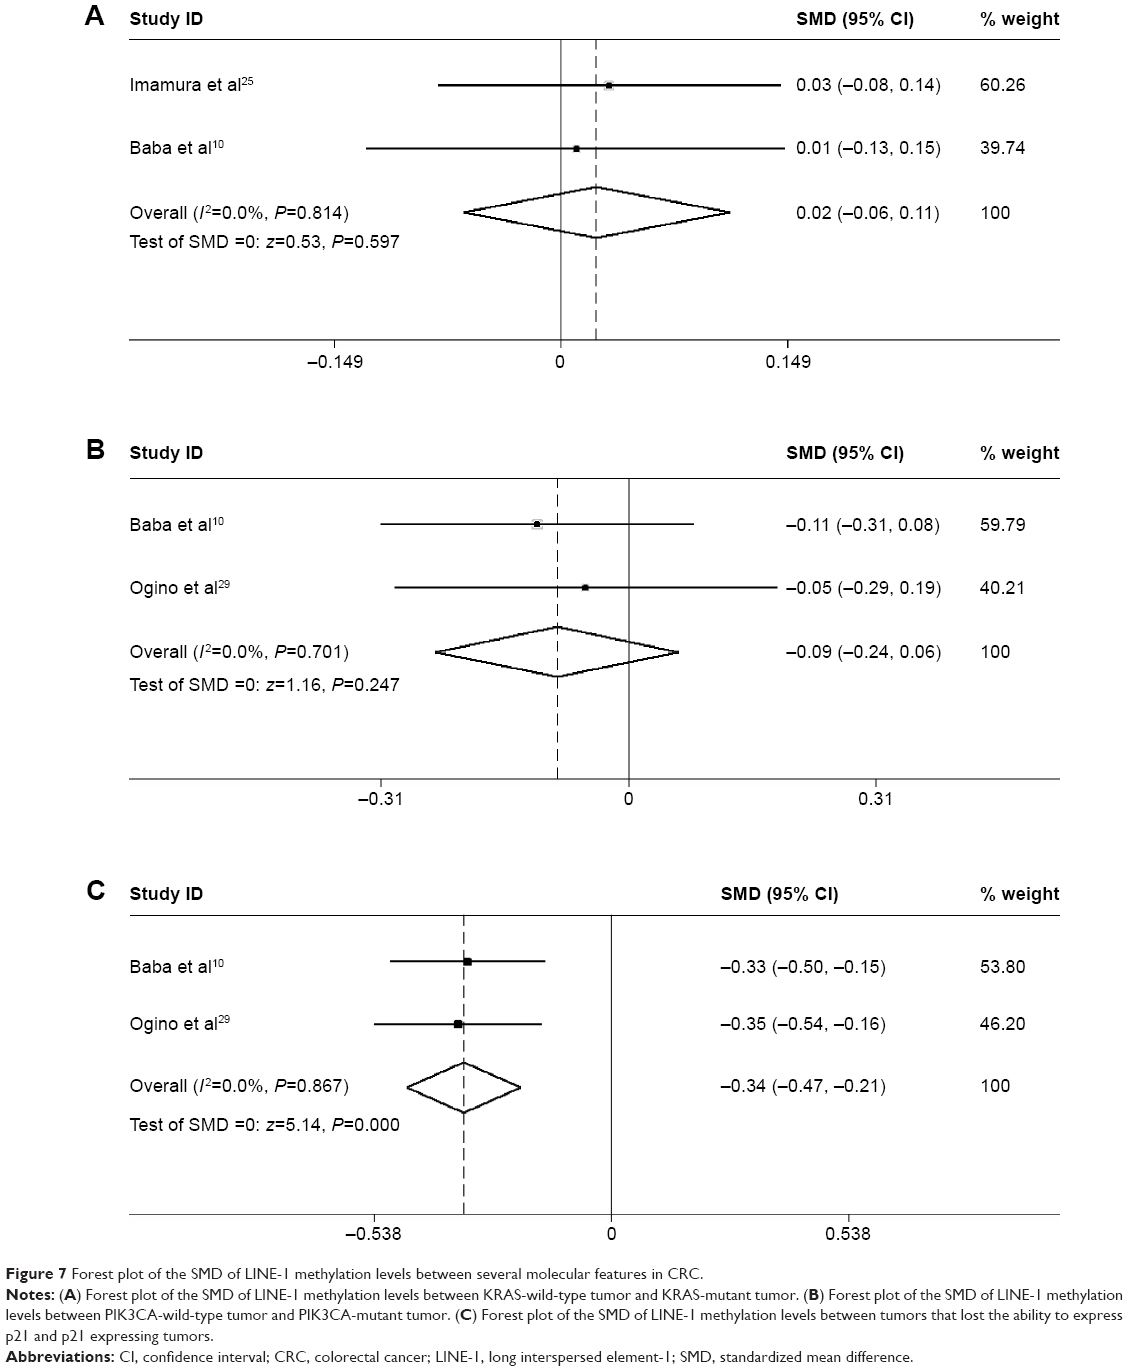 | Figure 7 Forest plot of the SMD of LINE-1 methylation levels between several molecular features in CRC. |
No difference in the LINE-1 methylation levels was found between PIK3CA-wild-type tumors and PIK3CA-mutant tumors (SMD: -0.09; 95% CI: −0.24, 0.06; P=0.247). There was no heterogeneity between studies (I2=0.0%) (Figure 7B).
The LINE-1 methylation levels in tumors that lost the ability to express p21 were significantly lower than p21 expressing tumors (SMD: −0.34; 95% CI: −0.47, −0.21; P=0.000). There was no heterogeneity between studies (I2=0.0%) (Figure 7C).
Discussion
Genome-wide DNA hypomethylation is an important epigenetic aberration in human cancer.33 As a repetitive DNA retrotransposon, LINE-1 constitutes a large proportion of the human genome. Thus, the level of LINE-1 methylation can approximately represent the level of global DNA methylation.34 CRC is an intricate disease resulting from genetic and epigenetic aberrations, including tumor suppressor genes high methylation and global DNA hypomethylation. The methylation level of LINE-1 repeats decline in colon cancer is recognized as a potential prognostic biomarker. However, some of the results remain controversial in several relevant studies.11,13 A previous meta-analysis was conducted to evaluate LINE-1 hypomethylation in blood and tissue samples in several types of cancers, but the authors have not fully discussed the association of LINE-1 hypomethylation with clinical and molecular features in CRC, especially those in dispute.14 Therefore, we performed the current meta-analysis to investigate more precisely the values of LINE-1 hypomethylation as a biomarker for cancer risk in CRC patients. This meta-analysis concerned 15 unique articles. Two articles included different cancer types, which were separated into substudies. Altogether, there were 21 unique studies with a total of 7396 CRC samples included. According to the results, LINE-1 methylation levels were significantly lower in cancer patients than in control samples (SMD: −2.26; 95% CI: −3.08, −1.45; z=5.44, P=0.000, Figure 1), which suggested that LINE-1 hypomethylation is a potential biomarker of the risk of CRC. The heterogeneity in the comparisons was significantly high, and this heterogeneity continued in the subgroup analyses conducted by ethnicity. In the subgroup analyses based on the methods used to measure global DNA methylation levels, the heterogeneity between studies in the pyrosequencing subgroups was significantly high (I2=96.6%), and was less, but still high, in the COBRA subgroups (I2=76.3%). Therefore, heterogeneity was a potential problem that may have affected the interpretation of the SMD results.
The MSI pathway is involved in CRC development.35 It is caused by the inactivity of the DNA mismatch repair system and associated with the increase of mutation rate in colorectal mucosa cells.36 MSI-high CRC presents specific clinical features. Iacopetta et al37 did not found a correlation of methylation levels in LINE-1 with MSI or CpG island methylator phenotype status in CRC. In contrast, Estecio et al12 suggested that MSI was the main molecular alteration associated with lack of LINE-1 hypomethylation. Thus, we performed a subgroup analysis to evaluate the relationship between LINE-1 methylation levels and the MSI status. The results showed that the mean LINE-1 methylation level was significantly lower in non-MSI-high tumors than in MSI-high tumors (SMD: −0.42; 95% CI: −0.52, −0.32; P=0.000), which indicated that LINE-1 hypomethylation is inversely related to MSI status. There was low heterogeneity between the studies (I2=48.3%) (Figure 5). Molecular classification of CRC based on MSI status reflects global epigenomic and genomic aberrations in cancer cells, which has great importance during colorectal carcinogenesis. Our results indicated that MSI-high is inversely associated with LINE-1 hypomethylation. Previous studies have proved that global hypomethylation promotes genomic instability which supporting the hypothesis that genome-wide hypomethylation might be involved in the pathway connected with MSI phenomena.38 Evidence showed that DNA hypomethylation preceded genomic instability in gastrointestinal cancers,39 therefore, LINE-1 hypomethylation is supposed to be a marker of distinction in molecular classification of CRC and might be crucial for cancer prevention and treatment.
Furthermore, subgroup analysis was performed to evaluate the relationship between LINE-1 methylation levels and clinical and molecular features in CRC. Interestingly, the analyses revealed strong associations between LINE-1 hypomethylation and individuals with a family history of CRC (SMD: −0.23; 95% CI: −0.38, −0.08; P=0.002). The patients with left colon cancer had lower LINE-1 methylation levels than those with right colon cancer (SMD: 0.21; 95% CI: 0.09, 0.34; P=0.001). There was no heterogeneity between the studies (I2=0.0%). No difference was found between patients with BMI values below 30 and above 30, or between males and females. These results provide useful information on the independent relations of LINE-1 hypomethylation with various clinical features (family history and tumor location). Researchers have also found patients with LINE-1 hypomethylation presented other specific clinical features, such as early onset, poor prognosis, and lymphocytic reactions.10 However, the number of studies is too small to ensure statistical power. Efforts should be made to investigate the relationship between LINE-1 hypomethylation and other clinical manifestations or pathological behavior characteristics. Then, we can further assess whether LINE-1 hypomethylation may produce a distinct subtype of CRCs. LINE-1 hypomethylation was found in tumors that had lost expression of p21 compared with p21 expressing tumors (SMD: −0.34; 95% CI: −0.47, −0.21; P=0.000). There was no heterogeneity between the studies (I2=0.0%). p21 plays a key role in regulating the cell cycle. In colon cancer, downregulation of p21 varied inversely with MSI-high status.40 The mechanism of this relation between LINE-1 hypomethylation and p21 remains to be investigated. No difference of LINE-1 methylation levels was found between KRAS-wild-type tumors and KRAS-mutant tumor, or between PIK3CA-wild-type tumors and PIK3CA-mutant tumors. The mutation of KRAS and PIK3CA genes has been identified in CRC. Nosho et al showed the loss of O6-methylguanine–DNA methyltransferase (MGMT), but not MGMT promoter methylation, may play a role in the development of PIK3CA mutation. Otherwise, PIK3CA mutation was significantly associated with KRAS mutation and phospho-ribosomal protein S6 expression, and inversely with p53 expression and β-catenin (CTNNB1) alteration.41 It is not clear whether global hypomethylation is related to KRAS or PIK3CA mutation.
However, several limitations of our meta-analysis need to be considered. The number of included studies was small, and the high heterogeneity in the analysis of LINE-1 methylation levels between cancer and normal controls groups was a potential problem in this meta-analysis. In order to resolve this problem, subgroups analysis was performed. The ethnicity and different methods used to measure global DNA methylation levels did not seem to cause the high heterogeneity. The slight asymmetry funnel plots indicated that the studies included might be influenced by publication bias, and publication bias may not be completely excluded. It might due to the limited numbers of publications recruited. Because of the limitation of the researchers’ language ability, the non-English literature could not be reviewed. Besides, some articles enrolled in the analysis might not be with high quality. Trim and fill method was used to correct the results. The adjusted estimate was consistent with the previous one. Furthermore, the result of sensitivity analysis showed that there was no single sensitive study in this meta-analysis, which indicated a statistically robust result.
Conclusion
LINE-1 hypomethylation is associated with various clinical and molecular features of CRC and might be connected with chromosomal instability. Thus, it has the prospect of becoming a biomarker for cancer risk in CRC patients. These results strengthen the importance of LINE-1 hypomethylation in CRC development and open a new venue to explore future cancer prevention strategies. Further investigations in this field would provide deeper insights into the pathogenesis of CRC and clinical implications of LINE-1 methylation.
Acknowledgment
This work was supported by a grant from the National Natural Science Foundation of China (81372232).
Disclosure
The authors report no conflicts of interest in this work.
References
Issa JP. CpG island methylator phenotype in cancer. Nat Rev Cancer. 2004;4:988–993. | ||
Ushijima T. Detection and interpretation of altered methylation patterns in cancer cells. Nat Rev Cancer. 2005;5:223–231. | ||
Esteller M. The necessity of a human epigenome project. Carcinogenesis. 2006;27:1121–1125. | ||
Schulz WA. L1 retrotransposons in human cancers. J Biomed Biotechnol. 2006;1:83672. | ||
Swergold GD. Identification, characterization, and cell specificity of a human LINE-1 promoter. Mol Cell Biol. 1990;10:6718–6729. | ||
Thayer RE, Singer MF, Fanning TG. Undermethylation of specific LINE-1 sequences in human cells producing a LINE-1-encoded protein. Gene. 1993;133:273–277. | ||
Hsiung D, Marsit C, Houseman E, et al. Global DNA methylation level in whole blood as a biomarker in head and neck squamous cell carcinoma. Cancer Epidemiol Biomarkers Prev. 2007;16:108–114. | ||
Zhu ZZ, Sparrow D, Hou L, et al. Repetitive element hypomethylation in blood leukocyte DNA and cancer incidence, prevalence and mortality in elderly individuals: the Normative Aging Study. Cancer Causes Control. 2011;22:437–447. | ||
Wilhelm C, Kelsey K, Butler R, et al. Implications of LINE1 methylation for bladder cancer risk in women. Clin Cancer Res. 2010;16:1682–1689. | ||
Baba Y, Huttenhower C, Nosho K, et al. Epigenomic diversity of colorectal cancer indicated by LINE-1 methylation in a database of 869 tumors. Mol Cancer. 2010;9:125. | ||
Ogino S, Kawasaki T, Nosho K, et al. LINE-1 hypomethylation is inversely associated with microsatellite instability and CpG island methylator phenotype in colorectal cancer. Int J Cancer. 2008;122:2767–2773. | ||
Estecio MR, Gharibyan V, Shen L, et al. LINE-1 hypomethylation in cancer is highly variable and inversely correlated with microsatellite instability. PLoS One. 2007;2:e399. | ||
Sunami E, de Maat M, Vu A, et al. LINE-1 hypomethylation during primary colon cancer progression. PLoS One. 2011;6:e18884. | ||
Barchitta M, Quattrocchi A, Maugeri A, et al. LINE-1 hypomethylation in blood and tissue samples as an epigenetic marker for cancer risk: a systematic review and meta-analysis. PLoS One. 2014;9:e109478. | ||
Higgins J, Thompson SG, Deeks JJ, et al. Measuring inconsistency in meta-analyses. BMJ. 2003;327:557–560. | ||
Higgins JP, Thompson SG. Quantifying heterogeneity in a meta-analysis. Stat Med. 2002;21:1539–1558. | ||
Begg CB, Mazumdar M. Operating characteristics of a rank correlation test for publication bias. Biometrics. 1994;50:1088–1101. | ||
Egger M, Davey Smith G, Schneider M, et al. Bias in meta-analysis detected by a simple, graphical test. BMJ. 1997;315:629–634. | ||
Duval S, Tweedie R. Trim and fill: a simple funnel-plot-based method of testing and adjusting for publication bias in meta-analysis. Biometrics. 2000;56:455–463. | ||
Antelo M, Balaguer F, Shia J, et al. A high degree of LINE-1 hypomethylation is a unique feature of early-onset colorectal cancer. PLoS One. 2012;7:e45357. | ||
Matsunoki A, Kawakami K, Kotake M, et al. LINE-1 methylation shows little intra-patient heterogeneity in primary and synchronous metastatic colorectal cancer. BMC Cancer. 2012;12:574. | ||
Hur K, Cejas P, Feliu J, et al. Hypomethylation of long interspersed nuclear element-1 (LINE-1) leads to activation of proto-oncogenes in human colorectal cancer metastasis. Gut. 2014;63:635–646. | ||
Rhee YY, Kim MJ, Bae JM, et al. Clinical outcomes of patients with microsatellite-unstable colorectal carcinomas depend on L1 methylation level. Ann Surg Oncol. 2012;19:3441–3448. | ||
Pavicic W, Joensuu EI, Nieminen T, et al. LINE-1 hypomethylation in familial and sporadic cancer. J Mol Med (Berl). 2012;90:827–835. | ||
Imamura Y, Lochhead P, Yamauchi M, et al. Analyses of clinicopathological, molecular, and prognostic associations of KRAS codon 61 and codon 146 mutations in colorectal cancer: cohort study and literature review. Mol Cancer. 2014;13:135. | ||
Morikawa T, Kuchiba A, Liao X, et al. Tumor TP53 expression status, body mass index and prognosis in colorectal cancer. Int J Cancer. 2012;131:1169–1178. | ||
Shima K, Morikawa T, Yamauchi M, et al. TGFBR2 and BAX mononucleotidetract mutations, microsatellite instability, and prognosis in 1,072 colorectal cancers. PLoS One. 2011;6:e25062. | ||
Hazra A, Fuchs CS, Kawasaki T, et al. Germline polymorphisms in the one-carbon metabolism pathway and DNA methylation in colorectal cancer. Cancer Causes Control. 2010;21:331–345. | ||
Ogino S, Nosho K, Shima K, et al. p21 expression in colon cancer and modifying effects of patient age and body mass index on prognosis. Epidemiol Biomarkers Prev. 2009;18:2513–2521. | ||
Ogino S, Nosho K, Kirkner GJ, et al. PIK3CA mutation is associated with poor prognosis among patients with curatively resected colon cancer. J Clin Oncol. 2009;27:1477–1484. | ||
Lou YT, Chen CW, Fan YC, et al. LINE-1 methylation status correlates significantly to post-therapeutic recurrence in stage III colon cancer patients receiving FOLFOX-4 adjuvant chemotherapy. PLoS One. 2015;28:e0123973. | ||
Yamauchi M, Morikawa T, Kuchiba A, et al. Assessment of colorectal cancer molecular features along bowel subsites challenges the conception of distinct dichotomy of proximal versus distal colorectum. Gut. 2012;61(6):847–854. | ||
Ehrlich M. DNA hypomethylation in cancer cells. Epigenomics. 2009;1:239–259. | ||
Cordaux R, Batzer MA. The impact of retrotransposons on human genome evolution. Nat Rev Genet. 2009;10:691–703. | ||
Markowitz SD, Bertagnolli MM. Molecular origins of cancer: molecular basis of colorectal cancer. N Engl J Med. 2009;361:2449–2460. | ||
Thomas DC, Umar A, Kunkel TA. Microsatellite instability and mismatch repair defects in cancer. Mutat Res. 1996;350:201–205. | ||
Iacopetta B, Grieu F, Phillips M, et al. Methylation levels of LINE-1 repeats and CpG island loci are inversely related in normal colonic mucosa. Cancer Sci. 2007;98:1454–1460. | ||
Eden A, Gaudet F, Waghmare A, Jaenisch R. Chromosomal instability and tumors promoted by DNA hypomethylation. Science. 2003;300:455. | ||
Suzuki K, Suzuki I, Leodolter A, et al. Global DNA demethylation in gastrointestinal cancer is age dependent and precedes genomic damage. Cancer Cell. 2006;9:199–207. | ||
Ogino S, Kawasaki T, Kirkner GJ, et al. Down-regulation of p21 (CDKN1A/CIP1) is inversely associated with microsatellite instability and CpG island methylator phenotype (CIMP) in colorectal cancer. J Pathol. 2006;210:147–154. | ||
Nosho K, Kawasaki, Ohnishi M, et al. PIK3CA mutation in colorectal cancer: relationship with genetic and epigenetic alterations. Neoplasia. 2008;10:534–541. |
 © 2015 The Author(s). This work is published and licensed by Dove Medical Press Limited. The
full terms of this license are available at https://www.dovepress.com/terms
and incorporate the Creative Commons Attribution
- Non Commercial (unported, 3.0) License.
By accessing the work you hereby accept the Terms. Non-commercial uses of the work are permitted
without any further permission from Dove Medical Press Limited, provided the work is properly
attributed. For permission for commercial use of this work, please see paragraphs 4.2 and 5 of our Terms.
© 2015 The Author(s). This work is published and licensed by Dove Medical Press Limited. The
full terms of this license are available at https://www.dovepress.com/terms
and incorporate the Creative Commons Attribution
- Non Commercial (unported, 3.0) License.
By accessing the work you hereby accept the Terms. Non-commercial uses of the work are permitted
without any further permission from Dove Medical Press Limited, provided the work is properly
attributed. For permission for commercial use of this work, please see paragraphs 4.2 and 5 of our Terms.