Back to Journals » Risk Management and Healthcare Policy » Volume 15
Assessing the Added Value of Vital Signs Extracted from Electronic Health Records in Healthcare Risk Adjustment Models
Authors Kitchen C, Chang HY ![]() , Weiner JP, Kharrazi H
, Weiner JP, Kharrazi H
Received 13 January 2022
Accepted for publication 26 March 2022
Published 5 September 2022 Volume 2022:15 Pages 1671—1682
DOI https://doi.org/10.2147/RMHP.S356080
Checked for plagiarism Yes
Review by Single anonymous peer review
Peer reviewer comments 2
Editor who approved publication: Dr Jongwha Chang
Christopher Kitchen,1 Hsien-Yen Chang,1 Jonathan P Weiner,1 Hadi Kharrazi1,2
1Center for Population Health IT, Department of Health Policy and Management, Johns Hopkins Bloomberg School of Public Health, Baltimore, MD, USA; 2Division of Health Sciences Informatics, Johns Hopkins School of Medicine, Baltimore, MD, USA
Correspondence: Christopher Kitchen, Center for Population Health IT, Department of Health Policy and Management, Johns Hopkins University, Bloomberg School of Public Health, 624 N Broadway, Room 500, Baltimore, MD, 21205, USA, Tel +1 410 614-7409, Email [email protected]
Purpose: Patient vital signs are related to specific health risks and outcomes but are underutilized in the prediction of health-care utilization and cost. To measure the added value of electronic health record (EHR) extracted Body Mass Index (BMI) and blood pressure (BP) values in improving healthcare risk and utilization predictions.
Patients and Methods: A sample of 12,820 adult outpatients from the Johns Hopkins Health System (JHHS) were identified between 2016 and 2017, having high data quality and recorded values for BMI and BP. We evaluated the added value of BMI and BP in predicting health-care utilization and cost through a retrospective cohort design. BMI, mean arterial pressure (MAP), systolic and diastolic BPs were summarized as annual aggregated values. Concurrent annual BMI and MAP changes were quantified as the difference between maximum and minimum recorded values. Model performance estimates consisted of repeated 10-fold cross validation, compared to base model point estimates for demographic and diagnostic, coded events: (1) patient age and sex, (2) age, sex, and the Charlson weighted index, (3) age, sex and the Johns Hopkins ACG system’s DxPM risk score.
Results: Both categorical BMI and BP were progressively indicative of disease comorbidity, but not uniformly related to health-care utilization or cost. Annual change in BMI and MAP improved predictions for most concurrent year outcomes when compared to base models.
Conclusion: When a healthcare system lacks relevant diagnostic or risk assessment information for a patient, vital signs may be useful for a simple estimation of disease risk, cost and utilization.
Keywords: health care costs, health care organizations and systems, information technology in health, technology assessment
Introduction
Now that electronic health records (EHRs) are widespread in use, they have become integral to health risk assessment and modeling.1–4 Given their focus on individual level patient care, to date, health-care organizations have not always made use of information stored in their EHRs for population-level analytics. They often overlook important, clinically relevant features applicable to predictive modeling of health risk.1 Additionally, data quality concerns such as data missingness or lack of a formal structure (eg, free text) can limit EHR data availability and appropriateness for such applications.
Patient demographics, diagnostic history, medical procedures, and utilization metrics have been commonly used for decades to predict health-care utilization.3,5 These features are often available in both EHR and medical claims data. However, to date, it has been less common that derived clinical variables, unique to EHR, such as laboratory findings and measures of patient vital signs have been incorporated into the population-level predictions of risk.6,7 Given the technological advancement in capturing more frequent and highly accurate serology and vital recordings that can automatically be transmitted and stored within EHRs, such variables can play an important role in the timely prediction of health-care utilization within health delivery systems.8,9
To gain further understanding of the uses of EHR derived risk factors, previously, we have assessed the value of patient-level BMI and laboratory findings in the prediction of health risk and utilization.3,6 We have found that when other risk factor information (eg, diagnoses) is available, these new measures add only modest improvement to prediction. Though, given the many uses of these EHR data in predictive modeling and beyond, it remains necessary to consider a range of measurement and modeling issues associated with these measures. For example, a categorical representation of BMI, may have less added value than a continuous BMI, or a measure accounting for BMI change over time.10 This nuance is supported by research in BMI comorbidity and mortality risk, where BMI is known to have a non-linear association.11
Poor health outcomes are also associated with elevated or highly variable blood pressure readings.12–15 From a prediction standpoint, the American Heart Association (AHA) guidelines for classifying hypertension risk can therefore be seen as overly simple, for example. They do not consider patients at risk of hypertension that have highly variable pressure readings. Conversely, duration of obesity has similarly been linked to increased hospital resource use.16 This suggests that it is not just that a patient is obese, but the length of time a person remains obese that puts them at risk. Moreover, there is at least some evidence that BMI volatility could reflect acute disease processes. These observations could subsequently lead to emergency care visits, hospitalization and greater health costs. Thus, static classifications of hypertension and obesity may be inadequate for certain kinds of risk prediction modeling.3,6
In the study reported here, our aims were two-fold: (1) assess the added value of categorical BMI and BP readings in predicting health-care costs and utilization, and (2) assess and compare the added value with alternative formulations of BMI and BP reflecting change over time. As part of our descriptive findings, we also illustrate the staggered risk of comorbidity and health outcomes for levels of categorical BMI and BP to further document co-linearity and support the argument for predictive value.
Materials and Methods
Data Sources
Insurance claims data were provided by Johns Hopkins HealthCare, LLC (JHHC). JHHC is a Mid-Atlantic region health-care insurer that offers multiple plans for different patient populations and services.17 We included beneficiaries from the Johns Hopkins Employer Health Programs (EHP) and Priority Partners, Managed Care Organization (PP). Electronic health records (EHRs) were made available by the Johns Hopkins Medical Institute (JHMI) and represent information from multiple emergency and outpatient care facilities throughout the Baltimore-Washington MSA.18
This research was approved by the Institutional Review Board at Johns Hopkins School of Public Health (JHSPH). Data were aggregated as a patient-level summary for 2016 and 2017 using the Johns Hopkins ACG System software (ver. 12.0, 2019).19 The requirement for informed consent was waived by the JHSPH IRB, as these data were limited in scope, deidentified and approved for research where it is not possible to contact individuals. Relevant data included demographics, diagnoses, medical and pharmacy costs and medical services provided each year. Charlson weighted index scores were attached by separately exporting a claims-based diagnostic summary for each patient and using the comorbidity package of the R programming language.20 Analyses were performed using the R programming language (ver. 3.6.3).
Cohort Selection
Of the 71,152 patients found in 2016 EHR, 44,879 (63.1%) were between the ages of 20 and 64 and 39,186 (55.1%) were continuously enrolled for the entire 2016–2017 interval. Requiring continuous enrollment ensured the absence of an encounter was most likely an indication of it not occurring, rather than an omission due to incompleteness of the claims data. Together, these two criteria account for the vast majority of patient exclusions but focus our observations to adult patients with adequate data quality. Additional selection criteria included 1) at least one outpatient visit between 2016 and 2017, 2) no ICD-10-CM code for pregnancy, 3) no ICD-10-CM code for cancers, 4) no congestive heart failure diagnosis, and 5) no code associated with amputation or bariatric surgery. These exclusions helped ensure that changes in outpatient BMI were not the result of a severe disease, surgery or child delivery. Together, these criteria excluded 53,357 (75.0%) patients. Finally, the cohort required at least one BMI and set of BP values recorded in 2016, leaving 12,820 patients to be included (Figure 1).
 |
Figure 1 Consort flow diagram of the record and patient cohort selection process. |
Measurement
Values for patient height, weight, BMI, mean arterial pressure (MAP), systolic and diastolic blood pressures were extracted from a dedicated EHR flowsheet table and required extensive cleaning (see Appendix A). Values for BMI were calculated from flowsheet weight and height on encounter dates where recorded BMI was not available. Similarly, MAP was used in some of the calculations for this analysis and was available for only a portion of the encounter dates found among flowsheet values. MAP was calculated for encounters where both systolic and diastolic values were recorded, but no recorded MAP was found. Separate measures for weight, height and pressure were converted to a common scale: kilograms for weight, meters for height and mmHg for pressure.
BMI risk was defined using modified US Centers for Disease Control (CDC) standard categories such that six levels were reduced to five, grouping underweight and normal BMI ranges (<18.5 kg/m2 and 18.5 ≤ BMI < 25 kg/m2, respectively) into one category for non-overweight individuals.21 The remaining cutoffs were 25 ≤ BMI < 30 kg/m2 for overweight individuals, 30 ≤ BMI < 35 kg/m2 for Class I obesity, 35 ≤ BMI < 40 kg/m2 for Class II obesity, and BMI ≥ 40 kg/m2 for Class III obesity. Mean annual BMI was used for determining BMI risk classification. Change in BMI (hereafter BMI range) was defined as a measure of annual variability in BMI, calculated as the difference in annual maximum and minimum BMI. This range in observed BMI requires at least two recorded values for the year or else this value was not calculated. Thus, three annually aggregated measures of BMI were necessary to determine BMI change: mean, maximum, and minimum.
The classification scheme for evaluating hypertension published by the US Department of Health and Human Services (DHHS) was used to classify risk related to systolic and diastolic blood pressure.22 These categories include 1) hypotensive or normal pressure (systolic: <120 mmHg and diastolic: <80 mmHg), 2) prehypertension (systolic: 120–139 mmHg or diastolic: 80–89 mmHg), 3) stage 1 hypertension (systolic: 140–159 mmHg or diastolic: 90–99 mmHg), and 4) stage 2 hypertension (systolic: ≥160 mmHg or diastolic: ≥100 mmHg). Mean arterial pressure (MAP) was used to determine annual range. Thus, annual measures of blood pressure include average systolic and diastolic pressure (used to determine risk category), minimum MAP and maximum MAP.
Covariates, Predictors and Outcomes
Risk categories were compared to several demographic and comorbidity markers in addition to measures of cost and utilization. Age, gender, number of chronic conditions, active ingredients, and proportion of patients with select comorbidities were identified as covariates of BMI and BP category to illustrate clinical risk. Diagnoses selected for this contrast include diabetes, hypertension, ischemic heart disease and obesity to ensure internal validity of our risk classification.
Charlson weighted index and the ACG’s DxPM measure for diagnostic comorbidity were used with age and gender to form three base models for the evaluation of added value. These base models included predictors: 1) age and sex, 2) age, sex and Charlson weighted index, and 3) age, sex and DxPM. Predicted outcomes included 1) annual patient total cost, 2) pharmacy costs, 3) medical costs, 4) any cause emergency department visit, 5) any cause inpatient hospitalization, and 6) whether the patient’s total health cost was among the top 5% of all patients in 2016. Use of billing information was not authorized as part of this research. All pharmacy and medical costs were assigned through proxies from Centers for Medicare and Medicaid Services (CMS) same-year totals (see Appendix A). Emergency room and inpatient hospitalization services were defined in the ACG system and we used top 5% of patients in total annual cost as a binary indicator for patients with extremely high health utilization or specialty care. Model performance for each outcome was evaluated as concurrent or prospective year predictions. Our demographic, comorbidity and health-care utilization markers were tabulated against BMI and BP classifications, and for discrete features, we conducted several chi-square tests of independence to assess the degree of association for each feature. As a secondary evaluation, we tabulated these associations with increasing levels of our chosen comorbidity indices.
For each model of cost or utilization, three contrasting sets of inputs were considered. These were 1) the base model alone, 2) the base model plus BMI/BP risk category, and 3) the base model plus BMI/BP risk category and BMI/MAP annual range. The three sets of vital signs were also evaluated separately for 1) annual BMI, 2) annual BP/MAP and 3) annual BMI+BP/MAP. As a result, 30 models were fit for every outcome. Models were validated using 10-fold cross validation with an analysis of 100 replications. Cross-validated average R2 and AUC were used as point estimates of performance and reported with corresponding 95%-percentile confidence interval. Costs were estimated using linear regression and evaluated by R2. The distributions for cost are known to have a positive skew but were not transformed as part of this analysis. Prior research suggests there is a trade-off between model interpretability and little-to-no improvement in predictive performance by transforming health costs with OLS regression or using more elaborate modeling techniques not constrained by OLS assumptions.23–27 Utilization measures made use of binary logistic regression and AUC for model performance. Added value was considered statistically significant if the point estimate of a base model fell outside the 95% confidence interval of test model performances.
Results
Covariates
The final sample was predominantly female (69.1%) and younger in age (34.3% aged 20–34 years). Very few beneficiaries had a change in risk category during 2016. Of beneficiaries with more than one BMI on record (N = 8552), 81.7% had “No Change” in BMI category. Among those who did have a change in BMI category, a roughly equal proportion decreased BMI as increased (9.1% and 9.3%, respectively). The average change in BMI for 2016 was 1.197 kg/m2 (SD = 1.981) and the median was 0.7. Among beneficiaries who had more than one BMI on record, this translates to a mean annual BMI variability around 5%. For MAP, the average change in 2017 was 13.319 mmHg (SD = 12.225) and the median was 11.3. Among beneficiaries who had more than one set of BP values recorded in 2016, this translates to a mean annual MAP variability of around 17%.
Table 1 shows the descriptive statistics for both BMI and blood pressure categories of risk. Roughly, an equal number of beneficiaries were categorized having an underweight or normal BMI (BMI < 25) as there were overweight individuals (BMI = 25–29), with overweight individuals making up the largest portion of the sample (26.7%). Another 20.8% of the sample were identified as Class-I obese individuals, and 26.3% were either Class-II or Class-III individuals (BMI > 29). The number of chronic conditions increased with successive levels of BMI category (mean of 2.07 to 3.89), as did number of prescribed ingredients (mean of 4.84 to 7.53). The proportion of beneficiaries with type 2 diabetes increased more than six-fold from 4.1% of Under/Normal BMI beneficiaries to 26.6% of Class-III obese beneficiaries (Χ2=652.6, p < 0.001). The proportion of beneficiaries with hypertension more than doubled, from 19.9% to 55.4% (Χ2=916.8, p < 0.001). Interestingly, the proportion of beneficiaries who had a claims-based diagnostic code associated with obesity increased over successive BMI categories (X2 = 3764.9, p < 0.001) but only identified 2642 beneficiaries as obese, 28.0% of beneficiaries identified as obese through classifying flowsheet records.
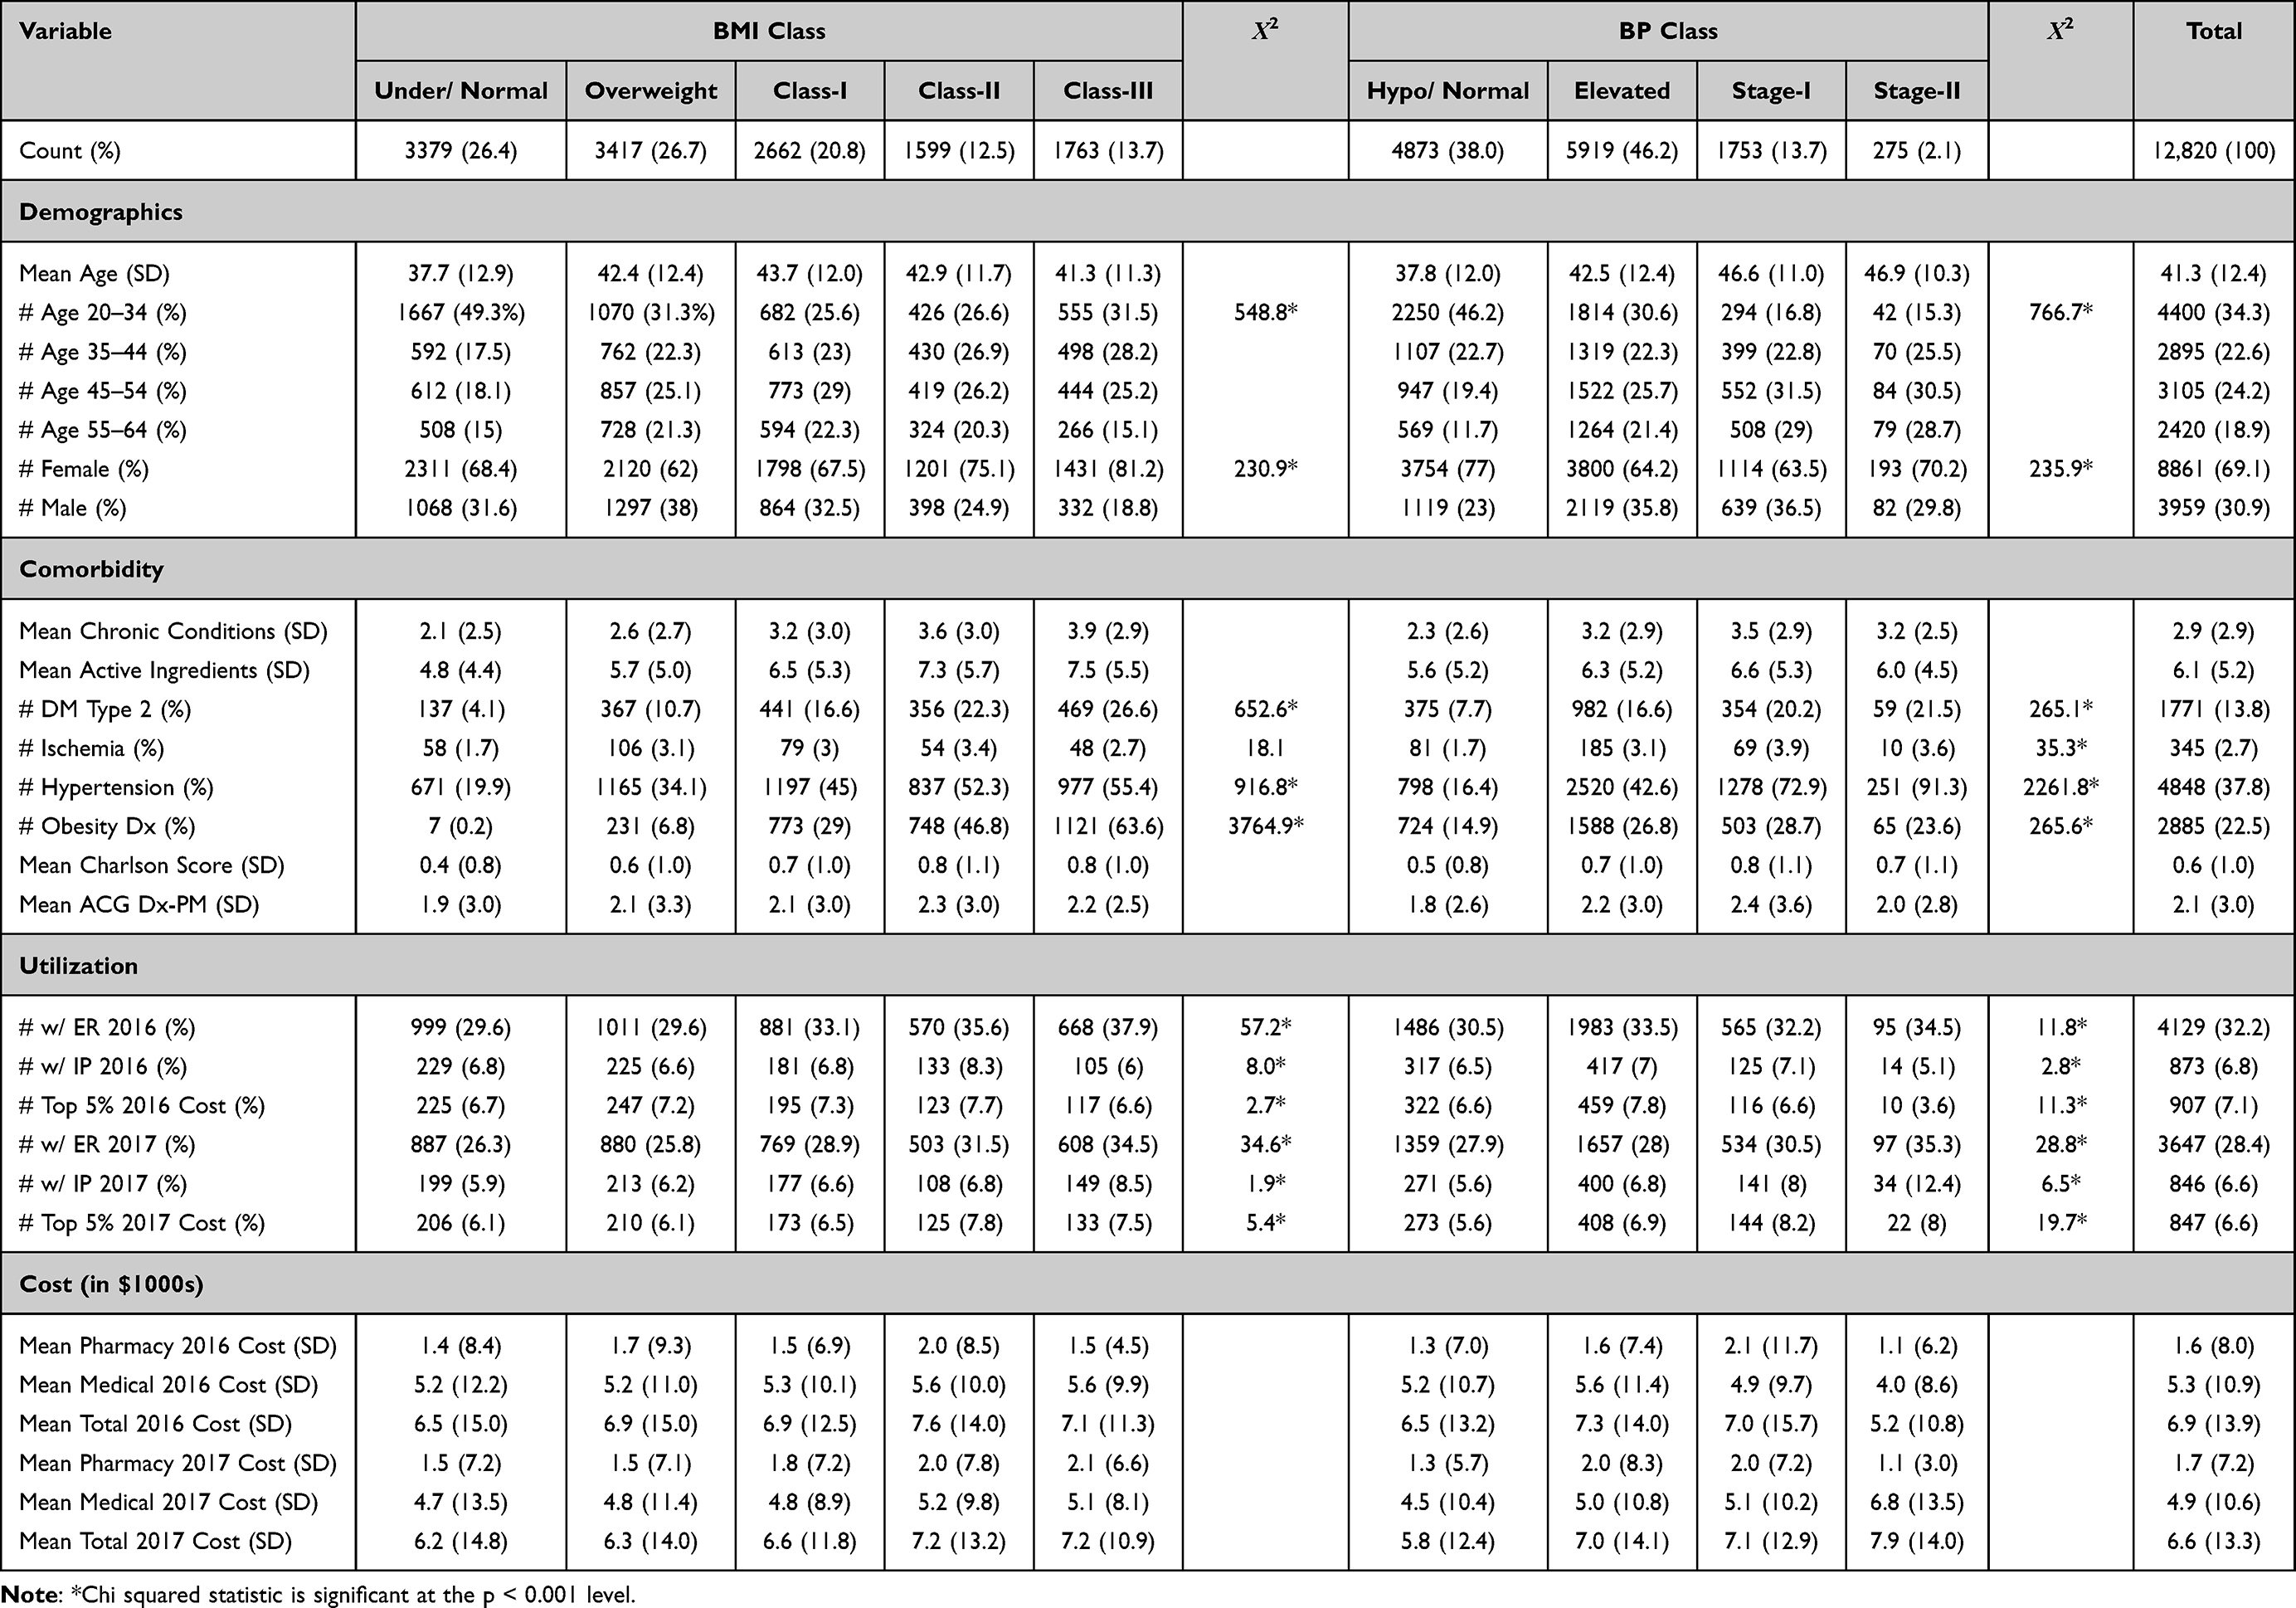 |
Table 1 Descriptive Statistics for Demographic, Diagnostic, Utilization, and Cost Measures Associated with Each Level of Body Mass Index (BMI) and Blood Pressure (BP) Categories |
The distribution of patients across hypertension risk categories was more asymmetrical, with mean annual pressures for 38.0% of patients being normal or hypotensive, 46.8% being elevated and only 15.8% suggesting either Stage 1 or Stage 2 hypertension. Chronic conditions also appear to increase with progressively worse risk for hypertension, from 2.28 to 3.19 average conditions. This was also true of active ingredients (mean = 5.63 to 5.99). The proportion of patients in each category with type 2 diabetes also increased three-fold from lowest to highest stage of BP (Χ2=265.1, p < 0.001). A diagnosis of hypertension was very consistent with classified annual mean blood pressures (Χ2=2261.8, p < 0.001). Only 16.4% of those classified as having hypotension or normal pressure had a concurrent diagnosis of hypertension, while 72.9% of those classified as Stage 1 and 91.3% of those classified as Stage 2 had the diagnosis. This contrasts with the comparatively lower BMI classification overlap with obesity diagnoses.
Cost and utilization measures were more equivocal in direction and strength across BMI and hypertension risk category. Comparatively lower values for X2 were found for the proportion of patients with concurrent year emergency department visits increasing with BMI and hypertension risk category (BMI: Χ2=57.2; BP: Χ2=11.8). Though still reaching levels of significance, it was less clear that BMI or hypertension category was related to concurrent inpatient stays or the proportion of beneficiaries falling into the top 5% of total cost. Total cost did not appear to uniformly increase with successive BMI or hypertension class. We explored several associations between these covariates and selected indices of comorbidity, and found they were much stronger (Table S1). For example, both the Charlson index and higher scores on the ACG DxPM were associated with concurrent emergency department visits (X2 = 639.7, X2 = 1256.7, respectively), inpatient hospitalization (X2 = 1411.6, X2 = 3085.0), and a patient being in the top 5% of total cost (X2 = 1410.6, X2 = 5427.2). Categorical BMI and BP were much more associated with the conditions of obesity and hypertension (respectively) than were either comorbidity index however.
Added Value
Accuracy of the predictive models of cost, measured by R2, was significantly improved for concurrent and prospective medical costs compared to base models consisting of only age and gender by the additions of annual range of BMI or MAP (Concurrent Ranges, BMI: R2 +0.053, MAP: +0.122, Both: +0.140) but not with adding BMI or BP classifications (Concurrent Categorical, BMI: R2 −0.000, BP: +0.001, Both: +0.000) (Tables 2 and S2). This was also observed for concurrent and prospective total cost (Concurrent Ranges, BMI: R2 +0.041, MAP: +0.100, Both: +0.111) but not pharmacy costs (Concurrent Ranges, BMI: R2 −0.000, MAP: +0.000, Both: +0.000). BMI and MAP ranges did not significantly improve performance of base models that incorporated comorbidity measures (eg, Charlson Weighted Index and ACG DxPM). However, the BMI and MAP range measures, when added to the base model for medical costs with the Charlson index, resulted in significantly improved R2 if the confidence interval is defined by normal approximation rather than a 95% percentile on both concurrent and prospective models (Concurrent Ranges, BMI: R2 +0.012, MAP: +0.055, Both: +0.067). The inclusion of both BMI and MAP in medical and total cost models generally had an additive effect for R2 improvement, though no significant improvement was seen for pharmacy cost (Table 2).
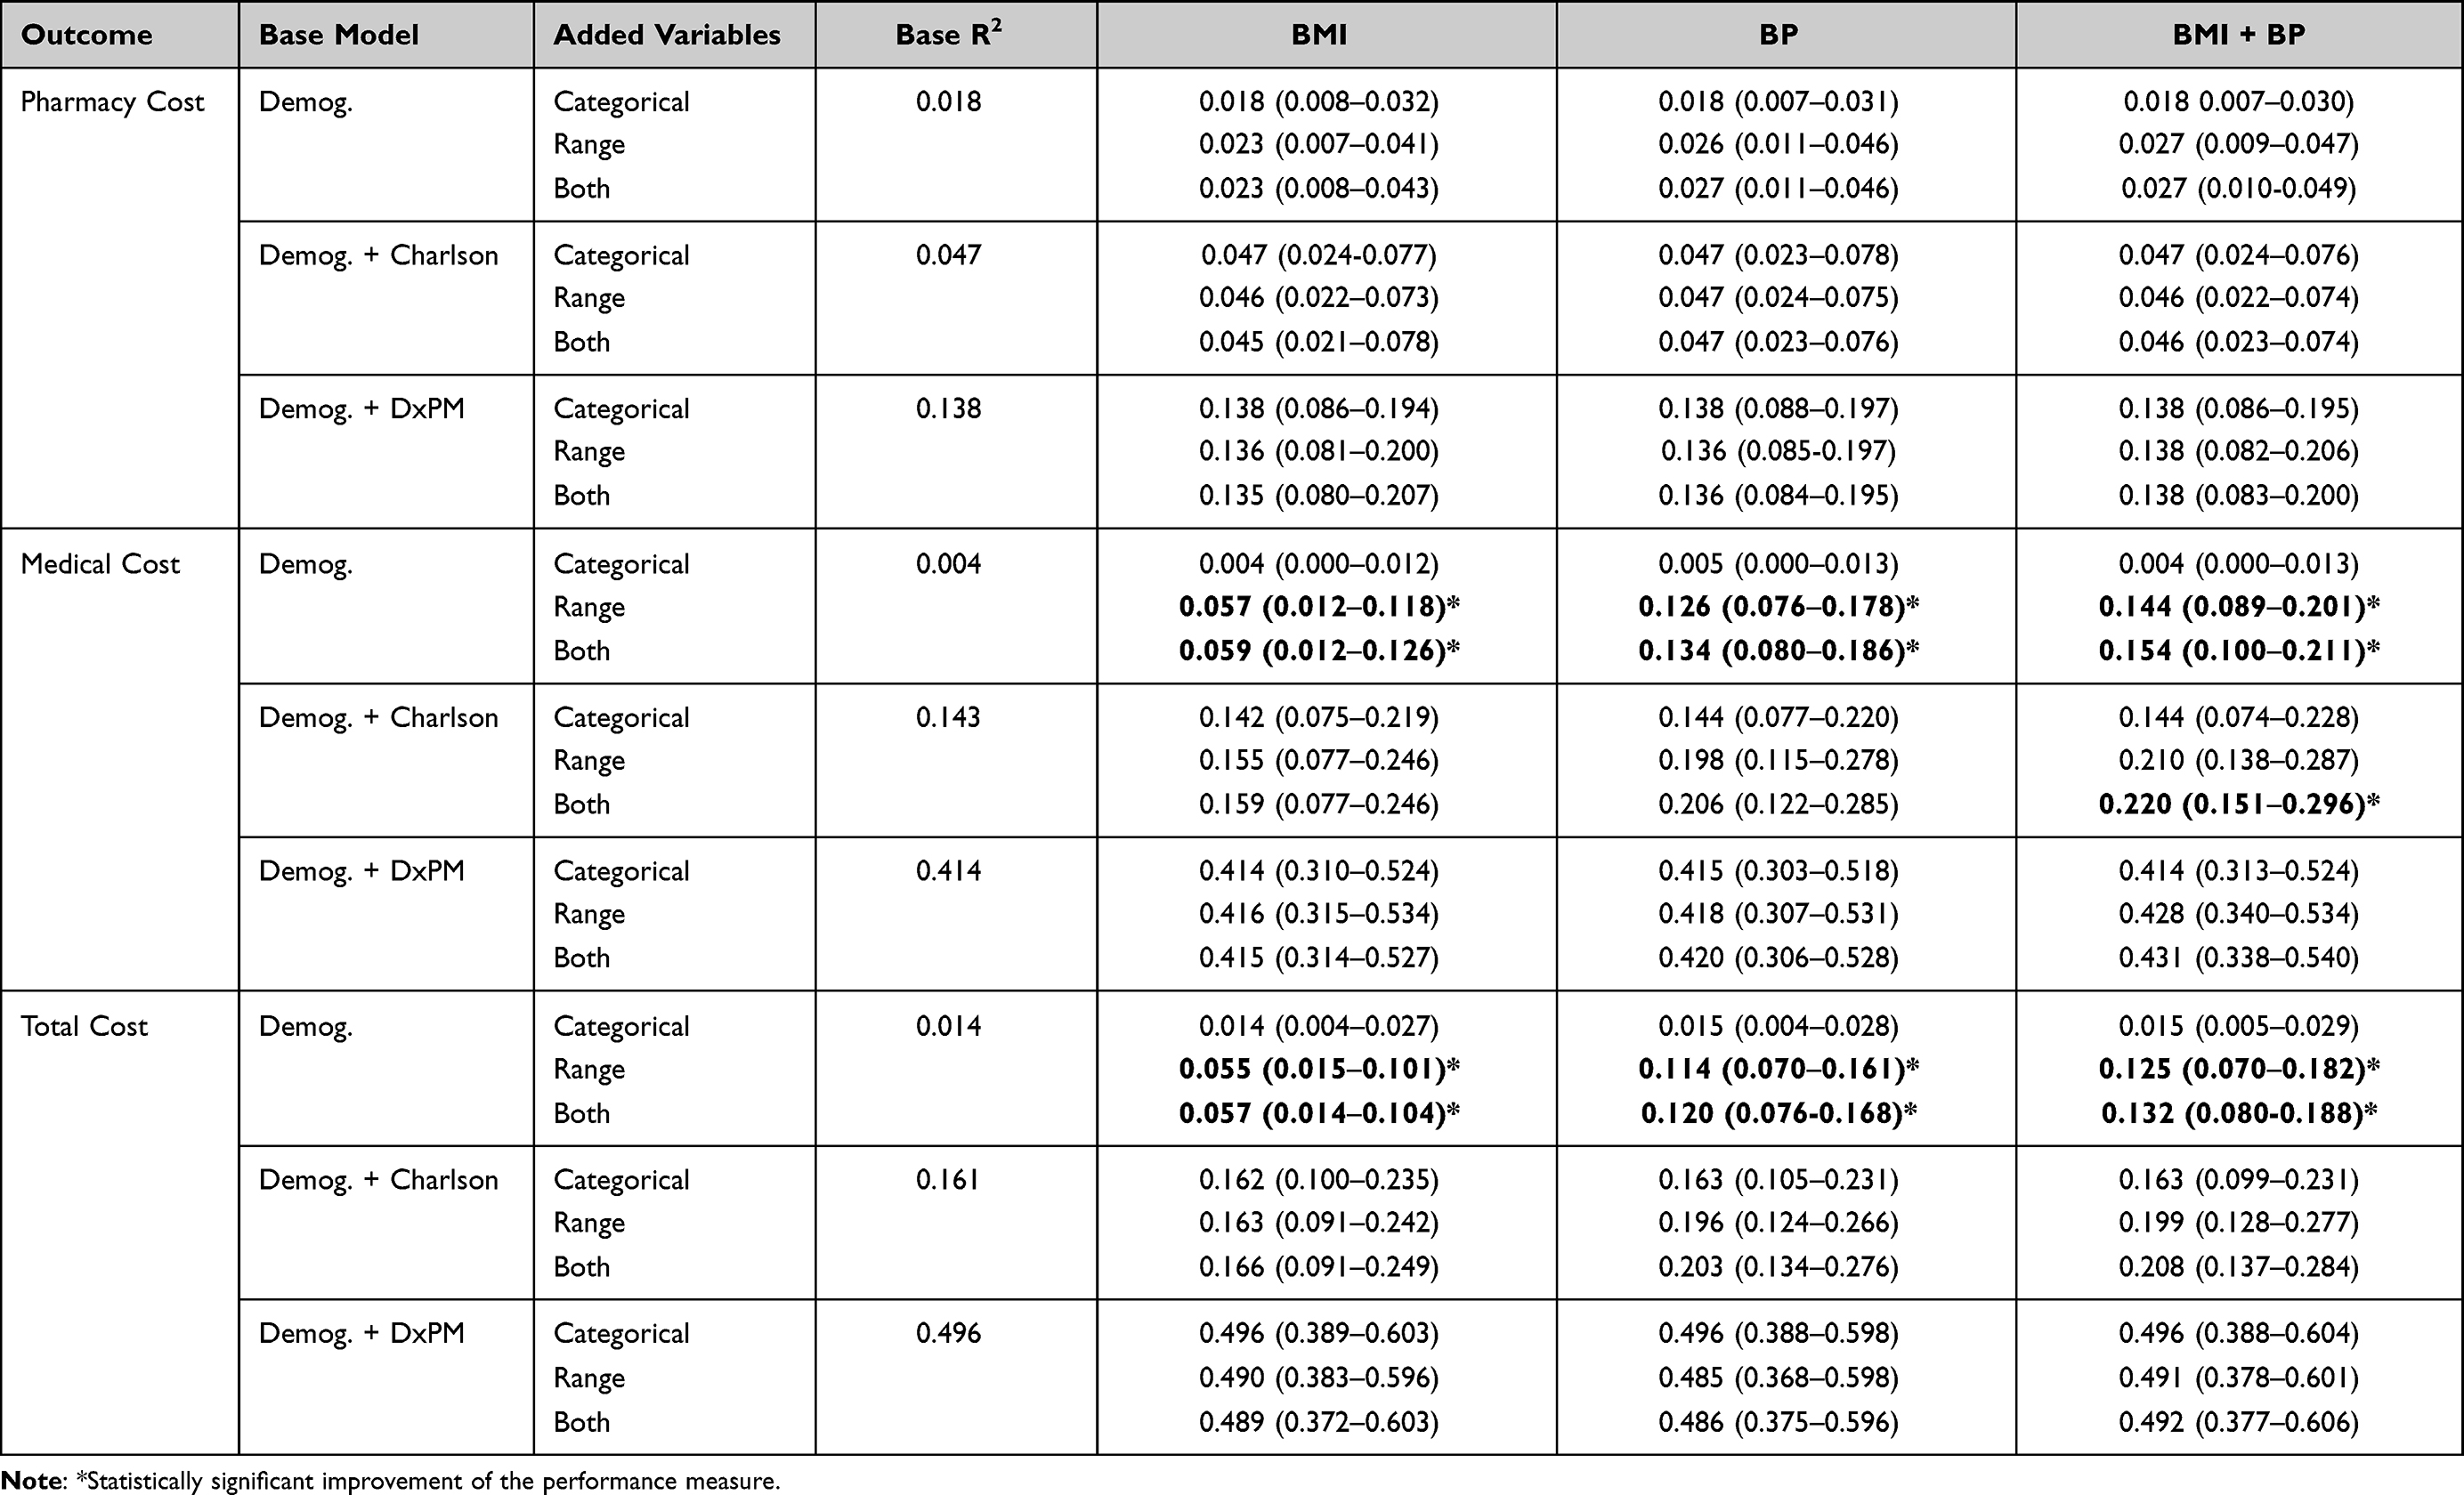 |
Table 2 Performance Summary for Concurrent Year Cost Estimates, Using BMI and BP Classifications and Annual Range Metrics with Base Models for 1) Demographics, 2) Demographics + Charlson Weighted Index and 3) Demographics + DxPM |
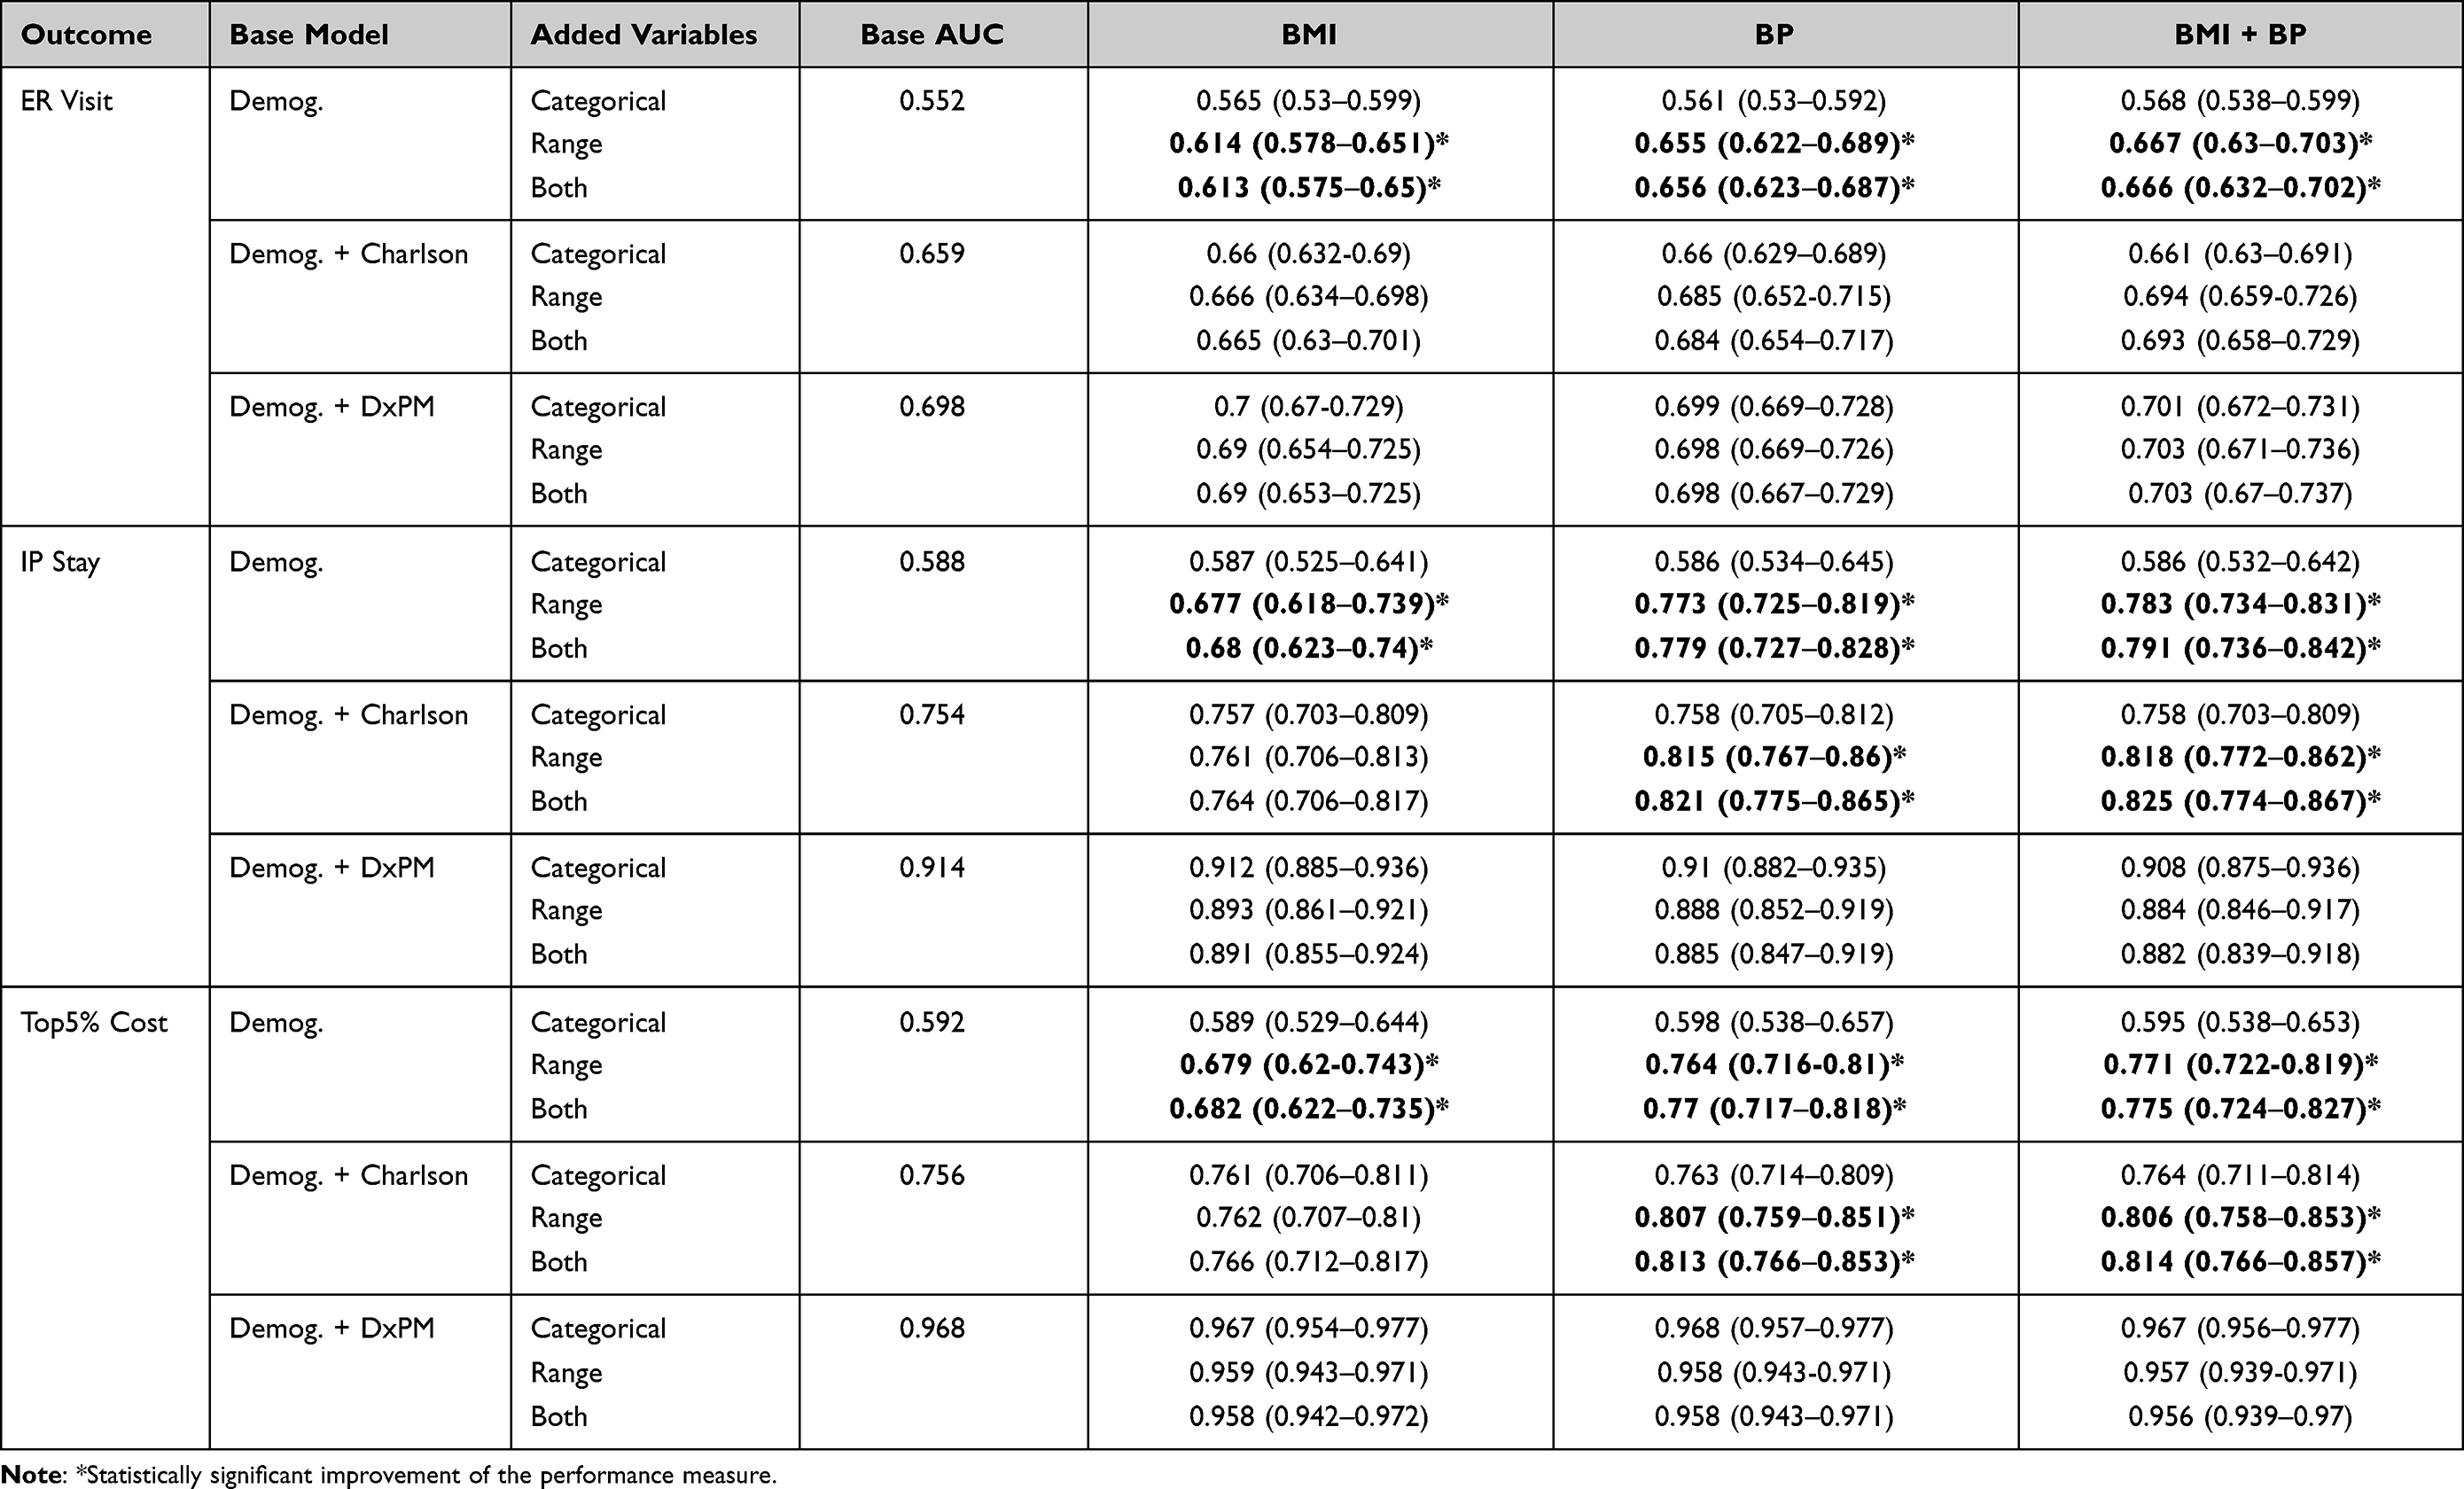 |
Table 3 Performance Summary for Concurrent Year Utilization Estimates, Using BMI and BP Classifications and Annual Range Metrics with Base Models for 1) Demographics, 2) Demographics + Charlson Weighted Index and 3) Demographics + DxPM |
A similar trend was identified in improving the AUC of models predicting health utilization. Annual range metrics for BMI and MAP proved more informative than categorical BMI and BP (Table 3). BMI category did not significantly improve concurrent predictions of ER visits (AUC +0.013), IP stays (−.001) or top 5% of cost (−.003) even with the simplest base model (ie, demographics only). BP categories also yielded small effects compared to the demographic base of concurrent ER visits (AUC +0.009), IP stays (−.002) and top 5% of cost (+.006). By contrast, BMI range significantly improved predictions for concurrent ER visits over demographics alone (Demographics: AUC +0.062), as did MAP range (Demographics: +0.103). Prediction of IP stays were improved over demographics for range BMI (Demographics: AUC +0.089) and demographics plus the Charlson index for MAP (Demographics: AUC +0.185; Demographics & Charlson: +0.061). BMI range also improved prediction over demographics for the marker signifying a patient was in the top 5% of total cost (Demographics: AUC +0.087), but MAP range again improved prediction more and significantly over demographics plus the Charlson index (Demographics: +0.172; Demographics + Charlson: +0.051). Neither BMI nor MAP range significantly improved model performance over the DxPM base model (Table 3).
Discussion
Health-care organizations are increasingly leveraging EHR data for population health management and risk stratification. This work has expanded prior research in assessing the value of EHR-based vital signs applied to health-care predictive models in three ways: (1) using cross-validation methodology to strengthen the external validity of findings, (2) combining BMI and blood pressures in risk modeling, and (3) evaluating a measure of change against classifications commonly used in clinical practice. Our findings show that annual BMI or MAP range holds greater added value for predicting the outcomes of interest than categorical risks of obesity and hypertension. This value is reduced by inclusion of comorbidity indices for each model. The associations between either comorbidity index and health-care utilization or cost were found to be much stronger than either BMI or BP classification (Tables 1 and S1).
Prior studies have made similar observations in the added value of EHR specific data types in improving the prediction of utilization.3 For example, studies have found that EHR-derived BMI category,7 laboratory values,6 prescription information,28–31 frailty markers,32,33 and some social determinants of health34–37 are only helpful when other indices for health risk and comorbidity are omitted. Research in modeling patient mortality has documented added value for vital signs and laboratory findings over markers for common comorbidities, but in hospitalized patients. The average gain in cross-validated AUC was also small at best (AUC=+0.02) and likely not the same for all risk groups.38,39 Patient vital signs may matter more for admissions related to certain disease categories (eg, cardiovascular disease, pulmonary disease). Similarly, in this study, no combination of BMI or BP measure significantly improved prediction over base models that included the comprehensive diagnostic based ACG DxPM risk score, but MAP range improved AUC for prediction of hospital admission and whether a patient was in the top 5% of cost for base models including the Charlson index. Generally, concurrent and prospective improvements from base were substantial across BMI and MAP ranges except for pharmacy cost and ER visit.
We have explored other definitions of change by modeling these health outcomes with continuous or categorical change features. Results from these experiments also suggest that regardless of direction, the likelihood of increased health utilization and cost increases proportional to the degree of change (Appendix B). This is consistent with the aforementioned non-linear relationships between BMI or BP and risk.11 Some researchers have also pointed out the limitations to understanding health risks by BMI, since it ignores information more specifically related to health outcomes: level of physical activity, amount of body fat and waist circumference.40,41
Our study has several limitations. First, our population is derived from only one large academic health system and our results may not be generalizable to other settings. Our aim was to simplify our conclusions about added predictive value, but by limiting those observations to just adult outpatient vital recordings who maintain continuous enrollment. We are currently evaluating other data sources to adequately explore these findings. Second, our results need to be further qualified by interactions with age, sex, race, and specific comorbidities. Stratified modeling may reveal some differences in model effects for younger or elderly cohorts, or populations that experience pervasive health disparities.10 Stratifying model performances based on the JHHC’s large Medicaid enrollment population, for example, may be a first step in addressing the potential for disparity due to social determinants of health. Third, we were unable to exhaustively test other formulations of change that might better capture differential health risks among patients. Duration of elevated BMI, for example, requires regular patient monitoring and measurement captured in the EHR to accurately infer how long a patient was obese. Finally, vital signs recorded as part of emergency care may differ considerably from outpatient care in terms of variability, frequency and magnitude. To make better sense of its added value, vitals recorded as part of emergency or hospital care services need to be considered separately and on a within-visit basis.
We believe the use of vital signs in risk prediction will become more important with increased use of remote sensor technologies and telemedicine. These technologies make it more likely that an EHR will have some minority of patients that have an abundance of vital signs recordings, but little historical and diagnostic information. In such situations, models that adequately predict risk using vitals and demographic information will become key in managing care for newly enrolled or remote patients. This is already being explored in the case of remote patient data supported by health and activity-level assessments.42 Health plans that can leverage vital signs or telemetric data to reliably predict risk, without traditionally relied on comorbidity indices, will further enable early detection and intervention efforts to improve patient health.
Conclusion
Body mass index and blood pressure information derived from EHRs offer value in predicting health risk when more comprehensive diagnostic information is absent or incomplete. Thus, use of BMI and BP in the prediction of healthcare-related outcomes appears best suited to situations where little else is known about a patient, as when a patient is new to the healthcare system or infrequently encounters health services. Clinicians and delivery systems can also leverage this relatively new, common electronic source of information for a wide variety of patient care, care management and quality improvement activities. The temporality of vital records also may have a significant role in understanding risk and should be more thoroughly explored in future research.
Acknowledgments
This work was made possible by previous database management, support, and conceptualization from the team at the Center for Population Health IT (CPHIT). This manuscript also references the Adjusted Clinical Groups (ACG) system, which is supported by CPHIT and its collaborators at Johns Hopkins HealthCare Solutions.
Disclosure
Johns Hopkins University (JHU) holds the copyright to the ACG System and receives royalties from the global distribution of the ACG system. This revenue supports a portion of the authors’ salary. The authors are members of a group of researchers who develop and maintain the ACG System with support from JHU. No additional or external funding supported this work. The authors report no other conflicts of interest in this work.
References
1. Goldstein BA, Navar AM, Pencina MJ, et al. Opportunities and challenges in developing risk prediction models with electronic health records data: a systemic review. J Am Med Inform Assoc. 2017;24(1):198–208. doi:10.1093/jamia/ocw042
2. Cowie MR, Blomster JI, Curtis LH, et al. Electronic health records to facilitate clinical research. Clin Res Cardiol. 2017;106(1):1–9. doi:10.1007/s00392-016-1025-6
3. Kharrazi H, Chi W, Chang HY, et al. Comparing population-based risk-stratification model performance using demographic, diagnosis and medication data extracted from outpatient electronic health records versus administrative claims. Med Care. 2017;55(8):789–796. doi:10.1097/MLR.0000000000000754
4. Chiu YL, Jhou MJ, Lee TS, Lu CJ, Chen MS. Health data-driven machine learning algorithms applied to risk indicators assessment for chronic kidney disease. Risk Manag Healthc Policy. 2021;14:4401–4412. PMID: 34737657; PMCID: PMC8558038. doi:10.2147/RMHP.S319405
5. Forrest CB, Lemke KW, Bodycombe DP, et al. Medication, diagnostic, and cost information as predictors of high-risk patients in need of care management. Am J Manag Care. 2009;15(1):41–48. PMID: 19146363.
6. Lemke KW, Gudzune KA, Kharrazi H, et al. Assessing markers from ambulatory laboratory tests for predicting high-risk patients. Am J Manag Care. 2018;24(6):e190–e195. PMID: 29939509.
7. Kharrazi H, Chang HY, Heins SE, et al. Assessing the impact of body mass index information on the performance of risk adjustment models in predicting health care costs and utilization. Med Care. 2018;56(12):1042–1050. doi:10.1097/MLR.0000000000001001
8. Bonnici T, Tarassenko L, Clifton DA, et al. The digital patient. Clin Med. 2013;13(3):252–257. doi:10.7861/clinmedicine.13-3-252
9. Zhao F, Li M, Tsien JZ. Technology platforms for remote monitoring of vital signs in the new era of telemedicine. Expert Rev Med Devices. 2015:1–19. doi:10.1586/17434440.2015.1050957.
10. Nuttall FQ. Body Mass Index. Nutr Today. 2015;50(3):117–128. doi:10.1097/NT.0000000000000092
11. Aune D, Sen A, Prasad M, et al. BMI and all cause mortality: systemic review and non-linear dose-response meta-analysis of 230 cohort studies with 3.74 million deaths among 30.3 million participants. BMJ. 2016:1–17. doi:10.1136/bmj.i2156.
12. Whittle J. Blood pressure variability predicts clinical outcomes. Now what? Hypertension. 2017;69(4):584–586. doi:10.1161/HYPERTENSIONAHA.116.08806
13. Mehlum MH, Liestøl K, Kjeldsen SE, et al. Blood pressure variability and risk of cardiovascular events and death in patients with hypertension and different baseline risks. Eur Heart J. 2018;39:2243–2251. doi:10.1093/eurheartj/ehx760
14. Asayama K, Wei F, Hara A, et al. Prognosis in relation to blood pressure variability. Hypertension. 2015;65:1170–1179. doi:10.1161/HYPERTENSIONAHA.115.04808
15. Staessen JA, Thijs L, Fagard R, et al. Predicting cardiovascular risk using conventional vs ambulatory blood pressure in older patients with systolic hypertension. J Am Med Assoc. 1999;282(6):539–547. doi:10.1001/jama.282.6.539
16. Schafer MH, Ferraro KF. Obesity and hospitalization over the adult life course: does duration of exposure increase use. J Health Soc Behav. 2007;48(4):434–449. doi:10.1177/002214650704800407
17. Johns Hopkins Medicine. Johns Hopkins HealthCare LLC; 2020. Available from: https://www.hopkinsmedicine.org/johns_hopkins_healthcare/.
18. Johns Hopkins Medicine. Community Physicians; 2020. Available from: https://www.hopkinsmedicine.org/community_physicians/patient_information/index.html.
19. Health Services Research & Development Center at the Johns Hopkins University Bloomberg School of Public Health. The Johns Hopkins ACG case-mix system reference manual version 12.0 Baltimore: the Johns Hopkins University; Bloomberg School of Public Health. Technical Reference Guide; 2019.
20. Gasparini A, Salmasian H, Williman J. Package ‘comorbidity’, CRAN R-Project; 2020. Available from: https://cran.r-project.org/web/packages/comorbidity/comorbidity.pdf.
21. Centers for Disease Control and Prevention. About Adult BMI. Available from: https://www.cdc.gov/healthyweight/assessing/bmi/adult_bmi/index.html.
22. Chobanian AV, Bakris GL, Black HR, et al. Seventh report of the joint national committee on prevention, detection, evaluation, and treatment of high blood pressure. Hypertension. 2003;42(6):1206–1252. doi:10.1161/01.HYP.0000107251.49515.c2
23. Chang HY, Weiner JP. An in-depth assessment of a diagnosis-based risk adjustment model based on national health insurance claims: the application of the Johns Hopkins adjusted clinical group case-mix system in Taiwan. BMC Med. 2010;8. doi:10.1186/1741-7015-8-7
24. Manning WG, Mullahy J. Estimating log models: to transform or not to transform? J Health Econ. 2001;20(4):461–494. doi:10.1016/S0167-6296(01)00086-8
25. Montez-Rath M, Christiansen CL, Ettner SL, Loveland S, Rosen AK. Performance of statistical models to predict mental health and substance abuse cost. BMC Med Res Methodol. 2006;6:53. doi:10.1186/1471-2288-6-53
26. Dodd S, Bassi A, Bodger K, Williamson P. A comparison of multivariable regression models to analyse cost data. J Eval Clin Pract. 2006. doi:10.1111/j.1365-2753.2006.00610.x
27. Kilian R, Matschinger H, Löeffler W, Roick C, Angermeyer MC. A comparison of methods to handle skew distributed cost variables in the analysis of the resource consumption in schizophrenia treatment. J Ment Health Policy Econ. 2002;5(1):21–31.
28. Chang HY, Richards TM, Shermock KM, et al. Evaluating the impact of prescription fill rates on risk stratification model performance. Med Care. 2017;55(12):1052–1060. doi:10.1097/MLR.0000000000000825
29. Ma X, Jung C, Chang H-Y, et al. Assessing the population-level correlation of medication regimen complexity and adherence indices using electronic health records and insurance claims. J Manag Care Spec Pharm. 2020;26(7):860–871. doi:10.18553/jmcp.2020.26.7.860
30. Chang H-Y, Kan HJ, Shermock KM, et al. Integrating e-prescribing and pharmacy-claim data for predictive modeling: comparing costs and utilization of health plan members who fill their initial medications with those who do not. J Manag Care Spec Pharm. 2020;26(10):1282–1290. doi:10.18553/jmcp.2020.26.10.1282
31. Kharrazi H, Ma X, Chang H-Y, et al. Comparing the predictive effects of patient medication adherence indices in EHR and claims-based risk stratification models. Popul Health Manag. 2021;24:601–609. doi:10.1089/pop.2020.0306
32. Kan H, Kharrazi H, Leff B, et al. Defining and assessing geriatric risk and associated health care utilization among elderly patients using claims and electronic health records. Med Care. 2018;56(3):233–239. doi:10.1097/MLR.0000000000000865
33. Chen T, Dredze M, Weiner JP, et al. Identifying vulnerable older adult populations by contextualizing geriatric syndrome information in clinical notes of electronic health records. J Am Med Inform Assoc. 2019;26(8–9):787–795. doi:10.1093/jamia/ocz093
34. Hatef E, Lasser EC, Kharrazi H, et al. A population health measurement framework: evidence-based metrics for assessing community-level population health in the global budget context. Popul Health Manag. 2017;21(4):261–270. doi:10.1089/pop.2017.0112
35. Hatef E, Searle KM, Predmore Z, et al. The impact of social determinants of health on hospitalization in the Veterans Health Administration. Am J Prev Med. 2019;56(6):811–818. doi:10.1016/j.amepre.2018.12.012
36. Hatef E, Kharrazi H, Searle KM, et al. The association between neighborhood socioeconomic and housing characteristics with hospitalization: results of a national study of veterans. J Am Board Fam Med. 2019;32(6):890–903. doi:10.3122/jabfm.2019.06.190138
37. Hatef E, Ma X, Rouhizadeh M, et al. Assessing the impact of social needs and social determinants of health on healthcare utilization: using patient and community level data. Popul Health Manag. 2020;24:222–230.
38. Tabak YP, Xiaowu S, Derby KG, et al. Development and validation of a disease-specific risk adjustment system using automated clinical data. Health Serv Res. 2010;45(6):1815–1835. doi:10.1111/j.1475-6773.2010.01126.x
39. Nimptsch U. Disease-specific trends of comorbidity coding and implications for risk adjustment in hospital administrative data. Health Serv Res. 2015;51(3):981–1001. doi:10.1111/1475-6773.12398
40. Murthy VL, Xia R, Baldridge A, et al. Polygenic risk, fitness, and obesity in Coronary Artery Risk Development in Young Adults (CARDIA) Study. JAMA Cardiol. 2020;5(3):263–271. doi:10.1001/jamacardio.2019.S220
41. Janssen I, Katzmarzyk PT, Ross R. Waist circumference and not body mass index explains obesity related health risk. Am J Clin Nutr. 2004;79:379–384. doi:10.1093/ajcn/79.3.379
42. Pietz K, Petersen LA. Comparing self-reported health status and diagnosis-based risk adjustment to predict 1- and 2 to 5-year mortality. Health Serv Res. 2006;42(2):629–643. doi:10.1111/j.1475-6773.2006.00622.x
 © 2022 The Author(s). This work is published and licensed by Dove Medical Press Limited. The
full terms of this license are available at https://www.dovepress.com/terms
and incorporate the Creative Commons Attribution
- Non Commercial (unported, 3.0) License.
By accessing the work you hereby accept the Terms. Non-commercial uses of the work are permitted
without any further permission from Dove Medical Press Limited, provided the work is properly
attributed. For permission for commercial use of this work, please see paragraphs 4.2 and 5 of our Terms.
© 2022 The Author(s). This work is published and licensed by Dove Medical Press Limited. The
full terms of this license are available at https://www.dovepress.com/terms
and incorporate the Creative Commons Attribution
- Non Commercial (unported, 3.0) License.
By accessing the work you hereby accept the Terms. Non-commercial uses of the work are permitted
without any further permission from Dove Medical Press Limited, provided the work is properly
attributed. For permission for commercial use of this work, please see paragraphs 4.2 and 5 of our Terms.