Back to Journals » OncoTargets and Therapy » Volume 10
Asparaginyl endopeptidase improves the resistance of microtubule-targeting drugs in gastric cancer through IQGAP1 modulating the EGFR/JNK/ERK signaling pathway
Authors Cui Y, Li Q, Li H, Wang Y, Wang H, Chen W, Zhang S, Cao J, Liu T ![]()
Received 24 October 2016
Accepted for publication 27 December 2016
Published 3 February 2017 Volume 2017:10 Pages 627—643
DOI https://doi.org/10.2147/OTT.S125579
Checked for plagiarism Yes
Review by Single anonymous peer review
Peer reviewer comments 2
Editor who approved publication: Dr Chiung-Kuei Huang
Yuehong Cui,1,* Qian Li,1,* Hong Li,1 Yan Wang,1 Hongshan Wang,2 Weidong Chen,2 Shangmin Zhang,3 Jian Cao,3 Tianshu Liu1
1Medical Oncology Department, 2General Surgery Department, Zhongshan Hospital, Fudan University, Shanghai, People’s Republic of China; 3Pathology Department, Yale School of Medicine, New Haven, CT, USA
*These authors contributed equally to this work
Purpose: In recent years, understanding of the role of asparaginyl endopeptidase (AEP) in tumorigenesis has steadily increased. In this study, we investigated whether AEP expression correlates with sensitivity to chemotherapeutic drugs in gastric cancer and explored the mechanism.
Patients and methods: AEP expression in the serum of patients’ peripheral blood was measured by enzyme-linked immunosorbent assay. Patient survival time was evaluated using univariate and multivariate analyses. Mass spectrometry and co-immunoprecipitation assays were utilized to discover proteins that interact with AEP. Gastric cancer cell lines were established, in which AEP was overexpressed or knocked out using lentiviral CRISPR. The proliferative abilities of these cell lines in response to chemotherapy agents were evaluated using the Cell Counting Kit-8 method. Gene expression changes in these lines were assessed by real-time polymerase chain reaction and Western blot.
Results: Patients with low expression of AEP were significantly more likely to have a good prognosis and experience complete response or partial response after treatment with docetaxel/S-1 regimen. Mass spectrum analysis showed that several proteins in the focal adhesion and mitogen-activated protein kinase signaling pathways interacted with AEP. IQGAP1 was confirmed to be one of the proteins interacting with AEP, and its protein level increased when AEP was knocked out. AEP knockout decreased resistance to microtubule inhibitors, including paclitaxel, docetaxel, and T-DM1. The expression levels of MDR1, p-EGFR, p-JNK, p-ERK, and p-Rac1/cdc42 were decreased in AEP knockout gastric cancer cell lines, and inhibitors of both JNK and ERK could block AEP-induced expression of MDR1.
Conclusion: AEP was not only a prognostic factor but also a predictive marker. AEP knockout could inhibit the activity of the EGFR/JNK/ERK signaling pathway and improve sensitivity to microtubule inhibitors through interacting with IQGAP1.
Keywords: Asparaginyl endopeptidase, MAP kinase signaling pathway, drug resistance, stomach cancer
Introduction
Gastric cancer is one of the main causes of cancer-related death in East Asian countries.1 The annual number of new cases of gastric cancer in People’s Republic of China reached 464,000 in 2012, which accounted for 46.9% of cases all over the world.2 With few available target therapies, chemotherapy is still the primary treatment option for the late-stage gastric cancer patients, but its efficacy is limited. Therefore, it is urgent to find some novel targets and new strategies to treat this disease.
Asparaginyl endopeptidase (AEP), also called legumain, is a newly found lysosome protein and a member of the C13 family of cysteine proteases.3 Overexpression of AEP in cancer was first reported in 2003.4 Several studies have shown that AEP expression was increased in tumor tissues, and that high expression of AEP predicted poor prognosis and short survival time in breast,5 ovarian,6 colorectal,7 prostatic,8 and gastric cancers.9,10 Furthermore, AEP was shown to promote invasion and metastasis of carcinomas through the degradation of extracellular matrix,11,12 release of angiogenesis factors,13 and regulation of immune-related genes.14,15 AEP has become an attractive biomarker in cancer research field. We have found that AEP was expressed higher in peritoneal metastatic loci than in primary gastric cancer, and that AEP could promote invasion and metastasis through inducing epithelial–mesenchymal transition in gastric cancer.16 However, the relationship between AEP and sensitivity to chemotherapies in gastric cancer is not yet known.
In this study, we analyzed the relationship between the expression of AEP in the serum of gastric cancer patients’ peripheral blood and the response rate of taxane-containing chemotherapy. Then we used lentiviral CRISPR technology to knock out AEP, and tested the proliferative ability of different chemotherapeutic agents. The mechanism of AEP conferring to resistance was further investigated.
Patients and methods
Eligible patients and tumor response assessment
Samples from 120 patients with clinically inoperable, recurrent, or metastatic gastric cancer were analyzed retrospectively. The serum of these patients’ peripheral blood had been kept when they were diagnosed with metastatic gastric cancer without any chemotherapy, or one finished adjuvant regimen that did not include taxanes or S-1. They were then treated with S-1 80 mg/m2 for 2 weeks and docetaxel 40 mg/m2 on day 1 every 21–28 days for 6–8 cycles, followed by S-1 single-agent maintenance if no progression or intolerance. S-1 is an oral fluorouracil antitumor drug that combines three pharmacological agents: tegafur, which is a prodrug of 5-fluorouracil; 5-chloro-2,4-dihydroxypyridine, which inhibits dihydropyrimidine dehydrogenase activity; and potassium oxonate, which reduces gastrointestinal toxicity. Response Evaluation Criteria in Solid Tumors, version 1.1 was used to assess tumor response. On the basis of the tumor response, we divided the patients into two groups: a responder group (CR [complete response] or PR [partial response]) and a nonresponder group (SD [stable disease] or PD [progressive disease]).
Measurement of AEP expression level in the serum of gastric cancer patients
The protein expression level of AEP in the serum was determined following the manual of DuoSet human total legumain/asparaginyl endopeptidase ELISA Development kit (R&D, DY4769).
Knockout and overexpression of AEP in gastric cancer cell lines
1) sgRNA sequences were designed using the website: http://chopchop.rc.fas.harvard.edu/. AEP sg-RNA 1: GTTCGTCAGGAATCCCATTG, AEP sg-RNA 2: GATCCGGCAAAGTCCTGAAG, scramble negative control (NC) sgRNA: GACCGGAACGATCTCGCGTA. Each target sequence was cloned into the lentiCRISPRv2 vector (Addgene plasmid # 52961) to make knockout plasmids. SGC7901 and MKN45 cells were infected with lentiviral constructs carrying sgRNAs. Cells were selected by treatment with puromycin (2 μg/mL) and continually cultured in puromycin afterwards. 2) We used AEP-FLAG plasmid (from Hanyinbt Company, Shanghai, People’s Republic of China) as the template and designed primers to amplify the plasmid. Following the GATEWAY recombinant method, the AEP overexpression plasmid was constructed through BP reaction (recombination between attB and attP sites, using BP Clonase enzyme mix) and LR reaction (entry clone containing attL sites+Destination vector containing attR sites, using LR Clonase enzyme mix). The overexpression plasmid and green fluorescent protein control vector were transfected into HEK293T cells to generate lentivirus, which was used to infect gastric cancer cell lines. Cells were selected by treatment with blasticidin (10 μg/mL).
Cell viability assay
AEP-KO (AEP knockout) or NC cells were seeded in 96-well plates and cultured with the indicated concentration of chemotherapeutic drugs. We used the calculated half maximal inhibitory concentration (IC50) as a working concentration (Table S1). The detecting reagent of tetrazolium salt was added to the wells. Cell viability was measured and calculated according to the manual of Cell Counting Kit-8 (KeyGEN BioTECH, Nanjing, People’s Republic of China). For each condition of treatment, at least three replicates were done and the average of these was used for statistical analysis.
Cells, chemotherapeutic agents, and antibodies
HEK293T cell line and the gastric cancer cell lines MKN45 and SGC7901 were purchased from Cell Bank, Typical Culture Collection Committee, Chinese Academy of Sciences (Shanghai, People’s Republic of China). Oxaliplatin (Sanofi Aventis, Hangzhou, People’s Republic of China), Irinotecan (Pfizer, New York, NY, USA), 5-fluorouracil (5-FU) (QILU Pharmaceutical Co., Ltd., Jinan, People’s Republic of China), Paclitaxel (Bristol-Myers Squibb, Wallingford, CT, USA), Docetaxel (Sanofi Aventis, Hangzhou, People’s Republic of China), T-DM1 (Trastuzumab emtansine, Roche, South San Francisco, CA, USA), Human Legumain/Asparaginyl Endopeptidase Antibody (R&D System Inc., AF2199, MAB2199), and IQGAP1 antibody (EMD Millipore Co., 05-504) were purchased from different companies. Other antibodies were from Cell Signaling Technology. SP600125 and PD98059 were obtained from Selleck Chemicals LLC (Houston, CA, USA).
Immunoisolation of AEP-containing complexes, in-gel tryptic digestion, and two-dimensional liquid chromatography coupled with tandem mass spectrometry (2D-LC–MS/MS)
The solubilized protein extracts were incubated with 3 μL of anti-FLAG M2 agarose (Sigma) plus 27 μL of protein A/G beads at 4°C overnight. The beads were then washed with lysis buffer five times, followed by boiling in 2× sodium dodecyl sulfate (SDS) buffer. The immunoprecipitates were resolved on an SDS-polyacrylamide gel electrophoresis (PAGE) denaturing gel, visualized by Coomassie blue staining, and the protein band of interest was removed for mass spectrum analysis. Mass spectrometry was performed under 19-kV accelerating voltage in reflection mode with an m/z range of 400–2,000. All mass spectrum data were identified using SEQUEST (v.28, Bioworks 3.3 software package, Thermo Electron) against the Human International Protein Index (IPI, Hinxton, UK) database (IPI human v3.45 FASTA with 71,983 entries).
Co-immunoprecipitation
Endogenous gastric cancer cell protein extracts were incubated with 4 μg AEP monoclonal antibody (mAb) and 30 μL protein A/G agarose beads (#20421, Thermo Fisher Scientific, Rockford, IL, USA). After overnight incubation, beads were washed three times with lysis buffer, separated by SDS-PAGE, and then analyzed by Western blot.
Real-time polymerase chain reaction
According to the instructions of the RNeasy Plus Mini Kit (Cat No 74136, Qiagen), total RNAs were extracted from the gastric cancer cell lines, and their purity and concentration were determined. High-capacity cDNA Reverse Transcription kit (Cat No 4368814, Thermo Fisher Scientific Inc.) was used to do reverse transcription reactions. Ten-microliter polymerase chain reactions (PCRs) were set up, comprising 1 μL reverse transcription product as the templates, 5 μL of 2× SYBR Green PCR Master Mix (Cat No 4309155, Applied Biosystems by Life Technologies), 2 μL of primer, and 2 μL RNase-free water. Glyceraldehyde 3-phosphate dehydrogenase served as an internal reference to calculate the relative quantification values of target genes, which served as a basis for statistical analysis. The primer sequences were as listed in Table S2.
Western blot
Cells were directly lysed in high-salt buffer and separated by 10% SDS-PAGE. Immunoblot analysis was performed by initial transfer of proteins onto nitrocellulose membranes using Mini Trans-Blot (Bio-Rad Laboratories) and followed by a blocking step. After incubating with primary antibody overnight, the blots were then incubated with a secondary antibody conjugated with horseradish peroxidase (HRP) for 1 h at room temperature. The protein signals were visualized with chemiluminescent HRP substrate.
Statistical analysis
The independent-samples t-test was used to compare protein expression levels and various factors. Progression-free survival (PFS) and overall survival (OS) were estimated using the Kaplan–Meier survival analysis by log rank test. SPSS software (version 11.5) was used in all analyses, and a P-value of <0.05 was considered significant.
Results
AEP expression in the serum of patients’ peripheral blood was not only a prognostic marker, but also a predictive indicator
Patients’ characteristics
We retrospectively analyzed 120 patients with gastric cancer, who were enrolled in our follow-up database between March 2010 and April 2012 in the Department of Medical Oncology of Shanghai Zhongshan Hospital, Fudan University. The last follow-up was in March 2016. The median follow-up time was 37.0 months (range: 29.00–69.00 months). Patients’ characteristics are shown in Table 1.
 | Table 1 Clinical characteristics of patients |
Clinical efficacy: the response rate, PFS, and OS
The dose intensity of S-1 and docetaxel was 75.3% and 85.6%, respectively. The overall response rate (= CR + PR) was 35.0%, including 40 patients with PR and two patients with CR. Fifty-six (46.7%) patients had SD, then the overall disease control rate (= CR + PR + SD) was 81.7%. Twenty-two patients (18.3%) experienced PD after the first evaluation. The median PFS time was 5.0 months (95% confidential interval [CI]: 4.61–5.39 months; Figure 1A) and the median OS time was 12.0 months (95% CI: 11.10–12.89 months; Figure 1B).
 | Figure 1 The analysis of survival time. |
The expressive level of AEP in the serum of gastric cancer patients’ peripheral blood
Enzyme-linked immunosorbent assay was used to measure AEP protein expression levels in the serum of gastric cancer patients’ peripheral blood. The median AEP value was 334.80±169.78 pg/mL. The AEP protein expression level was not related to patients’ gender, age, performance status, pathological type, or toxicities. AEP protein expression level was significantly lower in responders (276.85±165.12 pg/mL) than in nonresponders (382.51±161.47 pg/mL), seen in Table 2. As shown in Table 3 and Figure 2A and B, the low expression of AEP (≤ median value) predicted longer PFS (6.0 vs 5.0 months) and OS (14.0 vs 10.0 months) than that of AEP high expression (> median value).
 | Table 2 The expression level of AEP in the serum of gastric cancer patients’ peripheral blood with different clinical response |
 | Table 3 The expression of AEP in the serum of peripheral blood at baseline and the survival time |
 | Figure 2 The analysis of survival time according to AEP expression. |
Sensitivity to chemotherapeutic drugs increased when AEP was stably knocked out in SGC7901 and MKN45 gastric cancer cell lines
To explore the role of AEP in gastric cancer, we stably knocked out and overexpressed AEP (AEP-OE) in SGC7901 and MKN45 cells (Figure 3A and B), and used scramble-sequence sgRNA as NC. We investigated the effect of oxaliplatin, irinotecan, 5-FU, paclitaxel, docetaxel, and T-DM1 on the proliferative ability in AEP-KO and NC groups using the Cell Counting Kit-8 method. Proliferation decreased significantly upon treatment with 5-FU, paclitaxel, docetaxel, and T-DM1 in SGC7901 AEP-KO gastric cancer cells compared with the NC cells. Similarly, the proliferative ability of MKN45-AEP KO cells was considerably reduced compared with NC cells when the cells were treated with oxaliplatin, paclitaxel, docetaxel, and T-DM1. Therefore, AEP-KO increased the sensitivity to paclitaxel, docetaxel, and T-DM1 both in SGC7901 and MKN45 cells (Figure 3C and D).
 | Figure 3 Construction of stable AEP knockout and overexpressive gastric cancer cell lines and the sensitivity to different chemotherapeutic drugs. |
Analysis of AEP interacting proteins by proteomic screen maps
As seen above, AEP was associated with sensitivity to microtubule-targeting drugs. To investigate the mechanism by which AEP affects sensitivity to the chemotherapeutic agents, we used immunoprecipitation to extract the proteins that could be interacting with AEP, followed with mass spectrometry to identify the proteins that interact with AEP in SGC7901 and MKN45 cells. First, the Functional Annotation Tool (DAVID Bioinformatics Resources 6.7, NIAID/NIH, Frederick, MD, USA) was utilized to analyze the relevant pathways by choosing KEGG_PATHWAY command, which included 155 genes in SGC7901 cells and 274 genes in MKN45 cells. The result showed that proteins involved in the focal adhesion and the mitogen-activated protein kinase (MAPK) pathways were highly associated with AEP (Figure 4A). There were 34 and 30 proteins with >10 peptides that were identified in MKN45 and SGC7901 cells by mass spectrum analysis, respectively (listed in Tables S3 and S4). Among them, 10 proteins were found in both the SGC7901 and MKN45 gastric cancer cell lines, indicating that they might be AEP interacting proteins, such as IQGAP1, GRP78, PRMT5, HSP90, Vimentin, β-tubulin, and more (Figure 4B).
 | Figure 4 Analysis of AEP interacting proteins. |
IQGAP1 was verified to be an AEP interacting protein and its expression was increased by AEP-KO
Based on the results from mass spectrum analysis, there were many genes in the focal adhesion and MAPK signaling pathways that might be interacting with AEP, and IQGAP1 was a well-known regulator of signaling events involved in cytoskeletal rearrangement and the MAPK signaling pathway. Therefore, we used an AEP-FLAG plasmid to transfect gastric cancer cells and used M2-FLAG beads to pull down the interacting proteins. The results revealed that IQGAP1 was indeed an interacting protein of AEP (Figure 5A and D). We also used an AEP mAb to extract the endogenous interacting proteins. IQGAP1 was also found to interact with AEP endogenously in gastric cancer cells (Figure 5B and E). Furthermore, we detected the expression of IQGAP1 when AEP was knocked out through Western blot assay, and the results showed that the IQGAP1 protein level was elevated when AEP was knocked out (Figure 5C and F).
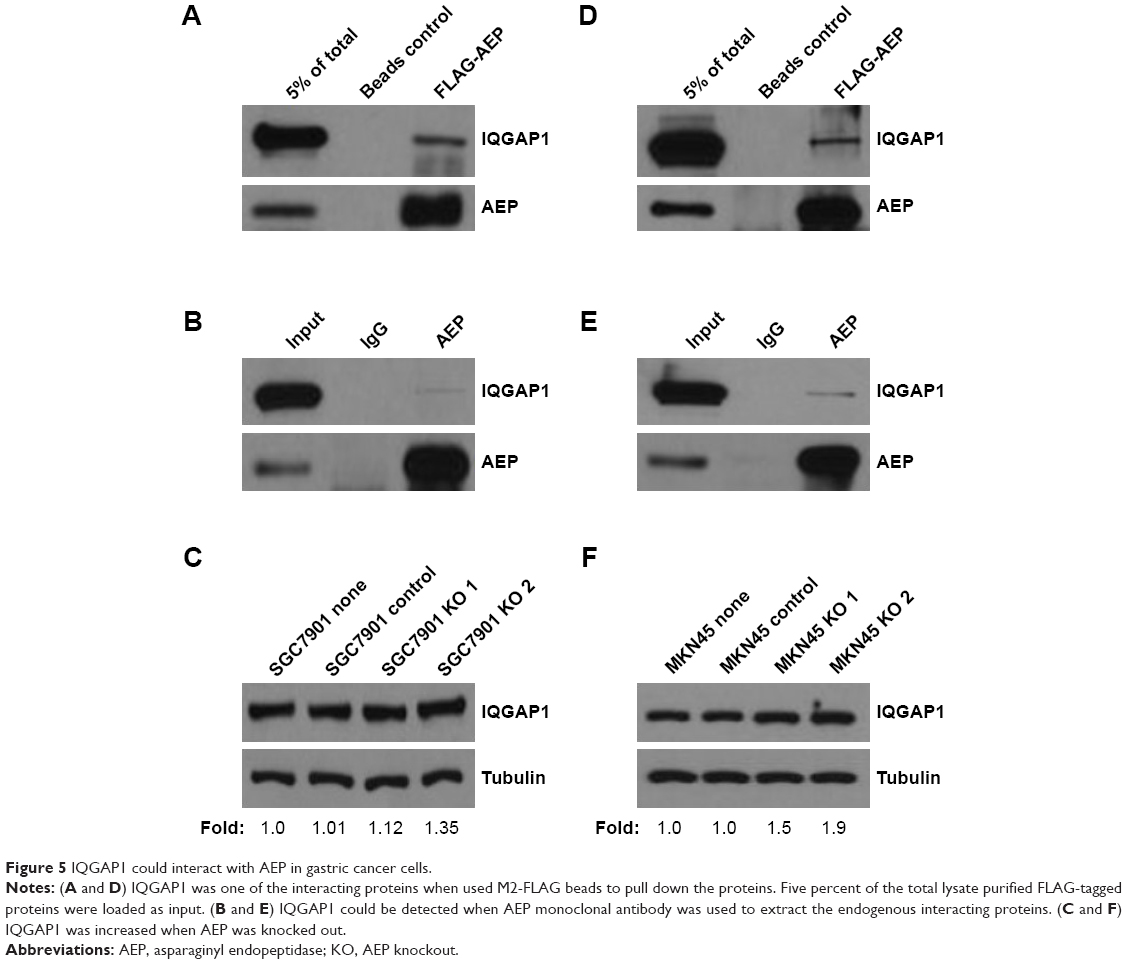 | Figure 5 IQGAP1 could interact with AEP in gastric cancer cells. |
Genetic alteration at mRNA level
As the MAP kinase pathway was related to AEP by mass spectrum analysis, we explored several important genes of this pathway and utilized real-time PCR to compare their mRNA expression in AEP-KO, NC, and parental cells. EGFR, IQGAP1, H-RAS, N-RAS, K-RAS, B-RAF, MEK1/2, and ERK1/2, and several genes associated with resistance, such as MDR1, MRP1, and GST-π, were detected. Only MDR1 was decreased significantly in AEP-KO gastric cancer cells compared with parental and NC cells (cutoff > threefold change), as shown in Figure 6. There were no significant expression differences for any other genes (Figure S1). Thus, a reduction in MDR1 expression might be one of the reasons to explain how AEP-KO increased cell sensitivity to microtubule-targeting drugs.
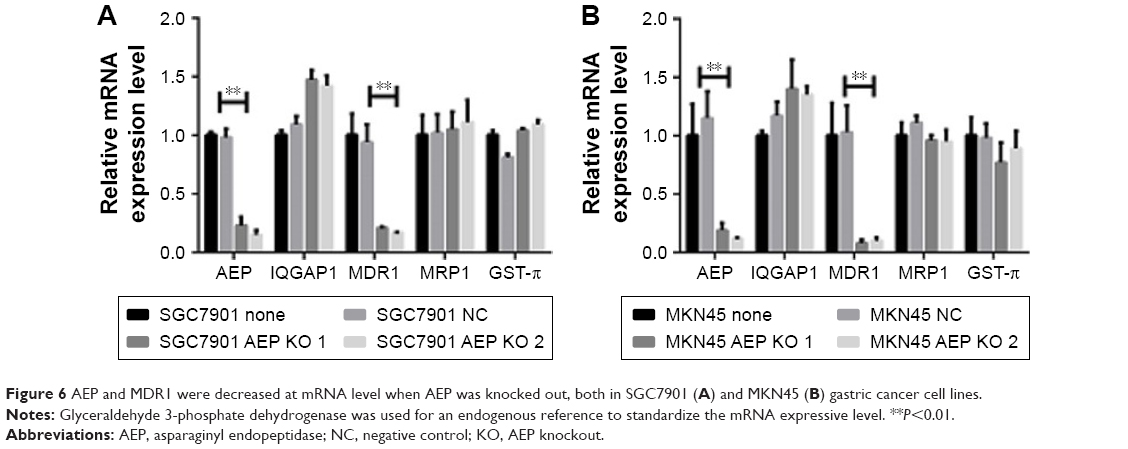 | Figure 6 AEP and MDR1 were decreased at mRNA level when AEP was knocked out, both in SGC7901 (A) and MKN45 (B) gastric cancer cell lines. |
Downregulation of MDR1 and inactivation of the EGFR/c-JUN N-terminal kinase/ERK signaling pathway in AEP-KO gastric cancer cell lines, and vice versa in AEP-OE cells
Subsequently, we detected the expression of phospho-p38/p38, phospho-JNK/JNK, and phospho-ERK1/2/ERK1/2 in the groups of normal, NC, and AEP-KO gastric cancer cells because phospho-p38, phospho-JNK, and phospho-ERK1/2 represented the activity of the MAPK kinase pathway. The results showed that the expression levels of phospho-JNK and phospho-ERK1/2, but not phospho-p38, were decreased in AEP-KO gastric cancer cells, while the total levels remained steadfast. The protein level of MDR1 was investigated in these groups as well, and was also decreased in AEP-KO gastric cancer cells (Figure 7A). IQGAP1 is a 190-kDa protein that contains six distinct protein-interacting domains, which are CH (calponin homology), CC (coiled-coil), WW (domain with two conserved tryptophan residues), IQ1-4 (isoleucine-glutamine), GRD (GTPase-activation-related domain), and RGCT (Ras GAP C-terminus) domains. ERK1/2 is the only identified ligand for the WW domain. EGFR and Rac1/cdc42 interact with IQ and RGCT domains, respectively. Therefore, as these proteins can also interact with IQGAP1, EGFR, and Rac1/cdc42, activation was also examined. Phospho-EGFR and phospho-Rac1/cdc42 were reduced upon AEP-KO.
 | Figure 7 JNK and ERK signaling pathways and MDR1 were inhibited in AEP knockout gastric cancer cell lines, and vice versa. |
In AEP-OE gastric cancer cells, the expression levels of phospho-EGFR, phospho-JNK, phospho-ERK1/2, phospho-Rac1/cdc42, and MDR1 were increased (Figure 7B). SP600125 and PD98059, specific inhibitors of JNK and ERK, respectively, were utilized to better understand the contribution of the changes in phosphorylated proteins and MDR1 expression to drug resistance in AEP-OE cells. As shown in Figure 7C, both SP600125 and PD98059 significantly inhibited the expression of phospho-JNK, phospho-ERK, and MDR1. When treated with these two inhibitors, the IC50 values of docetaxel, paclitaxel, and T-DM1 were decreased in a dose-dependent manner in AEP-OE cells. As shown in Figure 7D–F, 30 μM SP600125 or PD98059 treatment can decrease the IC50 values of docetaxel, paclitaxel, and T-DM1 to one-fifth or one-fourth of the original, respectively, in MKN45 AEP-OE cells (IC50 values shown in Table S5). Our results suggested that the inhibition of JNK/ERK signaling pathway induced AEP-OE cells to become more sensitive to taxanes and T-DM1 treatment.
Discussion
AEP was shown to promote cell migration and its overexpression was associated with tumor invasion and metastasis. AEP in the serum of breast cancer patients has been reported to be a prognostic factor.13 In this study, we retrospectively analyzed 120 patients who received the chemotherapy regimen of low-dose docetaxel plus standard S-1. We measured the AEP expression in the serum of gastric cancer patients at baseline and analyzed the relationship between AEP and survival time. Our analysis verified that AEP was a prognostic marker. High expression of AEP predicted short PFS and OS. We also found that the expressive level of AEP in the serum of gastric cancer patients’ peripheral blood was associated with the sensitivity to microtubule-targeting drugs. Patients with low AEP expression were apt to have a CR or PR to a docetaxel/S-1 combination regimen. AEP was previously reported to be associated with survival time of gastric cancer patients and predicted poor prognosis,9,10 but the two papers analyzed the relationship between survival time of patients and the expression of AEP in primary cancer tissues, not in the serum of patients’ peripheral blood. Therefore, combining previously published reports with our findings, AEP can predict prognosis not only in primary gastric cancer tissues, but also in the serum of gastric cancer patients’ peripheral blood.
To investigate whether AEP was relevant to the sensitivity of chemotherapy agents, we constructed AEP-KO gastric cancer cell lines to determine the role of AEP in the proliferation of cells in response to different cytotoxic agents (oxaliplatin, irinotecan, 5-FU, paclitaxel, and docetaxel) and one targeted drug (T-DM1). We found that knockout of AEP significantly sensitized SGC7901 and MKN45 gastric cancer cell lines to paclitaxel, docetaxel, and T-DM1. 5-FU is an antimetabolite drug, which works through irreversible inhibition of thymidylate synthase (TS). It has been reported that the 5-FU sensitivity of gastric cancer cells did not correlate with the basal TS expression levels, but did correlate with rapid detection of the TS-FdUMP (5-FU metabolite and 5-fluoro-dUMP) complex after exposure to 5-FU.17 The SGC7901 gastric cancer cell line was more sensitive to 5-FU than the MKN45 cell line when AEP was knocked out. AEP-KO might affect the expression level of TS-FdUMP complex when gastric cancer cells were treated with 5-FU. The mechanism deserves further study. Paclitaxel and docetaxel are microtubule-targeting agents. T-DM1 is an antibody–drug conjugate consisting of the mAb trastuzumab linked to the cytotoxic agent DM1. Trastuzumab is a humanized mAb directed against the extracellular domain of human epidermal growth factor receptor 2 (HER2), whereas DM1 enters cells and destroys them by binding to microtubules.18 Although SGC7901 and MKN45 were HER2-negative cells, T-DM1 could affect the gastric cancer cells’ proliferative ability through targeting microtubules. Therefore, it appears that AEP mediates sensitivity to microtubule inhibitors in gastric cancer cells.
To explore the mechanism by which AEP contributes to resistance to chemotherapy, we used immunoprecipitation to extract AEP interacting proteins, and then analyzed these proteins by mass spectrometry. The result showed that the proteins interacting with AEP were mainly involved in the focal adhesion and MAPK pathways. Among the top 10 associated proteins, IQGAP1 has been reported to be an essential regulator of the MAPK signaling pathway.19 Therefore, we used M2-FLAG beads and AEP mAb to pull down the interacting proteins, and verified that IQGAP1 indeed interacted with AEP. IQGAP1 protein expression was increased when AEP was knocked out. Next, we detected mRNA and protein expression and activation of several functional genes in the MAPK signaling pathway and genes known to be involved in drug resistance. The expression levels of MDR1, phospho-EGFR, phospho-JNK, and phospho-ERK decreased when AEP was knocked out, but not phospho-p38. In support of this finding, another study reported that modulating the expression of IQGAP1 did not affect the activity of the p38/MAPK signaling pathway.20
IQGAP1 is a highly conserved cytoplasmic scaffold protein, and plays a central role in cell–cell adhesion and cytoskeletal rearrangement. There are six functional domains of IQGAP1, each of which contains specific protein recognition motifs. The WW domain of IQGAP1 functions as an interaction module for proline-rich ligands. ERK1/2 is the only identified ligand for the WW domain on IQGAP1.21 The IQ domain interacts with the cell-surface receptors, including EGFR and HER2.22,23 Small GTPases such as Rac1/cdc42 can interact with the RGCT domain.24 JNK is a well-documented effector of Rac1/cdc42.25 Thus, we detected the expression of phospho-Rac1/cdc42 and total Rac1/cdc42, and found that phospho-Rac1/cdc42 decreased when AEP was knocked out.
The role of IQGAP1 has been studied in different models. Li et al26 showed that aged mice lacking IQGAP1 developed gastric hyperplasia, suggesting a role for IQGAP1 in maintaining epithelial integrity during aging. Bessède et al27 found that IQGAP1 inhibition favored epithelial–mesenchymal transition and acquisition of cancerous stem-cell properties, and that decreased IQGAP1 accentuated Helicobacter pylori carcinogenesis. It has been reported that transient overexpression of IQGAP1 in MCF-7 breast cancer cells significantly reduced activation of ERK1 and ERK2 by EGF, namely phospho-ERK1/2 was decreased.28,29 Roy et al21 have reported that maximal activation of MEK and ERK by EGF was observed only when cellular IQGAP1 concentrations were close to normal levels. Both decreased and overexpressed IQGAP1 inhibited the activity of MEK and ERK. IQGAP1, acting as a scaffold, can assemble its client proteins if all components are present in an appropriate stoichiometric ratio. On the basis of our results, IQGAP1 might be a new substrate of AEP. We propose that when AEP was knocked out, IQGAP1 could not be degraded, and an excess of IQGAP1 led to formation of nonfunctional binary complexes of IQGAP1 containing only one of the components of the kinase cascade. This caused the effective signal to stop being relayed to the downstream mediators of the MAPK signaling pathway. Therefore, overexpression of the scaffold IQGAP1 inhibited the activity of the EGFR/JNK and EGFR/ERK signaling pathways.
The development of chemotherapy-induced drug resistance is a major obstacle in the treatment of cancer. Increased P-glycoprotein (P-gp) activity, encoded by the MDR1 (ABCB1) gene, often as a result of a chemotherapy-induced gene amplification event, has been associated with the development of drug resistance in a variety of human solid tumors and hematologic cancers.30 It has been reported that the cytotoxic taxanes, paclitaxel and docetaxel, are substrates for P-gp-mediated efflux, and their efficacy is thus compromised in cells that overexpress P-gp.31 Many studies in vitro and in vivo have shown that the molecular mechanisms of tumor multidrug resistance are very complex, which involved many factors, such as gene mutations, related protein expression, and deficiencies of stem-cell function. As one of the most important regulation pathways of the cell-signaling system, MAPK played an important role in the drug resistance. The JNK and ERK signaling pathways have been reported to contribute to the resistance of paclitaxel and docetaxel.32–35 In this study, we found that phospho-JNK and phospho-ERK were decreased in AEP-KO gastric cancer cells, and we also verified that AEP-KO in gastric cancer cells induced a significant decrease in MDR1 expression at both the mRNA and protein levels. Moreover, when treated with inhibitors of the JNK and ERK signaling pathways, SP600125 and PD98059, respectively, at lower nontoxic concentrations in AEP-OE gastric cancer cells, the expression of MDR1 and the IC50 of taxanes were significantly decreased. On the basis of the results of this study, AEP could promote resistance to microtubule inhibitors through activating the JNK/ERK signaling pathways, and AEP might be a new target to overcome the resistance to microtubule-targeting agents.
Conclusion
Resistance to chemotherapeutic drugs and molecular targeting agents has become a crucial problem in cancer therapy, which has not yet been overcome. Moreover, gastric cancer is highly heterogeneous, so the mechanism of drug resistance might be complicated. Here we found that AEP was not only associated with the prognosis of gastric cancer patients, but also could predict the efficacy of taxane chemotherapy, and that AEP-KO reversed resistance to microtubule inhibitors through inhibiting the activity of the EGFR/JNK/ERK signaling pathway. Therefore, in the future, AEP might become a new biomarker and drug target for the diagnosis and treatment of gastric cancer to help meet our aims to reverse drug resistance and improve gastric cancer patients’ overall survival time.
Disclosure
The authors report no conflicts of interest in this work.
References
Lin Y, Ueda J, Kikuchi S, et al. Comprehensive epidemiology of gastric cancer between Japan and China. World J Gastroenterol. 2011;17(39):4421–4428. | ||
Siegel R, Naishadham D, Jemal A. Cancer statistics, 2012. CA Cancer J Clin.2012;62(1):10–29. | ||
Decock J, Paridaens R, Cufer T. Proteases and metastasis: clinical relevance nowadays? Curr Opin Oncol. 2005;17(6):545–550. | ||
Liu C, Sun C, Huang H, Janda K, Edgington T. Overexpression of legumain in tumors is significant for invasion/metastasis and a candidate enzymatic target for prodrug therapy. Cancer Res. 2003;63(11):2957–2964. | ||
Wu M, Shao GR, Zhang FX, Wu WX, Xu P, Ruan ZM. Legumain protein as a potential predictive biomarker for Asian patients with breast carcinoma. Asian Pac J Cancer Prev. 2014;15(24):10773–10777. | ||
Wang L, Chen S, Zhang M, et al. Legumain: a biomarker for diagnosis and prognosis of human ovarian cancer. J Cell Biochem. 2012;113(8):2679–2686. | ||
Haugen MH, Boye K, Nesland JM, et al. High expression of the cysteine proteinase legumain in colorectal cancer–Implications for therapeutic targeting. Eur J Cancer. 2015;51(1):9–17. | ||
Ohno Y, Nakashima J, Izumi M, Ohori M, Hashimoto T, Tachibana M. Association of legumain expression pattern with prostate cancer invasiveness and aggressiveness. World J Urol. 2013;31(2):359–364. | ||
Li N, Liu Q, Su Q, et al. Effects of legumain as a potential prognostic factor on gastric cancers. Med Oncol. 2013;30(3):621. | ||
Guo P, Zhu Z, Sun Z, Wang Z, Zheng X, Xu H. Expression of legumain correlates with prognosis and metastasis in gastric carcinoma. PLoS One. 2013;8(9):e73090. | ||
Chen JM, Fortunato M, Stevens RA, Barrett AJ. Activation of progelatinase A by mammalian legumain, a recently discovered cysteine proteinase. Biol Chem. 2001;382(5):777–783. | ||
Morita Y, Araki H, Sugimoto T, et al. Legumain/asparaginyl endopeptidase controls extracellular matrix remodeling through the degradation of fibronectin in mouse renal proximal tubular cells. FFBS Lett. 2007;581(7):1417–1424. | ||
Lin Y, Qiu Y, Xu C, et al. Functional role of asparaginyl endopeptidase ubiquitination by TRAF6 in tumor invasion and metastasis. J Natl Cancer Inst. 2014;106(4):dju012. | ||
Sepulveda FE, Maschalidi S, Colisson R, et al. Critical role for asparagine endopeptidase in endocytic Toll-like receptor signaling in dendritic cells. Immunity. 2009;31(5):737–748. | ||
Lin Y, Wei C, Liu Y, Qiu Y, Liu C, Guo F. Selective ablation of tumor-associated macrophages suppresses metastasis and angiogenesis. Cancer Sci. 2013;104(9):1217–1225. | ||
Cui Y, Wang Y, Li H, et al. Asparaginyl endopeptidase promotes the invasion and metastasis of gastric cancer through modulating epithelial-to-mesenchymal transition and analysis of their phosphorylation signaling pathways. Oncotarget. 2016;7(23):34356–34370. | ||
Nabeya Y, Suzuki T, Furuya A, et al. Calpain regulates thymidylate synthase-5-fluoro-dUMP complex levels associated with response to 5-fluorouracil in gastric cancer cells. Cancer Sci. 2011;102(8):1509–1515. | ||
Teicher BA, Doroshow JH. The promise of antibody-drug conjugates. N Engl J Med. 2012;367(19):1847–1848. | ||
Sacks DB. The role of scaffold proteins in MEK/ERK signalling. Biochem Soc Trans. 2006;34(Pt 5):833–836. | ||
Liu Y, Liang W, Yang Q, et al. IQGAP1 mediates angiotensin II-induced apoptosis of podocytes via the ERK1/2 MAPK signaling pathway. Am J Nephrol. 2013;38(5):430–444. | ||
Roy M, Li Z, Sacks DB. IQGAP1 is a scaffold for mitogen-activated protein kinase signaling. Mol Cell Biol. 2005;25(18):7940–7952. | ||
McNulty DE, Li Z, White CD, Sacks DB, Annan RS. MAPK scaffold IQGAP1 binds the EGF receptor and modulates its activation. J Biol Chem. 2011;286(17):15010–15021. | ||
White CD, Li Z, Dillon DA, Sacks DB. IQGAP1 protein binds human epidermal growth factor receptor 2 (HER2) and modulates trastuzumab resistance. J Biol Chem. 2011;286(34):29734–29747. | ||
Grohmanova K, Schlaepfer D, Hess D, Gutierrez P, Beck M, Kroschewski R. Phosphorylation of IQGAP1 modulates its binding to Cdc42, revealing a new type of rho-GTPase regulator. J Biol Chem. 2004;279(47):48495–48504. | ||
Teramoto H, Coso OA, Miyata H, Igishi T, Miki T, Gutkind JS. Signaling from the small GTP-binding proteins Rac1 and Cdc42 to the c-Jun N-terminal kinase/stress-activated protein kinase pathway. A role for mixed lineage kinase 3/protein-tyrosine kinase 1, a novel member of the mixed lineage kinase family. J Biol Chem. 1996;271(44):27225–27228. | ||
Li S, Wang Q, Chakladar A, Bronson RT, Bernards A. Gastric hyperplasia in mice lacking the putative Cdc42 effector IQGAP1. Mol Cell Biol. 2000;20(2):697–701. | ||
Bessède E, Molina S, Acuña Amador L, et al. Deletion of IQGAP1 promotes Helicobacter pylori-induced gastric dysplasia in mice and acquisition of cancer stem cell properties in vitro. Oncotarget. Epub 2016 Oct 6. | ||
Roy M, Li Z, Sacks DB. IQGAP1 binds ERK2 and modulates its activity. J Biol Chem. 2004;279(17):17329–17337. | ||
Roy M, Li Z, Sacks DB. IQGAP1 is a scaffold for mitogen-activated protein kinase signaling. Mol Cell Biol. 2005;25(18):7940–7952. | ||
Thomas H, Coley HM. Overcoming multidrug resistance in cancer: an update on the clinical strategy of inhibiting p-glycoprotein. Cancer Control. 2003;10(2):159–165. | ||
Goodman Gilman A. Goodman & Gilman’s: the pharmacological basis of therapeutics. 9th ed. In: Hardman JG, Limbird LE, Molinoff PB, Ruddon RW, Gilman AG, editors. Companies Health Professions Division. New York, NY: McGraw-Hill. 1996. | ||
Liu Q, Harvey CT, Geng H, et al. Malate dehydrogenase 2 confers docetaxel resistance via regulations of JNK signaling and oxidative metabolism. Prostate. 2013;73(10):1028–1037. | ||
Kim JB, Park SY, Kim HR, et al. JNK signaling in hepatocarcinoma cells is associated with the side population upon treatment with anticancer drugs. Mol Med Rep. 2015;11(1):263–268. | ||
Jeong EK, Lee SY, Jeon HM, Ju MK, Kim CH, Kang HS. Role of extracellular signal-regulated kinase (ERK)1/2 in multicellular resistance to docetaxel in MCF-7 cells. Int J Oncol. 2010;37(3):655–661. | ||
Kato T, Fujita Y, Nakane K, et al. CCR1/CCL5 interaction promotes invasion of taxane-resistant PC3 prostate cancer cells by increasing secretion of MMPs 2/9 and by activating ERK and Rac signaling. Cytokine. 2013;64(1):251–257. |
Supplementary materials
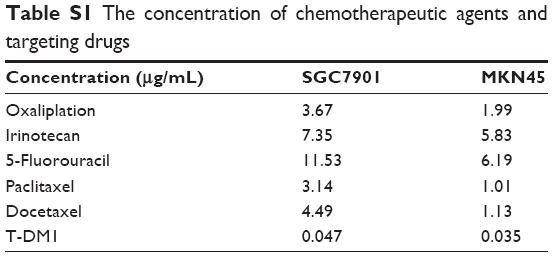 | Table S1 The concentration of chemotherapeutic agents and targeting drugs |
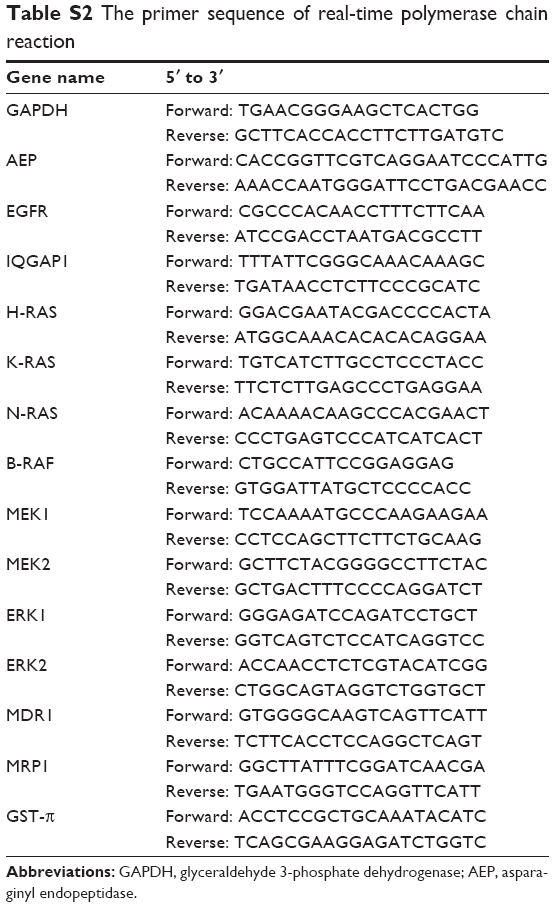 | Table S2 The primer sequence of real-time polymerase chain reaction |
 | Table S3 The interacting proteins involving >10 peptides in SGC7901 gastric cancer cell line |
 | Table S4 The interacting proteins involving >10 peptides in MKN45 gastric cancer cell line |
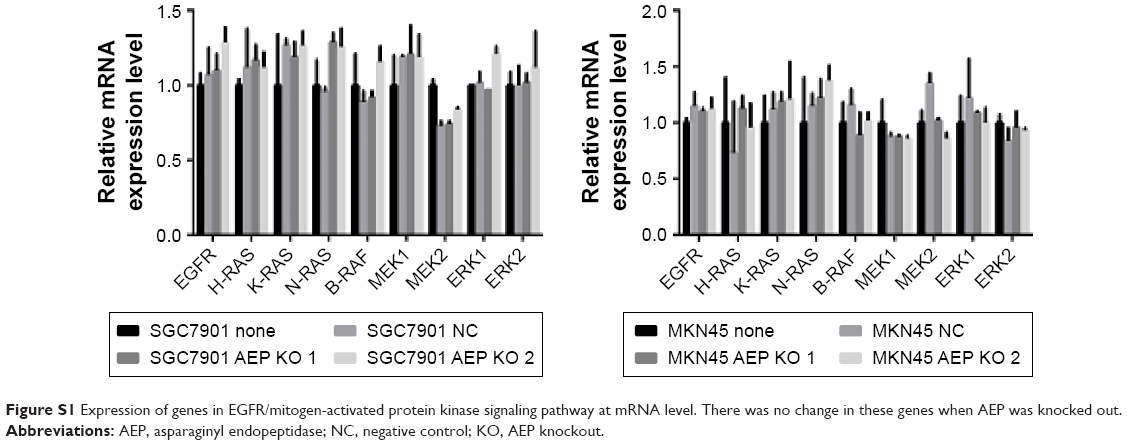 | Figure S1 Expression of genes in EGFR/mitogen-activated protein kinase signaling pathway at mRNA level. There was no change in these genes when AEP was knocked out. |
 | Table S5 Resensitizing AEP-OE MKN45 cells to taxanes and T-DM1 using inhibitors of JNK or ERK signaling pathway |
 © 2017 The Author(s). This work is published and licensed by Dove Medical Press Limited. The
full terms of this license are available at https://www.dovepress.com/terms
and incorporate the Creative Commons Attribution
- Non Commercial (unported, 3.0) License.
By accessing the work you hereby accept the Terms. Non-commercial uses of the work are permitted
without any further permission from Dove Medical Press Limited, provided the work is properly
attributed. For permission for commercial use of this work, please see paragraphs 4.2 and 5 of our Terms.
© 2017 The Author(s). This work is published and licensed by Dove Medical Press Limited. The
full terms of this license are available at https://www.dovepress.com/terms
and incorporate the Creative Commons Attribution
- Non Commercial (unported, 3.0) License.
By accessing the work you hereby accept the Terms. Non-commercial uses of the work are permitted
without any further permission from Dove Medical Press Limited, provided the work is properly
attributed. For permission for commercial use of this work, please see paragraphs 4.2 and 5 of our Terms.