Back to Journals » Drug Design, Development and Therapy » Volume 11
Artonin E induces p53-independent G1 cell cycle arrest and apoptosis through ROS-mediated mitochondrial pathway and livin suppression in MCF-7 cells
Authors Etti IC, Rasedee A, Hashim NM, Abdul AB, Kadir A, Yeap SK, Waziri P, Malami I, Lim KL, Etti CJ
Received 10 October 2016
Accepted for publication 11 January 2017
Published 20 March 2017 Volume 2017:11 Pages 865—879
DOI https://doi.org/10.2147/DDDT.S124324
Checked for plagiarism Yes
Review by Single anonymous peer review
Peer reviewer comments 3
Editor who approved publication: Prof. Dr. Georgios Panos
Imaobong Christopher Etti,1,2 Abdullah Rasedee,3 Najihah Mohd Hashim,4 Ahmad Bustamam Abdul,5 Arifah Kadir,6 Swee Keong Yeap,7 Peter Waziri,5 Ibrahim Malami,5 Kian Lam Lim,8 Christopher J Etti9
1Pharmacology and Toxicology, Faculty of Veterinary Medicine, Universiti Putra Malaysia, Serdang, Malaysia; 2Department of Pharmacology and Toxicology, University of Uyo, Uyo, Nigeria; 3Department of Veterinary Pathology and Microbiology, Faculty of Veterinary Medicine, Universiti Putra Malaysia, Serdang, Malaysia; 4Department of Pharmacy, Faculty of Medicine, University of Malaya, Kuala Lumpur, Malaysia; 5MAKNA-Cancer Research Laboratory, Institute of Bioscience, Universiti Putra Malaysia, Serdang, Malaysia; 6Department of Veterinary Preclinical Science, Universiti Putra Malaysia, Serdang, Malaysia; 7Laboratory of Vaccine and Immunotherapeutics, Institute of Bioscience, Universiti Putra Malaysia, Serdang, Malaysia; 8Faculty of Medicine and Health Sciences, Universiti Tunku Abdul Rahman, Cheras, Selangor, Malaysia; 9Department of Agricultural and Food Engineering, University of Uyo, Uyo, Nigeria
Abstract: Artonin E is a prenylated flavonoid compound isolated from the stem bark of Artocarpus elasticus. This phytochemical has been previously reported to be drug-like with full compliance to Lipinski’s rule of five and good physicochemical properties when compared with 95% of orally available drugs. It has also been shown to possess unique medicinal properties that can be utilized in view of alleviating most human disease conditions. In this study, we investigated the cytotoxic mechanism of Artonin E in MCF-7 breast cancer cells, which has so far not been reported. In this context, Artonin E significantly suppressed the breast cancer cell’s viability while inducing apoptosis in a dose-dependent manner. This apoptosis induction was caspase dependent, and it is mediated mainly through the intrinsic pathway with the elevation of total reactive oxygen species. Gene and protein expression studies revealed significant upregulation of cytochrome c, Bax, caspases 7 and 9, and p21 in Artonin E-treated MCF-7 cells, while MAPK and cyclin D were downregulated. Livin, a member of the inhibitors of apoptosis, whose upregulation has been noted to precede chemotherapeutic resistance and apoptosis evasion was remarkably repressed. In all, Artonin E stood high as a potential agent in the treatment of breast cancer.
Keywords: Artonin E, breast cancer, apoptosis, cell cycle, livin
Introduction
Breast cancer has been the major cause of cancer-related death among women worldwide.1 This disease is complex and heterogenous, bringing an untold burden to the world at large. The development of molecular profiling using DNA microarrays, gene expression profiling, and immunohistochemical analysis classifies breast cancers into five subtypes: luminal A, luminal B, HER2, basal-like breast cancer, and normal-like breast cancer2 with each subtype having a different prognosis and treatment response. The luminal types are estrogen receptor-positive breast cancers with two subtypes, which are human estrogen receptors α and β. The estrogen receptor α has been implicated in ~70% of all breast cancer cases.3 In spite of several research done in this area with the view of lessening the burden of breast cancer, its survivability is generally low and existing therapies are frequently being overcome by resistance. This frailty incited the search into nature for a potential anti-breast cancer agent, which can abrogate the unique hallmarks of these cancers.
Livin, a novel member of the human inhibitors of apoptosis protein family, has been reported to be crucial for tumor progression and even the poor prognosis for several types of malignancies.4 This protein closely correlates key hallmarks displayed by breast cancer: undue proliferation, evasion of apoptosis, and invasiveness. It is no doubt that the downregulation of this independent prognostic indicator for breast cancer, livin,5 will mitigate the burden of breast cancer.
In the past decades, >50% of the drugs approved by the US Food and Drug Agency were natural products.6 Artonin E is a prenylated flavonoid compound isolated from the stem bark of Artocarpus elasticus.7 It has been reported to possess a wide range of medicinal properties including the following: antibacterial, anticandicidal,8,9 antimalarial,10,11 and arachidonate 5-lipoxigenase inhibition.12 The compound has also been shown to induce anoikis in lung cancer and to cause dysregulation of the mitochondrial membrane of ovarian cancer cells.7,13 More recently, Artonin E was computationally shown to abrogate estrogen receptor signaling in breast cancer and was conferred with the potential of inhibiting breast cancer using an in silico approach,14 but the mechanism of the predicted anti-breast cancer inhibition of this compound has not been reported. Hence, this study is aimed at investigating the mechanism of breast cancer cell death induced by Artonin E in an estrogen receptor-positive breast cancer cell line, MCF-7, being the most abundant type in breast cancer cases in a clinical setting.3,15,16
Materials and methods
Preparation of Artonin E
The compound, Artonin E (Figure 1), was kindly given to us by Dr Najihah Mohd Hashim of the Department of Pharmacy, Faculty of Medicine, University of Malaya, Kuala Lumpur, Malaysia. It was extracted from A. elasticus as reported by Rahman et al.7 For the in vitro assays, Artonin E was dissolved in dimethyl sulfoxide, with the volume of dimethyl sulfoxide administered to the cells being <0.1%.
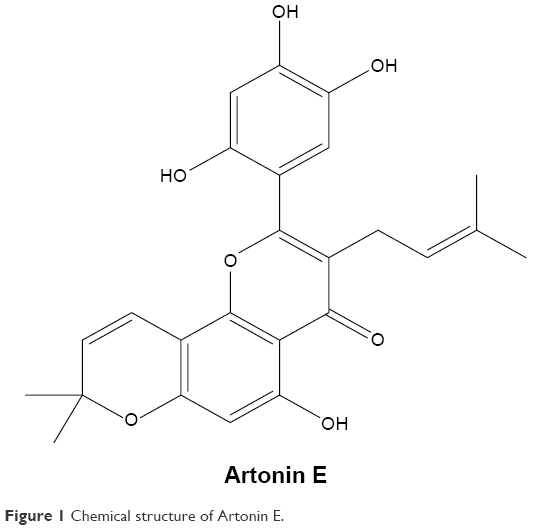 | Figure 1 Chemical structure of Artonin E. |
Cell culture
The cell culture and growth inhibition assay were performed as previously reported.14 Briefly, the MCF-7 cells were acquired from the American Type Culture Collection (Manassas, VA, USA) and grown in Roswell Park Memorial Institute medium-1640 supplemented with 10% FBS and 1% penicillin–streptomycin. The cell count for each of the assay was determined using the hemocytometer counting chamber (Marienfeld, Germany), and 0.5–1×10⁶ cells were subcultured into a fresh 25 cm2 tissue culture flask containing fresh medium (6 mL) at the subcultivation ratio of 1:4 while the cultures were incubated at 37°C under 5% CO2 and 95% air.
Morphological assessment of apoptotic cells using DNA fluorochrome
Acridine orange (AO) and propidium iodide (PI) double-staining assay were used to determine the effect of Artonin E in the induction of breast cancer cell death. A total of 3×10⁵ MCF-7 breast cancer cells were seeded in a six-well plate and allowed to adhere overnight before treatment with various concentrations of Artonin E (3, 10, and 30 μM) at various time points. After the incubation period, both the floating and adherent cells were collected and centrifuged at 2,000 rpm (Hettich Universal 32 R centrifuge; DJB Labcare Ltd, Interchange Park, Newport Pagnell, United Kingdom) for 5 minutes and the pellet was washed with ice-cold PBS, recentrifuged before resuspending in 20 μL of PBS. The cells were thereafter stained on ice with dyes (20 μL) containing 10 μg/mL AO and 10 μg/mL PI. Aliquots of cell suspension (20 μL) were examined under Carl Zeiss Axioskop plus-2 fluorescence microscope. At least 200 cells in each of three fields were immediately assessed for viability, early and late apoptosis, as well as necrosis.17 The experiment was done in triplicates.
Detection of apoptosis by Annexin V-FITC assay
The Annexin V-FITC assay was carried out using the Annexin V Kit (BD Pharmingen, San Diego, CA, USA). Briefly, after 24- and 48-h incubation of MCF-7 cells with Artonin E, both adherent and floating cells of treated and control samples were collected by centrifugation, washed with ice-cold PBS, and resuspended in 1× binding buffer before transferring to BD Falcon flow cytometry tubes. PI solution (5 μL) and annexin V-FITC conjugate (5 μL) were added to the cell, and the sample was gently mixed and incubated for 20 minutes at room temperature in the dark. The cells were finally subjected to flow cytometric analysis using laser emitting excitation light at 488 nm and a BD flow cytometer equipped with an Argon laser (Cyan ADP, DAKO, Glostrup, Denmark). These data were analyzed using the Summit V4.3 software.
Caspases 8 and 9 Fluorimetric Assays
The activity of caspases 8 and 9 in the breast cancer cells was determined using a Fluorimetric Assay Kit (R&D System) based on spectrophotometric detection. Briefly, 1×10⁶ of MCF-7 cells in media (6 mL) were seeded in a T25 flask. After attachment, the cells were incubated with 3, 10, and 30 μM of Artonin E for 24 h. The cells were thereafter trypsinized and collected by centrifugation at 2,500 rpm (Hettich Universal 32 R centrifuge; DJB Labcare Ltd) in a conical tube for 10 minutes. The cell pellet was lysed by the addition of cold lysis buffer (50 μL) containing 10 μg/mL aprotinin, 10 μg/mL leupeptin, and 10 μg/mL pepstatin. The protein in the cell was extracted and quantified using Pierce BCA Protein Assay Kit (Thermo Fisher Scientific, MA, USA). The protein (200 μg) in 50 μL solution from each of the samples was added to a 96-well flat black bottom microplate, followed by the addition of 2× reaction buffer 8 or 9 (50 μL), as appropriate, containing 10 μL dithiothreitol/mL reaction buffer. For each reaction well, 5 μL of either caspase 8 or 9 fluorogenic substrate (LEHD-AFC) was added, and the plate was incubated at 37°C for 2 h. Control wells were without treatment. Finally, the plate was read with a fluorescence microplate reader at an excitation of 400 nm and emission of 505 nm.
Measurement of total reactive oxygen species production
To evaluate the production of total reactive oxygen species (ROS), the ROS Assay Kit (eBioscience Inc., Affymetrix, San Diego, CA, USA) was utilized. Briefly, breast cancer cells at a density of 1×10⁶ per T25 flask were treated with 3, 10, and 30 μM Artonin E for 24 h and trypsinized and centrifuged at 2,000 rpm for 5 minutes. The cells were resuspended in PBS and incubated in ROS (100 μL) assay stain in buffer solution at 37°C for 60 minutes before the flow cytometric analysis.
Cell cycle regulation by Artonin E
The flow cytometric cell cycle analysis was performed to investigate the breast cancer cell cycle regulation induced upon Artonin E treatment. The cells were seeded in a T25 tissue culture flask at a density of 1×10⁶/flask and allowed to stand overnight in the incubator for attachment prior to treatment with 3, 10, and 30 μM Artonin E for 12 and 24 h. Treated cells were trypsinized, collected, and centrifuged at 3,000 rpm for 5 minutes. The supernatant was discarded, and the cells were washed twice with buffer (1 mL) consisting of sodium citrate, sucrose, and DMSO. For the staining procedure, the cell suspension was transferred into a flow cytometry tube, and solution A (250 μL trypsin buffer) was added to each tube, mixed gently, and allowed to react for 10 minutes at room temperature. Solution B, consisting of trypsin inhibitor and RNase buffer, was thereafter added, gently mixed, and allowed to react for 10-minutes incubation. Ice-cold solution C (200 μL) comprising PI was then added to the tube, mixed, and incubated for 10 minutes on ice in the dark. The stained samples containing 1×10⁶ cells were analyzed by flow cytometry using FACSCalibur flow cytometer (Becton Dickson, USA), and CellQuest Pro software was used to determine the cell cycle distribution.
Multiplex mRNA expression analysis using GeXP analysis system RNA isolation
A 3-mL suspension containing 3×10⁵ MCF-7 breast cancer cells was seeded in each well of a six-well plate, treated with 10 μM of Artonin E and subjected to RNA extraction using the RNA isolation kit according to the manufacturer’s manual. Following the RNA extraction, the purity and concentration of the isolated RNA were ascertained using a nanospectrophotometer (Beckman Coulter, Inc., USA).
Reverse transcription and polymerase chain reaction
Sample preparation was done in accordance with the procedure described by GenomeLab GeXP Start Kit (Beckman Coulter, Inc.). The concentrations of RNA were normalized to 100 ng/μL using RNase-free water. One microliter of the reverse primer (Table 1) for each gene in RNase-free water (5.5 μL), reverse transcription buffer (2 μL), reverse transcriptase (0.5 μL), 100 ng/μL sample (0.5 μL), and internal control (0.5 μL) was mixed. The reverse transcription reaction was set to run for 1 minute at 48°C, 60 minutes at 42°C, and 5 minutes at 95°C. The cDNA produced in the above reverse transcription reaction was amplified in a PCR reaction consisting of 5× PCR buffer (2 mL), magnesium chloride (2 μL), forward primers mixture (1 μL; Table 1), Taq polymerase (0.35 μL), and cDNA (4.65 μL). The reaction was run on an XP Thermal Cycler (Bioer Technology) with an initial denaturation at 95°C for 10 minutes, followed by two-step cycles of 94°C for 30 s, primer annealing at 55°C for 30 s, and ending with a single-extension cycle at 68°C for 1 minute.
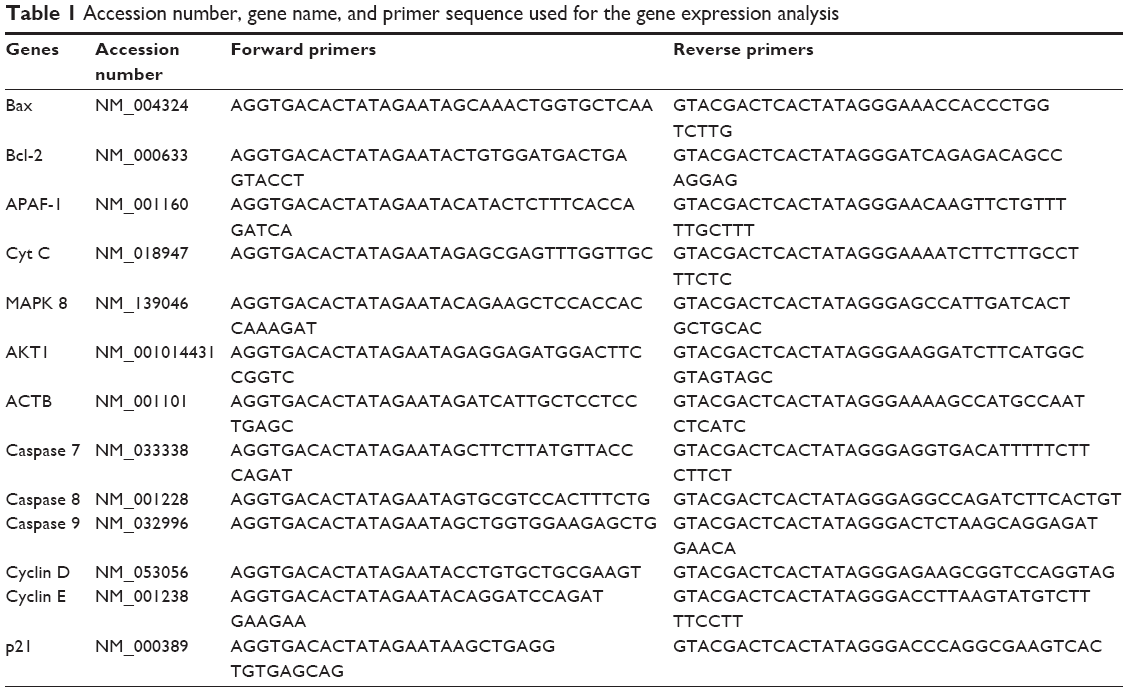 | Table 1 Accession number, gene name, and primer sequence used for the gene expression analysis |
Separation by GeXP genetic analysis system
The PCR products were separated by capillary gel electrophoresis and analyzed using the GeXP machine (Beckman Coulter, Inc.). Briefly, each PCR product (1 μL) was mixed with sample loading solution (38.5 μL) and DNA size standard 400 (0.5 μL, GenomeLab GeXP Start Kit; Beckman Coulter, Inc.), and the mixture in the 96-well sample plate was overlaid with mineral oil before loading onto the machine.
Fragmentation analysis and express profiling analysis
The results were analyzed with the fragment analysis module of the GeXP system software and normalized with β-actin on the eXpress profiler software.
Proteome profiling of human apoptosis antibody array
To investigate the effects of Artonin E on the expression pattern of human apoptosis-related proteins, the proteome profiling was done (R&D Systems, USA). The proteins from treated and untreated MCF-7 breast cancer cells were harvested and quantified using the BCA Pierce Protein Qualification Kit. The membranes were first blocked in the array buffer 1 in a four-well multi-dish array with 1 h of incubation on a rocking platform shaker. At the same time, 200 μg of proteins from each sample was incubated in array buffer 1 at room temperature for 60 minutes. After blocking the membranes, the array buffer 1 was aspirated and the prepared protein samples were added and incubated with the membrane at 4°C overnight on a rocking platform shaker. On the following day, each array was carefully removed and washed thrice with 1× washing buffer on a rocking platform. For each of the arrays, the reconstituted biotinylated detection antibody cocktail (15 μL) which was diluted to 1.5 mL with 1× array buffer 2 and 3 mixture was used to incubate each array for 1 h on a rocking platform. Thereafter, the arrays were again washed thrice with 1× array buffer. A 1:2,000 dilution of the streptavidin/horseradish peroxidase (HRP) in 1× array buffer 2/3 was used to incubate each of the membrane for 30 minutes on a rocking platform shaker. Following incubation, the arrays were washed thrice with 1× wash buffer. Finally, the membranes were carefully removed and placed in a sheet protector. These membranes were layered with evenly mixed chemiluminiscence reagent (1 mL) and incubated for 1 minute before viewing them with the ChemiDoc XRS (Bio-Rad, USA) and the dot intensities quantified with the Image Lab software (BioTechniques, NY, USA).
Western blotting
Total protein lysates were obtained by lysing both the Artonin E-treated and Artonin E-untreated cells with RIPA buffer supplemented with phosphatase inhibitor cocktail (Sigma-Aldrich, St Louis, MO, USA). The protein content was then measured using Pierce BCA Protein Assay Kit by Microplate Assay (Universal Microplate reader; BioTek Instruments, Inc., Winooski, VT, USA). Then, 20 μg of each sample was subjected to a 10% sodium dodecyl sulfate polyacrylamide gel electrophoresis gel. The proteins were then transferred to a PVDF membrane (Roche, Laval, Canada) using the Pierce Fast Semi-Dry Blotter (Thermo Scientific, Rockford, lL 61105 USA). Afterward, the membrane was blocked with 5% nonfat milk in 1× PBST for 1 h with agitation on a Belly Dancer® (Stovall Life Science, Inc., Waltham MA, USA). The membranes were then washed thrice in TBST and incubated overnight at 4°C with the respective specific primary antibody to subunit Bcl-2, Bax, p21, and p53 (Thermoscientific, Rockford, IL, USA) at 1:1,000 dilution in TBST with constant agitation. On the following day, the membrane was washed thrice in TBST with agitation and incubated with goat–anti-mouse IgG conjugated to HRP at 1:5,000 in TBST for 1 h with constant agitation followed by three washes using TBST. Finally, the immunoreacted protein bands were developed and detected using a chemiluminescence blotting substrate kit (ECL Western blot substrate; Abcam plc, Cambridge, England). A chemiluminescence image analyzer system (Chemi-Smart; Vilber Lourmat, Germany) was used to view the membranes and the intensities of band quantified with the Image Lab software (BioTechniques, New York, USA).
Statistical analysis
All experiments were done in triplicates, and the average values are presented as mean ± standard deviation. Data analysis was performed using GraphPad Prism 5.0 software (GraphPad Software Inc., La Jolla, CA, USA). One-way analysis of variance was performed, followed by Tukey’s post hoc test.
Results
Artonin E suppresses cell viability and induces apoptosis in MCF-7 cells
We previously reported the half-maximal growth inhibitory concentration (IC50) of Artonin E-treated (Figure 1) MCF-7 cells at 24, 48, and 72 h as 3.8, 5.1, and 6.9 μM, respectively.14 For subsequent in vitro analysis, concentrations of 3, 10, and 30 μM were chosen. Results of the AO/PI double-staining revealed the morphological features of apoptosis evident in Artonin E-treated MCF-7 cells in comparison to the untreated control cells. These features that included membrane blebbing, chromatin condensation, and nuclear fragmentation were enhanced as the concentration of Artonin E increased (Figure 2).
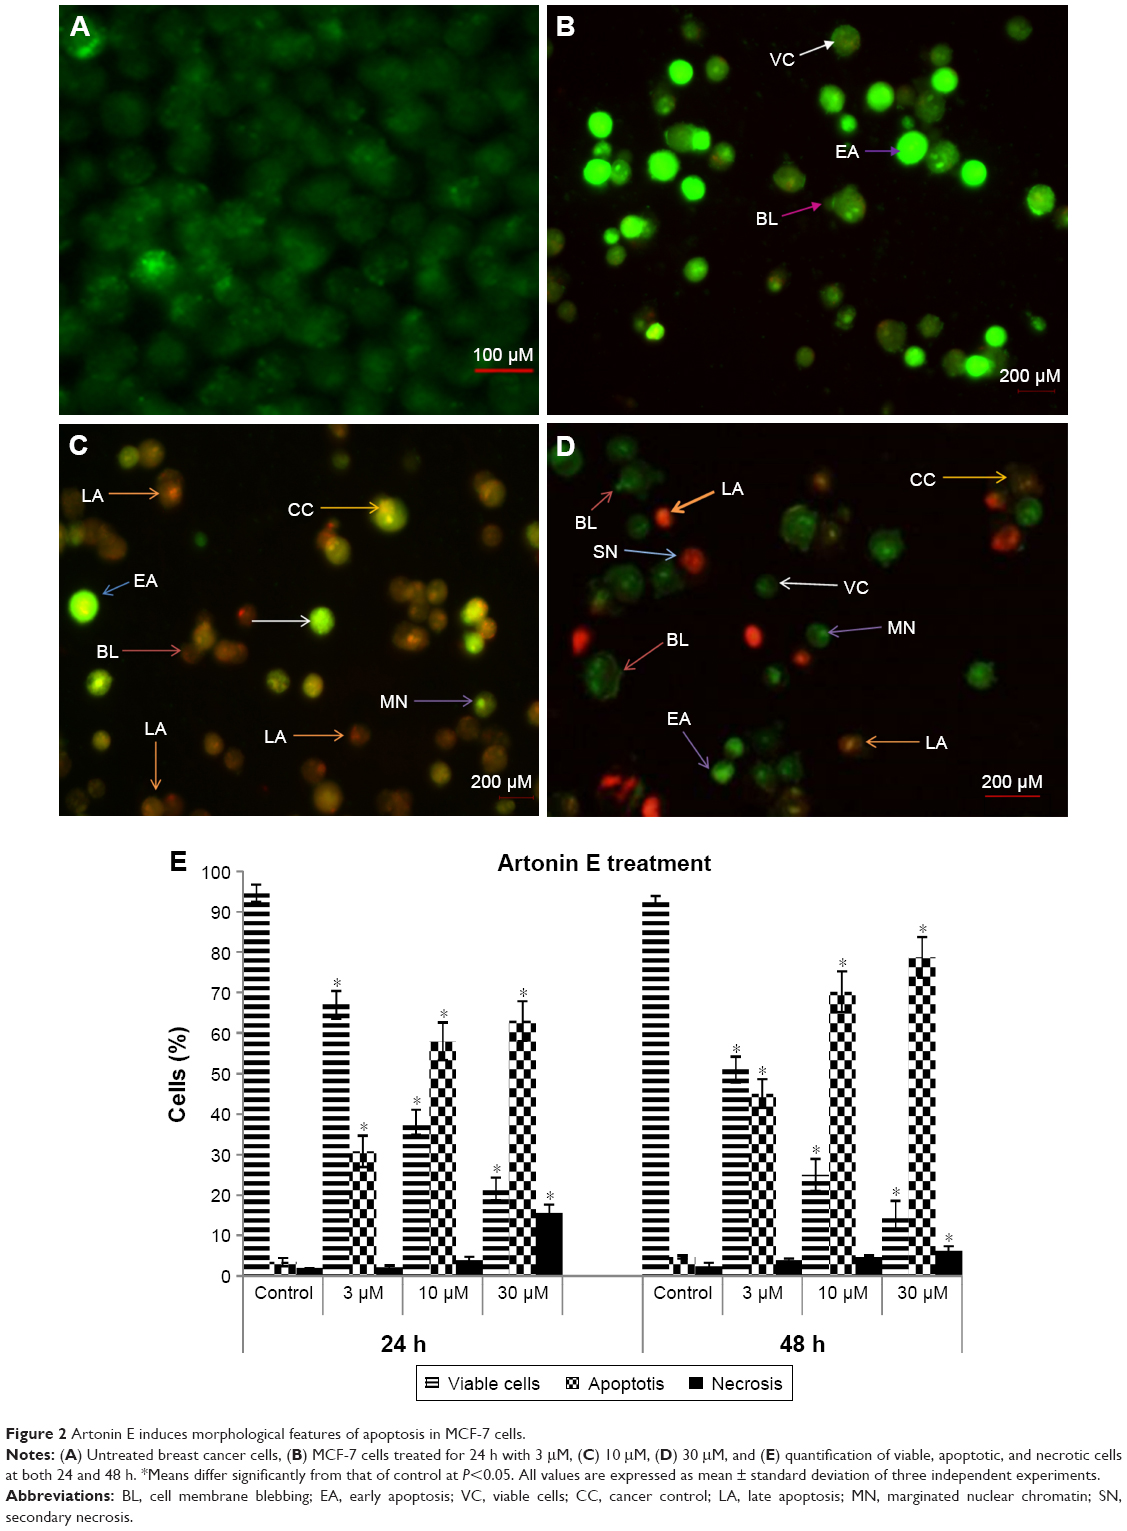 | Figure 2 Artonin E induces morphological features of apoptosis in MCF-7 cells. |
The Artonin E treatment caused significant (P<0.05) loss in MCF-7 cell viability (Figure 2). The percentage of viable MCF-7 cells decreased from 94.5% in the control group to 67%, 38%, and 21.5% after treatment with 3, 10, and 30 μM Artonin E, respectively. The proportion of necrotic MCF-7 cells was only significantly (P<0.05) higher than control cells after treatment with 30 μM Artonin E. The proportion of MCF-7 cells that went into the apoptotic phase was most significant (P<0.05) at all concentrations of Artonin E used in this study. The effect was greater at 48-h treatment when compared with 24-h treatment.
During apoptosis, when the integrity of the cell’s plasma membrane is lost,18 the phospholipid phosphatidylserine flips to the extracellular environment and was detected in this study using the Annexin V-FITC staining. From the results, after 24 h of treatment, the viability of MCF-7 cells was significantly (P<0.05) lower at 81.27%, 36.33%, and 12.06% with 3, 10, and 30 μM Artonin E treatment, respectively, in comparison to the control cells which showed 97.78% viability during the same time period (Figure 3). This effect was observed to be dose and time dependent.
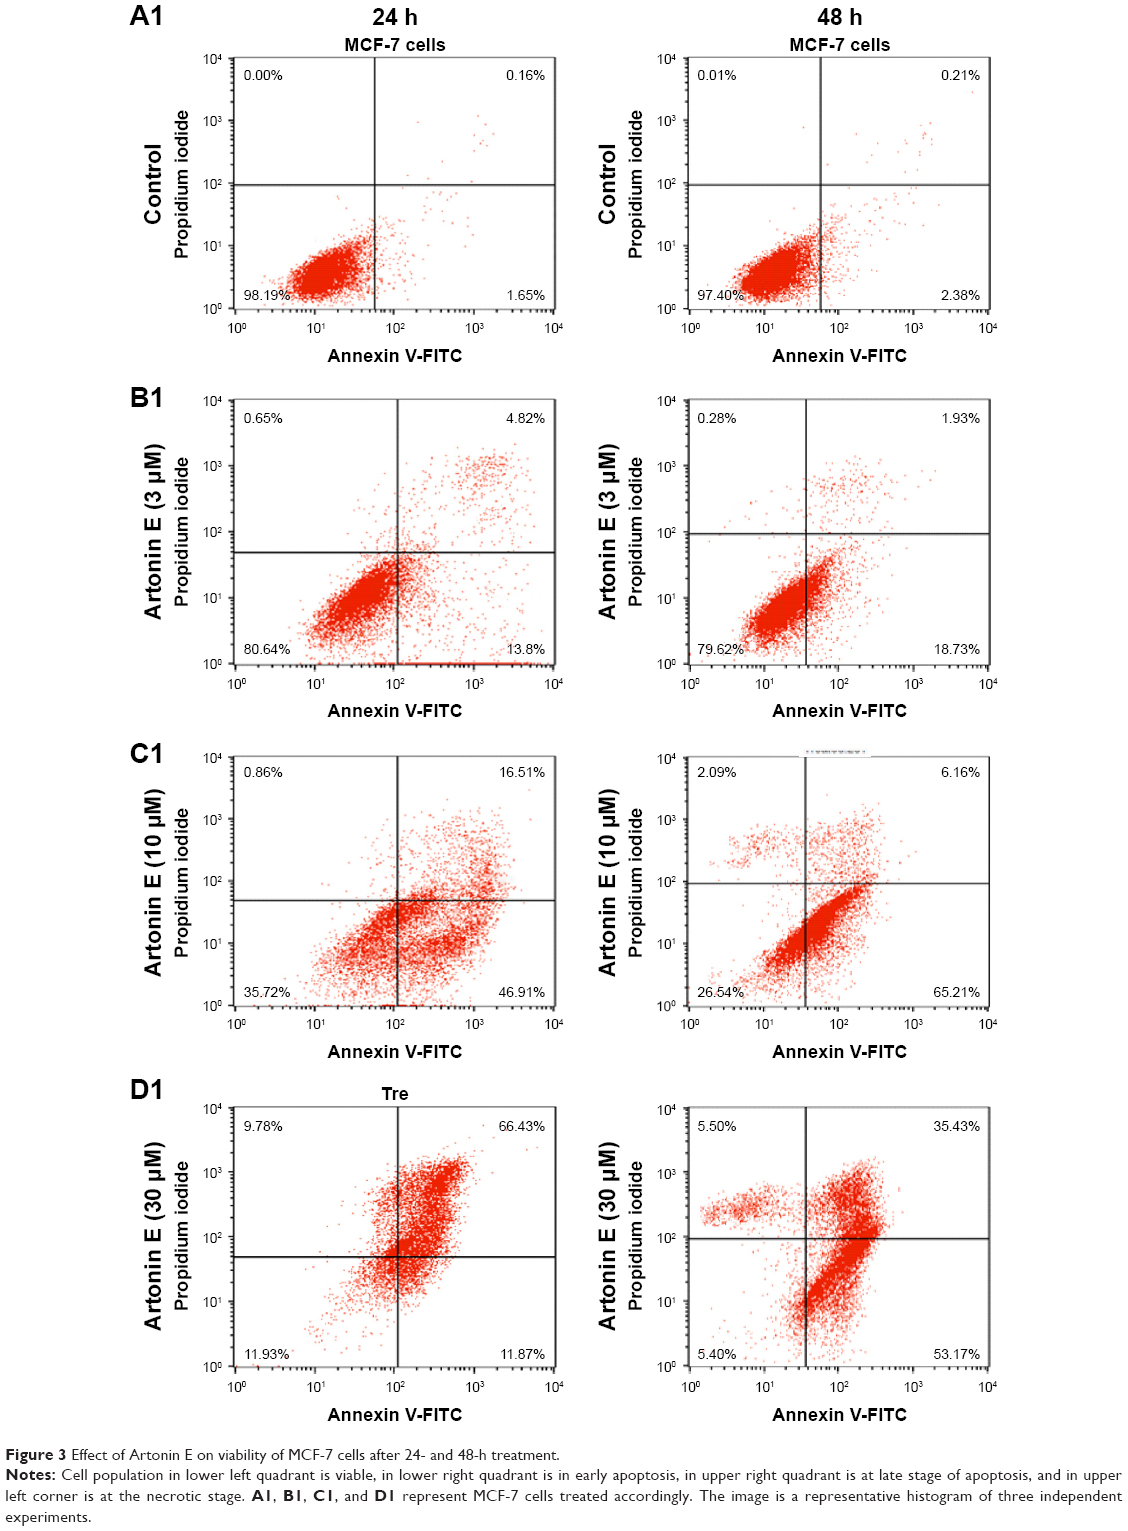 | Figure 3 Effect of Artonin E on viability of MCF-7 cells after 24- and 48-h treatment. |
Artonin E induces apoptosis in a caspase-dependent manner and enhances the intracellular level of ROS
Caspases are key players of apoptosis. Caspases 8 and 9 are initiators of the extrinsic and intrinsic pathways, respectively. After treating MCF-7 cells with Artonin E, the activity of caspase 9 increased significantly (P<0.05) and dose dependently. The activity of caspase 8 was observed to be unchanged at concentrations of 3 and 10 μM. However, it only increased significantly (P<0.05) at 30 μM (Figure 4).
 | Figure 4 Caspase activity in Artonin E-treated MCF-7 cells after 24-h incubation with different concentrations of Artonin E. The experiment was done in triplicate and the data are expressed as mean ± standard deviation, *P<0.05. |
After 24 h of treatment, the level of total ROS also increased in comparison to the untreated control in a dose-dependent manner (Figure 5). Upon increasing the concentration of Artonin E to 10 and 30 μM, the production of total ROS increased from 17.7% in the untreated control group to 47.80% and 66.26%, respectively.
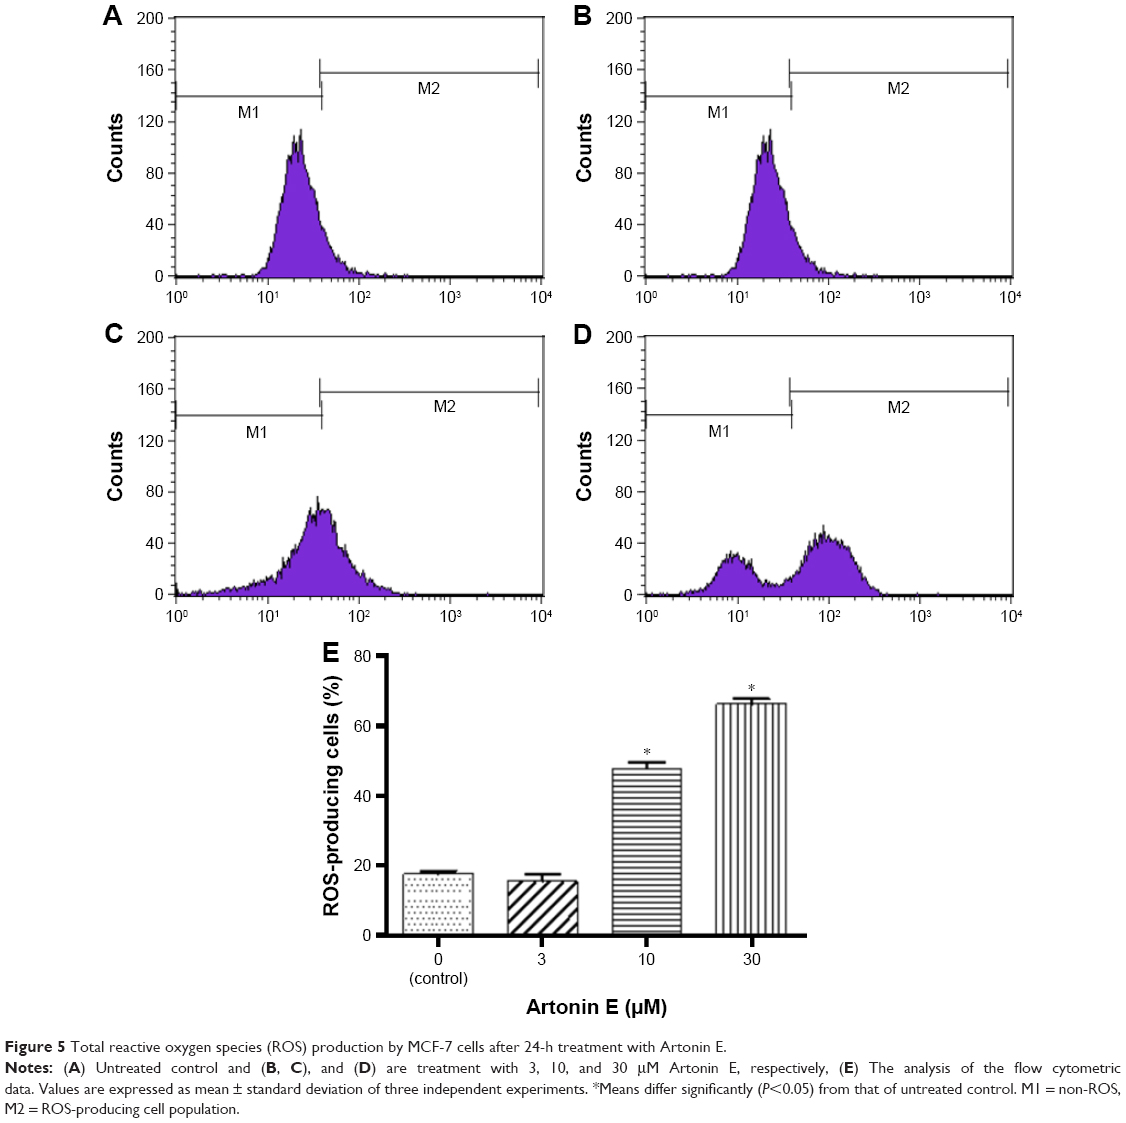 | Figure 5 Total reactive oxygen species (ROS) production by MCF-7 cells after 24-h treatment with Artonin E. |
Artonin E arrests breast cancer cell cycle
After incubation of MCF-7 cells with Artonin E, there was a significant (P<0.05) increase in the percentage of cells in the G0/G1 phase from 57.6% in the control cells to 60.8% and 68.7% after treatment with 3 and 10 μM Artonin E, respectively. However, there was no significant increase (P>0.05) at a concentration of 30 μM (Figure 6). A dose-dependent increase was observed in population of cells in the sub-G0/G1 phase when the exposure time was increased to 48 hours (Figure 7).
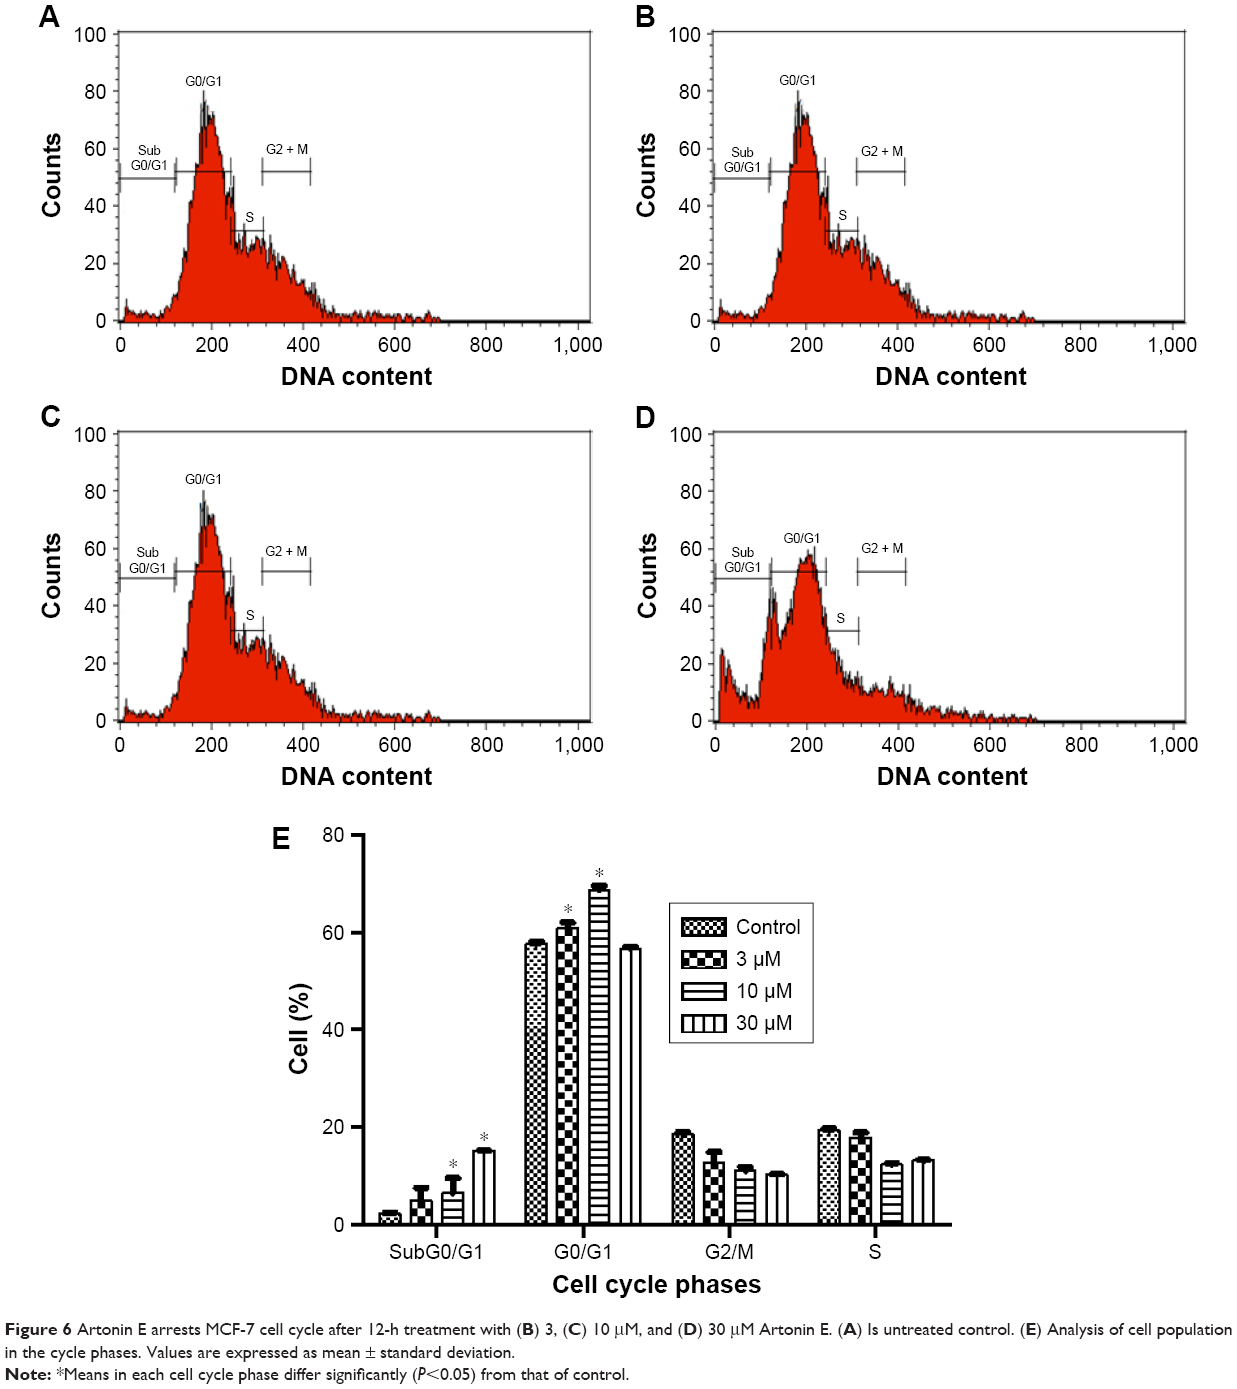 | Figure 6 Artonin E arrests MCF-7 cell cycle after 12-h treatment with (B) 3, (C) 10 μM, and (D) 30 μM Artonin E. (A) Is untreated control. (E) Analysis of cell population in the cycle phases. Values are expressed as mean ± standard deviation. |
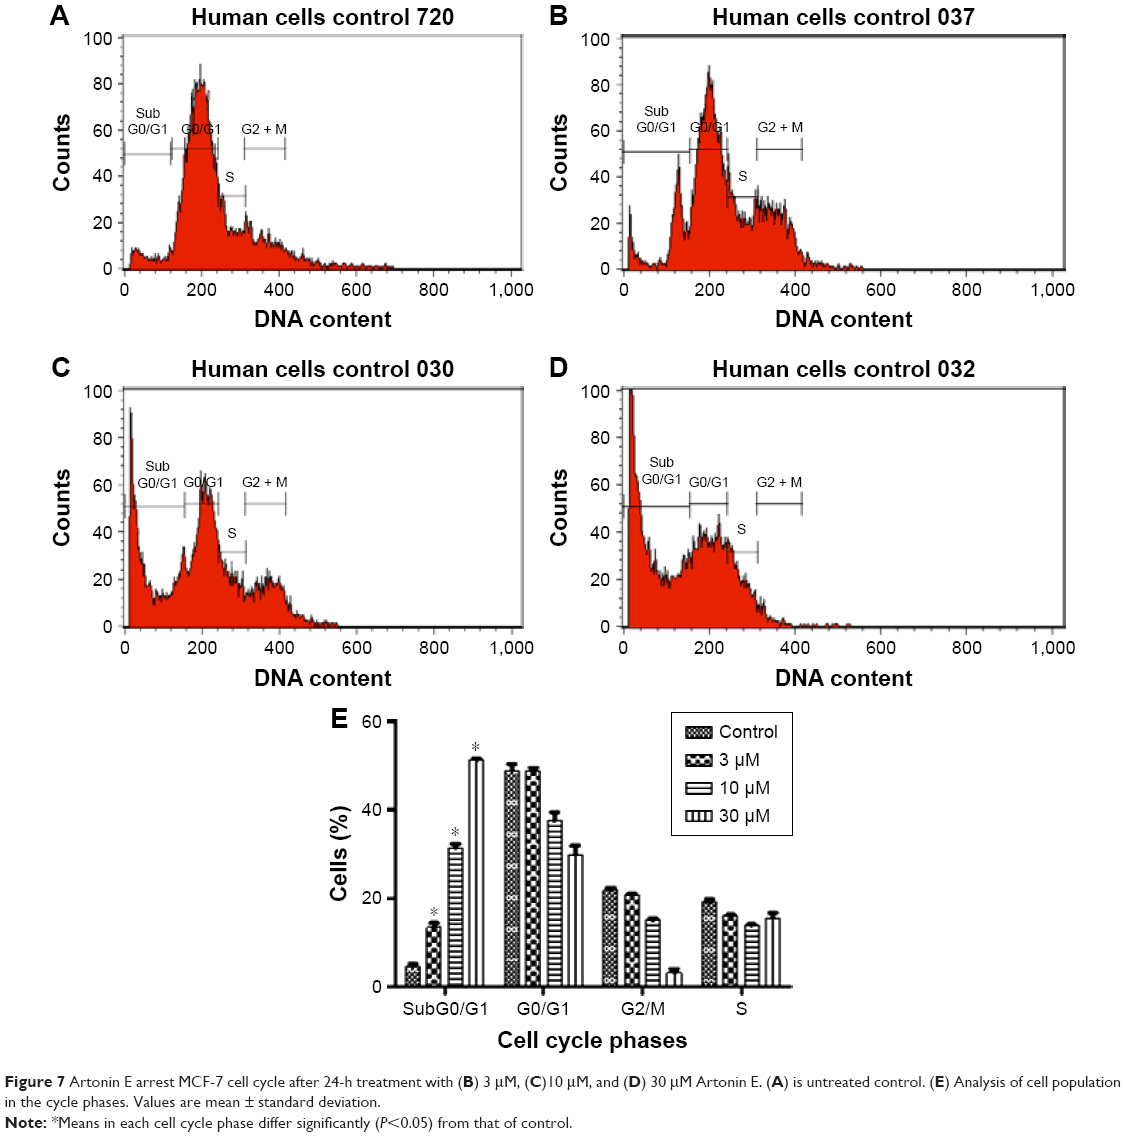 | Figure 7 Artonin E arrest MCF-7 cell cycle after 24-h treatment with (B) 3 μM, (C)10 μM, and (D) 30 μM Artonin E. (A) is untreated control. (E) Analysis of cell population in the cycle phases. Values are mean ± standard deviation. |
Artonin E alters the expression of apoptosis and cell cycle-related genes
The alteration in the expression of apoptosis- and cell cycle-related genes was determined at the mRNA level. The results showed that the expression of cytochrome c, Bax, caspases 7 and 9, and p21 genes were significantly (P<0.05) upregulated in Artonin E-treated MCF-7 cells, while MAPK and cyclin D were significantly downregulated (Table 2).
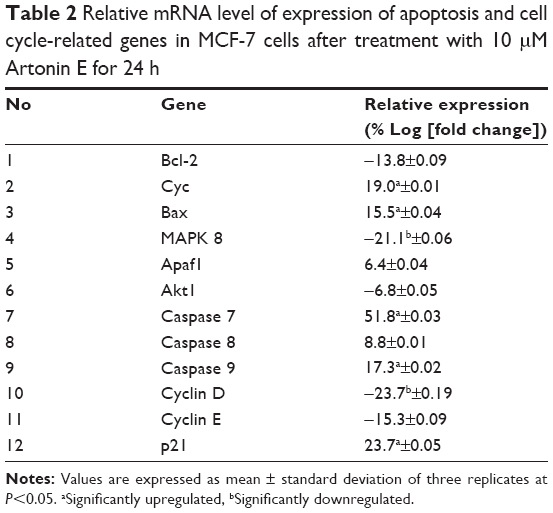 | Table 2 Relative mRNA level of expression of apoptosis and cell cycle-related genes in MCF-7 cells after treatment with 10 μM Artonin E for 24 h |
Artonin E regulates the expression of apoptosis-related proteins in breast cancer cells
Artonin E downregulated the expression of paraoxygenase genes (PON2), Bcl-x, xIAP (x-linked inhibitor of apoptosis), Bad, and Bcl-2 (Table 3). Survivin, the smallest member of the inhibitor of apoptosis protein family, was also downregulated as well as livin and heat shock protein 27. An upregulation of heat shock proteins 60 and 70 as well as the cell cycle regulatory protein p21 was also observed. Western blot analysis also revealed the upregulation of Bax, p21 with a corresponding downregulation of livin, an inhibitor of apoptosis (Figure 8).
 | Table 3 Apoptosis pathway-related protein expression in Artonin E-treated MCF-7 cells |
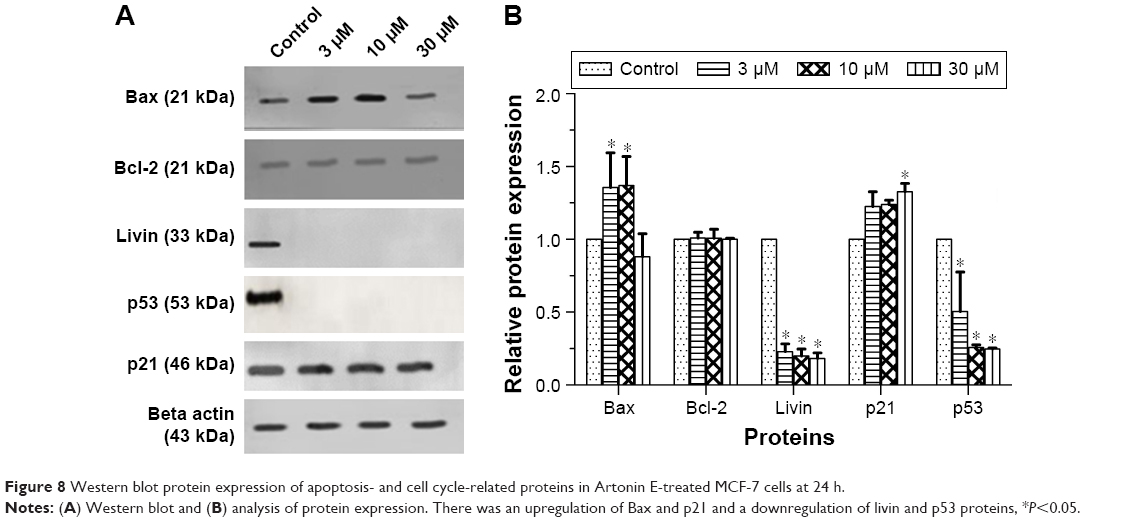 | Figure 8 Western blot protein expression of apoptosis- and cell cycle-related proteins in Artonin E-treated MCF-7 cells at 24 h. |
Discussion
Breast cancer is still a threat to the female population and a burden to the world at large. Among all breast cancers, the estrogen receptor-positive breast cancer has been implicated in ~70% of the reported cases.3,15,16 Hence, the need for compounds that can inhibit the replicative immortality of this cancer. One of the hallmarks of cancer cells is its ability to evade apoptosis while proliferating uncontrollably.19 Hence, apoptosis in cancer cells is vital and highly sought, making it of great essence to investigate the apoptotic signaling pathways targeted by any potential anti-cancer agent.20 In this study, Artonin E was investigated for its molecular mechanism of apoptosis induction in MCF-7 breast cancer cells.
From the results, Artonin E-treated MCF-7 breast cancer cells displayed characteristic features of apoptosis,21,22 including the following: cell shrinkage, membrane alteration, DNA fragmentation, and nuclear condensation in a dose-dependent manner. These morphological characteristics of the breast cancer cells revealed the involvement of apoptosis. Upon quantification, the percentage of viability decreased significantly (P<0.05) with a corresponding increase in the percentage of cells undergoing early and late apoptosis. The loss of membrane asymmetry, which is evident during apoptosis, always leads to the externalization of phosphatidylserine.23 In this study, Annexin V FITC and DNA-binding fluorochrome PI were utilized to further strengthen the assessment of the apoptotic mode of cell death and to examine the progression of apoptotic cells.24,25 Here, Artonin E was seen to significantly reduce the viability of MCF-7 cells while increasing its rate of apoptosis in a concentration-dependent manner. The percentage of cells undergoing apoptosis after Artonin E treatment was greater than MCF-7 cells undergoing apoptosis after treatment with Tamoxifen, a standard agent as previously reported by Subramani et al.26
Caspases are the major players in the execution of apoptosis and are critical in the apoptosis signaling pathway. There are two pathways of apoptosis initiated via either the mitochondria or the cell surface receptors. These pathways of apoptosis can be recognized and distinguished by the initiator caspases.27 To begin the investigation into the apoptosis signaling pathway mediated by Artonin E, the activities of caspases 8 and 9 which are initiators of the extrinsic and intrinsic pathways, respectively, were investigated.28 From the results, Artonin E at all concentrations, stimulated the activity of caspase 9 dose dependently in MCF-7 cells, but not the activity of caspase 8 except at a concentration of 30 μM. This confirmed that Artonin E predominantly initiated apoptosis in MCF-7 via the intrinsic pathway. The mitochondria is a major source of ROS in cells, and these chemicals regulate cell viability or mortality.29,30 Although oxygen metabolism is central to life, beyond the cellular antioxidant capacity, it has been reported to damage macromolecular structures and to induce apoptosis of cancer cells.17,31,32 In this study, ROS production in Artonin E-treated MCF-7 cells was significantly (P<0.05) enhanced. The level of ROS escalated from 17.7% in the untreated control cells to 47.80% and 66.26% in cells treated with 10 and 30 μM Artonin E, respectively, at 24 h. This upregulation of ROS indicated that one of the mechanisms of the apoptotic cell death induced by Artonin E treatment is via oxidative insult, an observation similar to that of Moungjaroen et al.33,34
Deregulation of cell cycle control has been evidently implicated in cancers.35,36 This is often mediated by alterations in the activities of cyclin-dependent kinases that result in proliferation and chromosomal instability. Targeting the cell cycle and discovering inhibitors of the cyclin-dependent kinases are beneficial strategies in drug discovery.37 In this study, the growth of MCF-7 cells was transiently arrested in the G0/G1 phase of the cell cycle upon treatment with 3 and 10 μM Artonin E. This G0/G1 arrest was attributed to the upregulation of p21 that led to the downregulation of cyclin D as evident by the gene expression studies. To elucidate the molecular basis of the apoptotic signaling pathways in Artonin E-treated cancer cells, the gene and protein expressions were investigated. From the results, the mRNA expression of cytochrome C, Bax, caspases 7 and 9, and p21 were significantly upregulated in comparison to the control when treating MCF-7 cells with 10 μM Artonin E for 24 h. A concomitant and significant downregulation of cyclin D and MAPK 8 was also observed. The upregulation of cytochrome C, Bax, and caspases 7 and 9 are further evidences that Artonin E induced apoptosis in MCF-7 cells via the mitochondrial pathway. Consistent with the induction of the intrinsic pathway, it is postulated that the oxidative insult prompted by Artonin E greatly compromised the mitochondrial membrane integrity of the estrogen receptor-positive breast cancer cells, leading to the activation and release of cytochrome c (Figure 9). There was also an elevated expression of Bax, which can also directly affect the polarity of the mitochondrial membrane, compounding the rate of the release of cytochrome c by the mitochondria.38 The consequence of these effects of Artonin E was apoptotic MCF-7 cell death.39,40 Artonin E was also observed to significantly inhibit the expression of antiapoptotic proteins and inhibitors of apoptosis. Utilizing the human apoptosis proteome profiling, Artonin E-treated MCF-7 cells showed downregulation of Bcl-x, PON2, xIAP, survivin, and Hsp 27, all being inhibitors of apoptosis. These antiapoptotic proteins had been reported to be overexpressed in tumors and, by doing so, cancer cells could develop resistance to chemotherapy while evading death.41 The observed downregulation of Hsp 27 was similar to the report of Ma et al,42 in which the knockout of Hsp 27 gene resulted in caspases 3 and 7 cleavage that eventually sensitized breast cancer cells to undergo apoptosis after chemotherapeutic treatment. In another study, short-term silencing of Hsp 27 augmented proteasome activity, abrogated metastatic potential, and induced regression of established breast tumors.43 These observations showed that by downregulating Hsp 27 with Artonin E, the MCF-7 cells had greater tendency to undergo apoptosis.
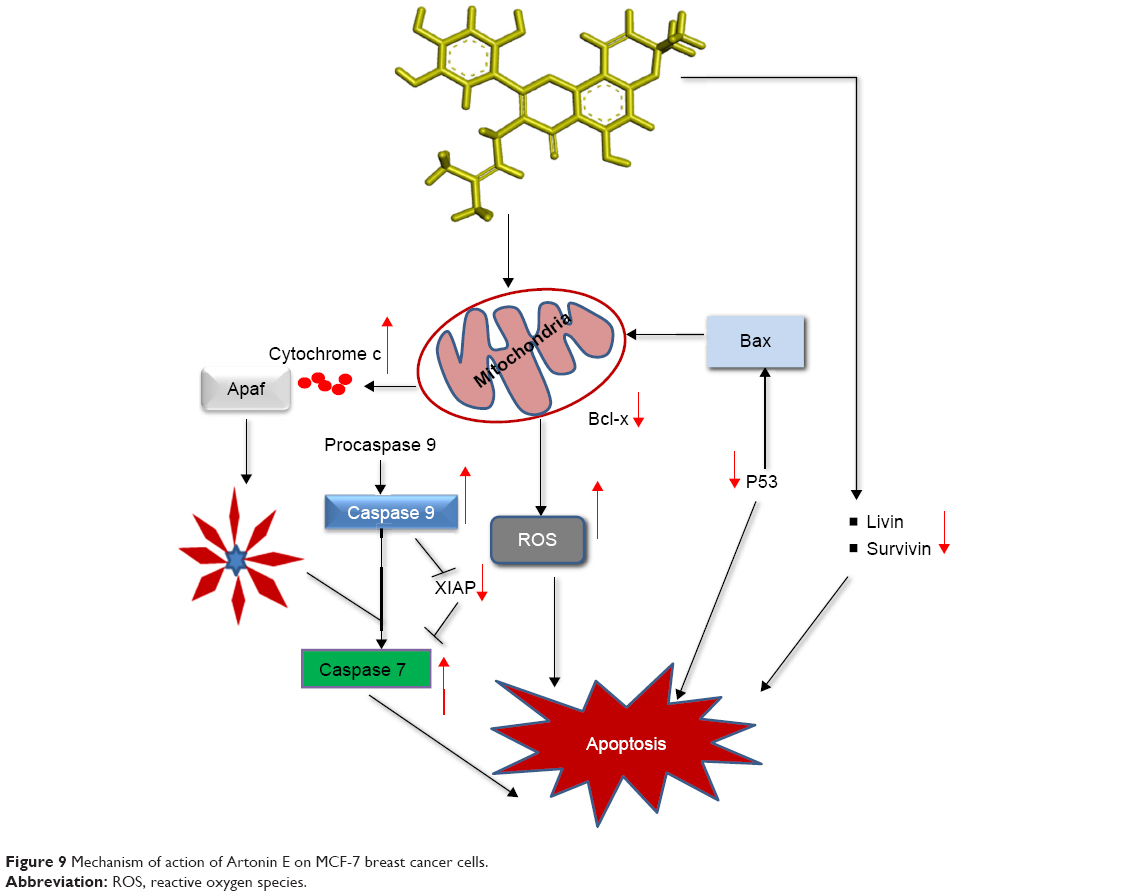 | Figure 9 Mechanism of action of Artonin E on MCF-7 breast cancer cells. |
Surprisingly, p53 protein expression was observed to be suppressed after treatment with Artonin E. Although most of the cancers harboring wild-type p53 do not have normal p53 function,44 it is possible that other intrinsic molecular alteration had played a role. A similar observation was reported by Wu et al,45 in which a specific downregulation of p53 in MCF-7 led to apoptosis when Smad4, a unique marker in breast cancer and an important suppressor gene in tumorigenesis, was elevated. Hence, it is highly probable that Smad4 is also involved in the apoptosis of Artonin E-treated breast cancer cells and is, therefore, recommended for further studies. Livin, a novel member of apoptosis which has been reported as a marker of breast cancer progression and invasiveness,4,5 was observed to be significantly (P<0.05) repressed after treatment with Artonin E. We propose that this repression of livin might have been responsible for the downregulation of MAPK observed in the gene expression pathway. This downregulation of livin is responsible for the antiproliferative effect displayed by Artonin E. In an earlier experiment reported by Ou et al,4 knockdown of livin was shown to inhibit proliferation and invasiveness of cancer cells. Artonin E inhibition of livin had played a crucial role in the inhibition and apoptosis induction of the estrogen receptor-positive breast cancer.
Conclusion
Breast cancer is indeed a threat to human existence, especially to the female population. Emergence of resistance to existing therapies without a corresponding reduction in the intriguing havoc of estrogen receptor-positive breast cancer cells, encourage more research into finding potential agents for breast cancer. In this regard, Artonin E was evaluated for its mechanism of apoptosis in MCF-7 cells. The mode of cell death induced by Artonin E was primarily apoptosis with the breast cancer cells also showing cell morphology and DNA fragmentation typical of apoptosis along with quantitative evaluation of apoptotic stages shown with Annexin V-FITC stain. The antibreast cancer effect of Artonin E was dependent on concentration and time. Artonin E was also seen to regulate the cell cycle whose control is usually deregulated in cancers.35 A G0/G1 MCF-7 cell cycle arrest was induced independent of p53. This effect of Artonin E was in addition to its significant upregulation of pro-apoptotic proteins with the downregulation of inhibitors of apoptosis. Interestingly, Artonin E inhibited livin, which has been reported to promote invasiveness of breast cancer as well as being responsible for chemoresistance. In conclusion, this study showed that Artonin E inhibited breast cancer growth and proliferation through initiation of the intrinsic apoptotic pathway while suppressing the antiapoptotic mechanism, thus circumventing the relative immortality of cancer cells.46 Artonin E also seemed to have an additional effect of induction of cell cycle arrest, which is inhibitory to cancer growth. Interestingly, Artonin E-treated MCF-7 cells showed significant downregulation of livin expression while upregulating p21 expression. These effects may have increased the effectiveness of breast cancer inhibition by Artonin E. Thus, Artonin E has the potential to be developed into an anticancer agent.
Acknowledgments
This study was co-supported by TETFund Nigeria, Universiti Putra Malaysia and Ministry of Science, Technology and Innovation Malaysia (Vote No 5450742).
The authors gratefully acknowledge the costs of publication covered by the Research Management Centre at the Universiti Putra Malaysia and also thank Faiqah Ramli for the isolation of Artonin E.
Disclosure
The authors report no conflicts of interest in this work.
References
Siegel R, Naishadham D, Jemal A. Cancer statistics. CA Cancer J Clin. 2013;63(1):11–30. | ||
Perou CM, Sørlie T, Eisen MB, et al. Molecular portraits of human breast tumors. Nature. 2000;406(6797):747–752. | ||
Berger CE, Qian Y, Liu G, Chen H, Chen X. p53, a target of estrogen receptor (ER) α, modulates DNA damage-induced growth suppression in ER-positive breast cancer cells. J Biol Chem. 2012;287(36):30117–30127. | ||
Ou JM, Ye B, Qiu MK, et al. Knockdown of livin inhibits growth and invasion of gastric cancer cells through blockade of the MAPK pathway in vitro and in vivo. Int J Oncol. 2014;44(1):276–284. | ||
Li F, Yin X, Luo X, et al. Livin promotes progression of breast cancer through induction of epithelial-mesenchymal transition and activation of AKT signaling. Cell Signal. 2013;25(6):1413–1422. | ||
Kim J, Park EJ. Cytotoxic anticancer candidate from natural resources. Curr Med Chem Anticancer Agents. 2002;2(4):485–537. | ||
Rahman MA, Ramli F, Karimian H, et al. Artonin E induces apoptosis via mitochondrial dysregulation in SKOV-3 ovarian cancer Cells. Plos One. 2016;11(3):1–23. | ||
Ngadjui Bonaventure T, Wouking Arlette G, Dzoyem Jean P, et al. Antimicrobial activities of the methanol extract and compounds from Artocarpus communis (Moraceae). BMC Complement Preventive Med. 2011;11(1):42. | ||
Zajmi A, Hashim N, Noordin MI, et al. Ultrastructural study on the antibacterial activity of artonin E versus streptomycin against staphylococcus aureus strains. PLoS One. 2015;10(6):e0128157. | ||
Mustapa I, Hakim E, Juliawaty L, Syah Y, Achmad S. Prenylated Flavones from some Indonesian Artocarpus and their antimalarial properties. Int J Phytomed Relat Indus. 2010;2(2):157–160. | ||
Molina-Cruz A, DeJong RJ, Ortega C, et al. Some strains of plasmodium falciparum, a human malaria parasite, evade the complement-like system of anopheles gambiae mosquitoes. Proc Natl Acad Sci U S A. 2012;109(28):E1957–E1962. | ||
Reddy GR, Ueda N, Hada T, et al. A prenylflavone, artonin E, as arachidonate 5-lipoxygenase inhibitor. Biochem Pharmacol. 1991;41(1):115–118. | ||
Wongpankam E, Chunhacha P, Pongrakhananon V, Sritularak V, Chanvorachote P. Artonin E Mediates MCL1 down-regulation and sensitizes lung cancer cells to anoikis. Anticancer Res. 2012;32(12):5343–5351. | ||
Etti I, Abdullah R, Hashim N, et al. Artonin E and structural analogs from artocarpus species abrogates estrogen receptor signaling in breast cancer. Molecules. 2016;21(7):839. | ||
Bae SY, Kim S, Lee JH, et al. Poor prognosis of single hormone receptor-positive breast cancer: similar outcome as triple-negative breast cancer. BMC Cancer. 2015;15:138. | ||
Chang M. Tamoxifen Resistance in breast cancer. Biomol Ther (Seoul). 2012;20(3):256–267. | ||
Samie N, Muniandy S, Kanthimathi MS, Haerian BS, Raja Azudin RE. Novel piperazine core compound induces death in human liver cancer cells: possible pharmacological properties. Sci Rep. 2016;6:29056. | ||
Hengartner MO. The Biochemistry of apoptosis. Nature. 2000;407(6805):770–776. | ||
Hanahan D, Weinberg RA. The hallmarks of cancer. Cell. 2000;100(1):57–70. | ||
Fesik FW. Promoting apoptosis as a strategy for cancer drug discovery. Nat Rev Cancer. 2005;5(11):876–885. | ||
Carou M, Cruzans P, Maruri A, Stockert J, Lombardo D. Apoptosis in ovarian granulosa cells of cattle: morphological features and clearance by homologous phagocytosis. Acta Histochem. 2015;117(1):92–103. | ||
Gerl R, Vaux DL. Apoptosis in the development and treatment of cancer. Carcinogenesis. 2005;26(2):263–270. | ||
Fadeel B, Xue D. The ins and outs of phospholipid asymmetry in the plasma membrane: roles in health and disease. Crit Rev Biochem Mol Biol. 2009;44(5):264–277. | ||
Logue SE, Elgendy M, Martin SJ. Expression, purification and use of recombinant annexin V for the detection of apoptotic cells. Nat Protoc. 2009;4(9):1383–1395. | ||
Brauchle E, Thude S, Brucker SY, Schenke-Layland K. Cell death stages in single apoptotic and necrotic cells monitored by Raman microspectroscopy. Sci Rep. 2014;4:4698. | ||
Subramani T, Yeap SK, Ho WY, et al. Nordamnacanthal potentiates the cytotoxic effects of tamoxifen in human breast cancer cells. Oncol Lett. 2015;9(1):335–340. | ||
Mcilwain DR, Berger T, Mak TW. Caspase functions in cell death and disease. Cold Spring Harb Perspect Biol. 2016;24:1–29. | ||
Würstle M, Laussmann M, Rehm M. The central role of initiator caspase-9 in apoptosis signal transduction and the regulation of its activation and activity on the apoptosome. Exp Cell Res. 2012;318(11):1213–1220. | ||
Diehn M, Cho RW, Lobo NA, et al. Association of reactive oxygen species levels and radioresistance in cancer stem cells. Nature. 2009;458(7239):780–783. | ||
Circu ML, Aw TY. Reactive oxygen species, cellular redox systems, and apoptosis. Free Radic Biol Med. 2010;48(6):749–762. | ||
Ray PD, Huang B-W, Tsuji Y. Reactive oxygen species (ROS) homeostasis and redox regulation in cellular signaling. Cell Signal. 2012;24(5):981–990. | ||
Laurent A, Nicco C, Chéreau C, et al. Controlling tumor growth by modulating endogenous production of reactive oxygen species. Cancer Res. 2005;65(3):948–956. | ||
Moungjaroen J, Nimmannit U, Callery PS, et al. Reactive oxygen species mediate caspase activation and apoptosis induced by lipoic acid in human lung epithelial cancer cells through Bcl-2 down-regulation. J Pharmacol Exp Ther. 2006;319(3):1062–1069. | ||
Alexandre J, Batteux F, Nicco C, et al. Accumulation of hydrogen peroxide is an early and crucial step for paclitaxel-induced cancer cell death both in vitro and in vivo. Int J Cancer. 2006;119(1):41–48. | ||
Malumbres M, Barbacid M. Cell cycle, CDKs and cancer: a changing paradigm. Nat Rev Cancer. 2009;9(3):153–166. | ||
Vermeulen K, Van BDR, Berneman Z. The cell cycle: a review of regulation, deregulation and therapeutic targets in cancer. Cell Prolif. 2003;36(3):131–149. | ||
Wafa K, Pasumarthi KB. Endogenous and pharmacological inhibitors of cyclin dependent kinases in cell cycle regulation of normal and cancer cells. Austin J Pharmacology and Therapeutics. 2015;3(1):1067. | ||
Lindsay J, Esposti MD, Gilmore AP. Bcl-2 proteins and mitochondria-specificity in membrane targeting for death. Biochim Biophys Acta. 2011;1813(4):532–539. | ||
Jiang X, Wang X. Cytochrome C-mediated apoptosis. Annu Rev Biochem. 2004;73:87–106. | ||
Bratton SB, Salvesen G. Regulation of the apaf-1-caspase-9 apoptosome. J Cell Sci. 2010;123(19):3209–3214. | ||
Lima RT, Martins LM, Guimarães JE, Sambade C, Vasconcelos MH. Specific downregulation of bcl-2 and xIAP by RNAi enhances the effects of chemotherapeutic agents in MCF-7 human breast cancer cells. Cancer Gene Ther. 2004;11(5):309–316. | ||
Ma W, Teng Y, Hua H, Hou J, Luo T, Jiang Y. Upregulation of heat shock protein 27 confers resistance to actinomycin D-induced apoptosis in cancer cells. FEBS J. 2013;280(18):4612–4624. | ||
Nagaraja GM, Kaur P, Neumann W, et al. Silencing hsp25/hsp27 gene expression augments proteasome activity and increases CD8+ T cell-mediated tumor killing and memory responses. Cancer Prev Res. 2012;5(1):122–137. | ||
Zheng L, Ren JQ, Li H, Kong ZL, Zhu HG. Downregulation of wild-type p53 protein by HER-2/neu mediated PI3K pathway activation in human breast cancer cells: its effect on cell proliferation and implication for therapy. Cell Res. 2004;14(6):497–506. | ||
Wu B, Li W, Qian C, Zhou Z, Xu W, Wu J. Down-regulated P53 by siRNA increases Smad4’s activity in promoting cell apoptosis in MCF-7 cells. Eur Rev Med Pharmacol Sci. 2012;16(9):1243–1248. | ||
Pluta P, Smolewski P, Pluta A, et al. Significance of Bax expression in breast cancer patients. Polish J Surg. 2011;83(10):549–553. |
 © 2017 The Author(s). This work is published and licensed by Dove Medical Press Limited. The
full terms of this license are available at https://www.dovepress.com/terms
and incorporate the Creative Commons Attribution
- Non Commercial (unported, 3.0) License.
By accessing the work you hereby accept the Terms. Non-commercial uses of the work are permitted
without any further permission from Dove Medical Press Limited, provided the work is properly
attributed. For permission for commercial use of this work, please see paragraphs 4.2 and 5 of our Terms.
© 2017 The Author(s). This work is published and licensed by Dove Medical Press Limited. The
full terms of this license are available at https://www.dovepress.com/terms
and incorporate the Creative Commons Attribution
- Non Commercial (unported, 3.0) License.
By accessing the work you hereby accept the Terms. Non-commercial uses of the work are permitted
without any further permission from Dove Medical Press Limited, provided the work is properly
attributed. For permission for commercial use of this work, please see paragraphs 4.2 and 5 of our Terms.