Back to Journals » OncoTargets and Therapy » Volume 12
Artificial microenvironment of in vitro glioblastoma cell cultures changes profile of miRNAs related to tumor drug resistance
Authors Witusik-Perkowska M ![]() , Zakrzewska M, Jaskolski DJ, Liberski PP, Szemraj J
, Zakrzewska M, Jaskolski DJ, Liberski PP, Szemraj J ![]()
Received 12 October 2018
Accepted for publication 9 February 2019
Published 20 May 2019 Volume 2019:12 Pages 3905—3918
DOI https://doi.org/10.2147/OTT.S190601
Checked for plagiarism Yes
Review by Single anonymous peer review
Peer reviewer comments 3
Editor who approved publication: Dr Sanjay Singh
Monika Witusik-Perkowska,1 Magdalena Zakrzewska,2 Dariusz J Jaskolski,3 Pawel P Liberski,2 Janusz Szemraj1
1Department of Medical Biochemistry, Medical University of Lodz, Lodz, Poland; 2Department of Molecular Pathology and Neuropathology, Medical University of Lodz, Lodz, Poland; 3Department of Neurosurgery and Neurooncology, Medical University of Lodz, Barlicki University Hospital, Lodz, Poland
Purpose: The in vitro environment can influence not only the molecular background of glioblastoma drug-resistance and treatment efficiency, but also the mechanisms and pathways of cell death. Both crucial molecular pathways and the deregulation of miRNAs are thought to participate in tumor therapy-resistance. The aim of our study is to examine the potential influence of ex vivo conditions on the expression of miRNAs engaged in the machinery of tumor-drug resistance, since in vitro models are commonly used for testing new therapeutics.
Methods: Glioblastoma-derived cells, cultured under three different sets of conditions, were used as experimental models in vitro. The expression of 84 miRNAs relevant to brain tumorigenesis was evaluated by multi-miRNA profiling for initial tumors and their corresponding cultures. Finally, the expression of selected miRNAs related to temozolomide-resistance (miR-125b, miR-130a, miR-21, miR-221, miR-222, miR-31, miR-149, miR-210, miR-181a) was assessed by real-time PCR for each tumor and neoplastic cells in cultures.
Results: Our results demonstrate significant discrepancies in the expression of several miRNAs between tumor cells in vivo and in vitro, with miR-130a, miR-221, miR-31, miR-21, miR-222, miR-210 being the most marked. Also differences were observed between particular models in vitro. The results of computational analysis revealed the interplay between examined miRNAs and their targets involved in processes of glioblastoma chemosensitivity, including the genes relevant to temozolomide response (MGMT, PTEN, MDM2, TP53, BBC3A).
Conclusion: The artificial environment may influence the selective proliferation of cell populations carrying specific patterns of miRNAs and/or the phenotype of neoplastic cells (eg differentiation) by the action of molecular events including miRNAs. These phenomena may influence the tumor-responsiveness to particular drugs, disturbing the evaluation of their efficacy in vitro, with unpredictable results caused by the interdependency of molecular pathways.
Keywords: glioblastoma, cell culture, drug-resistance, miRNA, temozolomide
Introduction
Despite their artificial character, tumor-derived cultures are common experimental models used for searching new therapeutic modalities. However, the microenvironment associated with in vitro conditions may influence aspects of the genotype, phenotype and behavior of tumor cells, including their drug-responsiveness.2 Extrinsic in vitro factors can influence not only the molecular background of glioblastoma drug resistance and the efficiency of treatment, but also the mechanisms and pathways of cell death.3
Apart from the crucial molecular pathways recognized as factors underlying the phenomenon of glioblastoma aggressiveness and resistance, a number of recent investigations have been focused on miRNA analyses in the context of glioblastoma pathogenesis, mechanisms leading to the creation of an incurable phenotype and the possibility of creating novel therapeutic modalities.4,5 A recent review of papers over the past decade indicates the presence of a network of connections between the key signaling pathways, aberrations of which are typical of glioblastoma, and the existence of several miRNAs acting as tumor suppressors (tsmiR) or oncogenes (oncomiR) regulating the level of their target genes.6–8 By means of these indirect mechanisms, miRNAs have the ability to influence a variety of cellular processes underlying the phenomenon of tumorigenesis and resistance to therapy, such as proliferation, migration, invasiveness, ability of angiogenesis induction, apoptosis regulation, stemness state and differentiation potential, epithelial-mesenchymal transition (EMT) status, chemo- and radiosensitivity.6–8 Since deregulation of miRNAs is considered as a factor participating in tumor resistance, the miRNAs involved in this process could be potentially used as biomarkers of drug response.9–11
Until now, only a modest body of evidence has been assembled concerning miRNA expression with regard to culture conditions in tumor-derived in vitro cultures and tumor cell lines.12–14,16
Our previous results allow us to hypothesize that artificial in vitro conditions may influence the miRNA profile and consequently the miRNA-dependent processes taking place in tumor-derived cells cultured ex vivo.3 Our present study is focused on an analysis of a panel of miRNAs relevant to brain tumorigenesis in glioblastoma-derived in vitro experimental models with a special emphasis on miRNAs related to tumor drug resistance. The main aim of our study is not to identify new potential therapeutic targets, but to examine how the ex vivo microenvironment may influence the expression pattern of miRNAs known to be engaged in the process of glioblastoma drug responsiveness.
Material and methods
Tumor sample processing
Tumor samples were obtained from the Department of Neurosurgery and Oncology of Central Nervous System, Medical University of Lodz, Poland. All procedures were performed in accordance with the ethical standards of the Bioethics Committee of the Medical University of Lodz (reference number of approval RNN/148/08/KE and RNN/160/15/KE) and informed consent was obtained from all patients, in accordance with the Declaration of Helsinki. The tumor samples intended for cell culture generation were classified according to WHO criteria, as glioblastoma, NOS/not otherwise specified (the mutational status of IDH gene family was not verified).15
Tumor tissue was rinsed with Hank’s balanced salt solution (HBSS). The visible necrotic fragments and red endothelial areas were removed. Subsequently, the tumor tissue was minced in HBSS and passed through a 40 μm cell strainer (BD Biosciences, San Jose, CA, USA) to obtain a single cell suspension. Cells were washed with PBS and divided into three parts: population used for RNA isolation, population used for verification of neoplastic cell presence, and population for cell culture growing.
The presence of neoplastic cells in the population derived initially from the tumors and at further steps of cell culture was verified at DNA level, eg loss of heterozygosity (LOH) analyses and by immunofluorescence detection of astrocytoma-associated antigens (AAAs): IL13Rα2 and Fra-1. The immunofluorescence method and LOH analysis technique were performed as described previously.3,17
To avoid potential changes in tumor intraheterogeneity resulting from ex vivo culture, the immunocytochemistry assays for initial cell population derived from tumor were performed as soon as the primary cells attached to a dish (24–48 hours after cell seeding).
Thus, the samples named further as “initial tumors” correspond to the population of cells isolated directly from the tumors and verified with respect to the neoplastic cell amount. For generation of cell culture models and molecular analysis of miRNA expression, only the population consisting of minimum 70–80% of neoplastic cells (positive for AAAs) was used. The results of immunocytochemistry were additionally verified at DNA level (LOH analyses).
Glioblastoma cell culture models
On the basis of the experimental approach presented above, glioblastoma cultures were derived from three tumors. The detailed procedure of culture generation and growing was described in our previous report.3 In brief, the cells were cultured under three different conditions: adherent culture in serum-supplemented medium (DMEM/F12 with 10% FBS), adherent culture in serum-free conditions on commercially available (Corning R SynthemaxTMSurface; Corning Incorporated, Corning, NY, USA) vitronectin-mimicking synthetic peptide-acrylate plates (neurobasal medium – NBM with G5, NSC) and spheroid culture in serum-free conditions (NBM medium with N2, B27, epidermal growth factor – EGF, basic fibroblast growth factor – bFGF and heparin). Further analyses were performed with the use of cells cultured under particular conditions for at least two to three passages. The products used for cell culture generation and growing (DMEM/12, FBS, NBM, G5, NSC, N2, B27, EGF, bFGF and heparin) were purchased from Life Technologies Corporation (Grand Island, NY, USA).
The presence of neoplastic cells in particular models in vitro was verified by immunofluorescence detection of AAAs: IL13Rα2 and Fra-1 and additionally confirmed at DNA level, eg LOH analyses. For analysis of miRNA expression, only the populations consisting of minimum 70–80% of neoplastic cells (positive for AAAs) were used.
Differential expression of miRNA
- Isolation of total RNA, using miRNeasyMini kit (Qiagen, Hilden, Germany) from the following samples: initial population of cells derived from particular tumors (G113, G114, G116), the corresponding cell culture models - adherent culture with 10% FBS (10% adh), serum-free adherent (0% adh) and spheroid culture (0% sph); (G113: 10% adh, 0% sph, 0% adh; G116: 10% adh, 0% sph, 0% adh; G114: 10% adh, 0% adh).cDNA synthesis was performed using the miScript II RT Kit (Qiagen) according to manufacturer’s instructions.
The miScript miRNA PCR Array Human Brain Cancer (Qiagen) was used to profile the expression the miRNAs specified above. Apart from the 84 tested miRNAs, a set of controls was included in each plate, which enabled data analysis using ΔΔCT method, assessment of reverse transcription and PCR quality. Real-time PCR was performed using the miScript miRNA PCR Array and miScript SYBR Green PCR Kit (including QuantiTect SYBR® Green PCR Master Mix and miScript Universal Primer) according to the manufacturer’s instructions (Qiagen). The reaction mix in each well (25 μL) included equal amount of cDNA (0.5–1ng). Cycling conditions were as follows: initial activation step at 95°C for 15 minutes followed by 40 cycles of denaturation at 94°C for 15 seconds, annealing at 55°C for 30 seconds, extension at 70°C for 30 seconds. A melting curve analysis was performed to verify that the product consisted of a single amplicon. Real-time PCR was performed using a Stratagene Mx3005P instrument (Agilent Technologies, Santa Clara, CA, USA). The results were analyzed using Stratagene Mx3005P software (Agilent Technologies, Santa Clara, CA, USA). Normalized relative expression levels of the examined genes in the tested samples versus the control sample were calculated according to a modified 2ΔΔCT method, based on the mean CT value of the sample.18,19 RNA derived from a commercially available human brain (Total RNA, Brain, Human; Agilent Technologies) was used as a control sample.
ΔΔCT = ΔCT(a target sample) −ΔCT(a control sample) = (CTreftar - CTmiRNAtar)−(CTrefcont- CTmiRNAcont)
miRNA fold change relative to control=2ΔΔCT
The expression of the selected miRNAs was verified with the use of a single primer-assay based on the real-time PCR results. Predesigned commercially available miScript Primer Assays were used (Hs_RNU6-2_11, Hs_SNORD68_11, Hs_SNORD95_11, MS00033740; Hs_miR-125b_1, MS00006629; Hs_miR-130a_1, MS00003444; Hs_miR-21_2, MS00009079; Hs_miR-221_1, MS00003857; Hs_miR-222_2, MS00007609; Hs_miR-31_1, MS00003290; Hs_miR-149_1, MS00003570; Hs_miR-210_1, MS00003801; Hs_miR-181a_2, MS00008827; Qiagen). Real-time PCRs were performed using the miScript Primer Assays and miScript SYBR Green PCR Kit according to the manufacturer’s instructions (Qiagen). RNU6-2, SNORD68 and SNORD95 were used as references to normalize the analyzed miRNA expression. Each sample was amplified in a reaction volume of 20 μL, containing 1 ng of cDNA, QuantiTect SYBR® Green PCR Master Mix, miScript Universal Primer, and appropriate primer assay. Real-time PCR was performed using a Stratagene Mx3005P instrument (Agilent). The cycling conditions were set according to the manufacturer’s protocol (initial activation step at 95°C for 15 minutes followed by 40 cycles of denaturation at 94°C for 15 seconds, annealing at 55°C for 30 seconds, extension at 70°C for 30 seconds). The results were analyzed using Stratagene Mx3005P software. To confirm the specificity of the amplification signal, the gene dissociation curve was considered in each case. Normalized relative expression levels of the examined miRNAs in the tested samples were calculated against a control value according to the modified 2ΔΔCT method, based on the mean CT value of the sample, as described above.18,19
To evaluate relative expression in target samples, commercially available RNA from a human brain (total RNA, brain, human; Agilent Technologies) was used as control or RNA isolated from initial population of cells derived from glioblastomas, when examining expression in culture models in relation to corresponding initial tumors.
Statistical and computational analysis
Heat map and clustering analyses for 84 miRNAs were generated from ΔΔCT values (log2 fold change relative to control—human brain) with the use of Gitools platform.20 (–ΔΔCT) values were considered as miRNA underexpression and (+ΔΔCT) values were considered as miRNA overexpression in relation to control (HB, human brain). For assessing the uncertainty in hierarchical cluster analysis the results of clustering according to the samples were depicted as dendrogram generated by means of pvclust package in R.21 Two types of P-values: approximately unbiased (AU) P-value and bootstrap probability (BP) value were provided. Clusters with AU larger than 95% are strongly supported by data.
Additional heat maps for the selected miRNAs were generated from ΔΔCT values (log2 fold change relative to control—corresponding tumor). (–ΔΔCT) values were considered as miRNA underexpression and (+ΔΔCT) values were considered as miRNA overexpression in relation to control (corresponding tumor).
The expression data (ΔCt values) was analyzed by nonparametric tests. The differences between more than two groups were first analyzed with the Kruskal–Wallis test. If this difference proved significant, individual groups were further investigated using the Conover–Inman nonparametric post hoc test.
The P-values were corrected for multiple testing using the false discovery rate method (FDR ≤0.05) according to Benjamini and Hochberg.22
Finally, the data were expressed as ΔΔCT or 2ΔΔCT values (fold change) in relation to appropriate control (human brain or initial tumors).
The molecular network comprising the selected miRNAs (miR-130a, miR-221, miR-31, miR-21, miR-222, miR-210) and their potential targets was generated with the use of miRTargetLink Human software.23 The enrichment analysis was performed via miRTargetLink Human supported by Gene Trail2 platform.24
The enrichment algorithm based on overrepresentation analysis (ORA) with significance level: 0.05 and FDR adjustment according to Benjamini and Hochberg.22
Results
Multi-miRNA analysis demonstrated differences in the expression pattern of miRNAs related to brain tumorigenesis, exhibited by glioblastoma cells in vivo and in vitro
The glioblastoma-derived cells (G113, G114 and G116) were cultured as three different models: an adherent culture in traditional serum-supplemented medium (10% adh); a spheroid serum-free culture (0% sph); and an original method of adherent culture on a synthetic vitronectin-mimicking surface in serum-free medium (0% adh), described previously.3 The G113 and G116 tumors exhibited the ability to grow in all applied models, while the G114 tumor did not generate spheroids. The neoplastic character of cells in vitro were verified with the use of AAAs - IL13Rα2 and Fra-1, (Figure 1) and confirmed additionally by the presence of molecular markers typical for glioblastoma (data not shown) according to a previously-applied scheme.17. The detailed characteristics of particular tumor cultures are presented elsewhere, including the selected features important for TMZ-resistance, such as status of MGMT promoter methylation and MGMT expression. In brief, for G113, G114 and G116, the MGMT promoter status was assessed as methylated/unmethylated, but G113 and G114 presented low expression level of MGMT, while in case of G116, the level of MGMT was undetectable.3
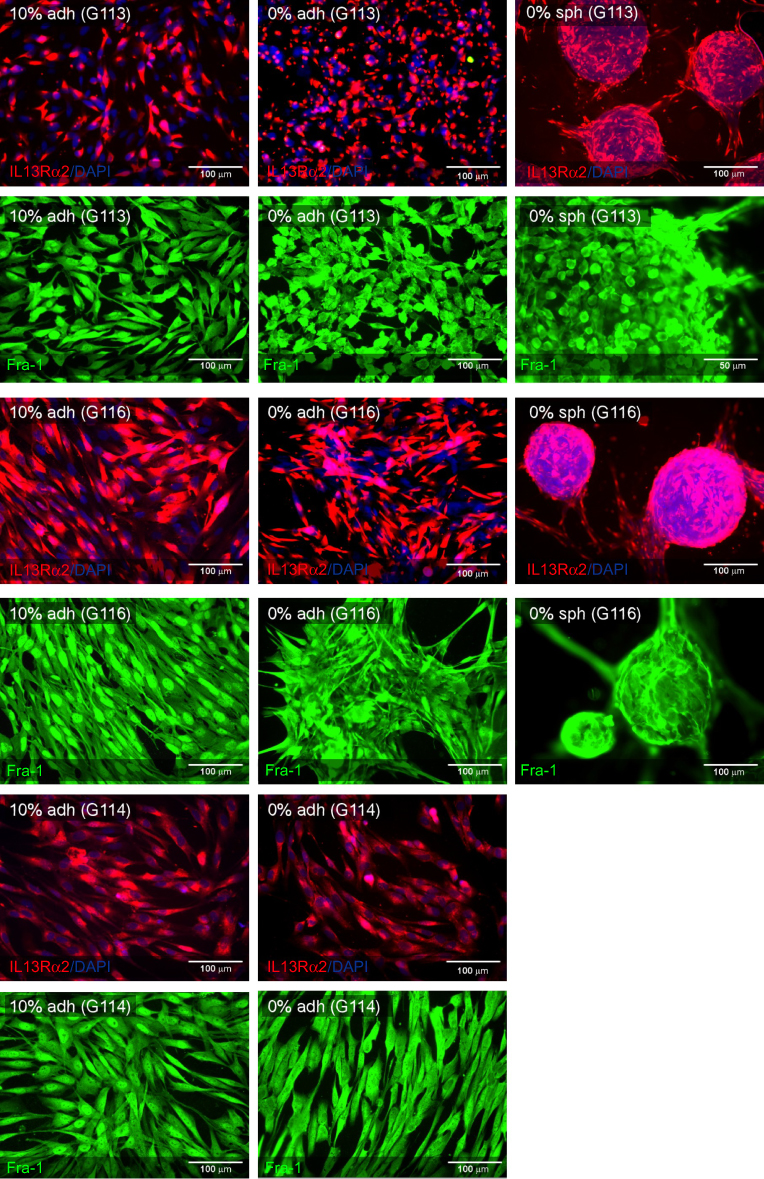 | Figure 1 Glioblastoma cell culture generated as three different models in vitro (10% adh, 0% adh, 0% sph) presenting expression of selected astrocytoma associated antigens—IL13Rα2, Fra-1 (the representative immunofluorescence results for G113, G116, and G114 tumor-derived cultures). |
The miRNA isolated from initial tumors (G113, G116, G114) and particular corresponding culture models (G113: 10% adh, 0% sph, 0% adh; G116: 10% adh, 0% sph, 0% adh; G114: 10% adh, 0% adh) were subsequently used for expression analyses.
Multi-miRNA analysis performed for the panel of miRNAs related to astrocytoma pathogenesis identified differences in patterns of miRNA expression between initial tumors and particular culture models. The hierarchical clustering method revealed the matching of initial tumors (G113, G116, G114) and of cell cultures generated from three different tumors to be closer than the level of similarity demonstrated by pairs of particular tumors and corresponding cultures (Figure 2b). However, the examined miRNAs related to glioblastoma pathogenesis exhibited different vulnerability to influence by the in vitro microenvironment, as demonstrated in the generated heat map (Figure 2a).
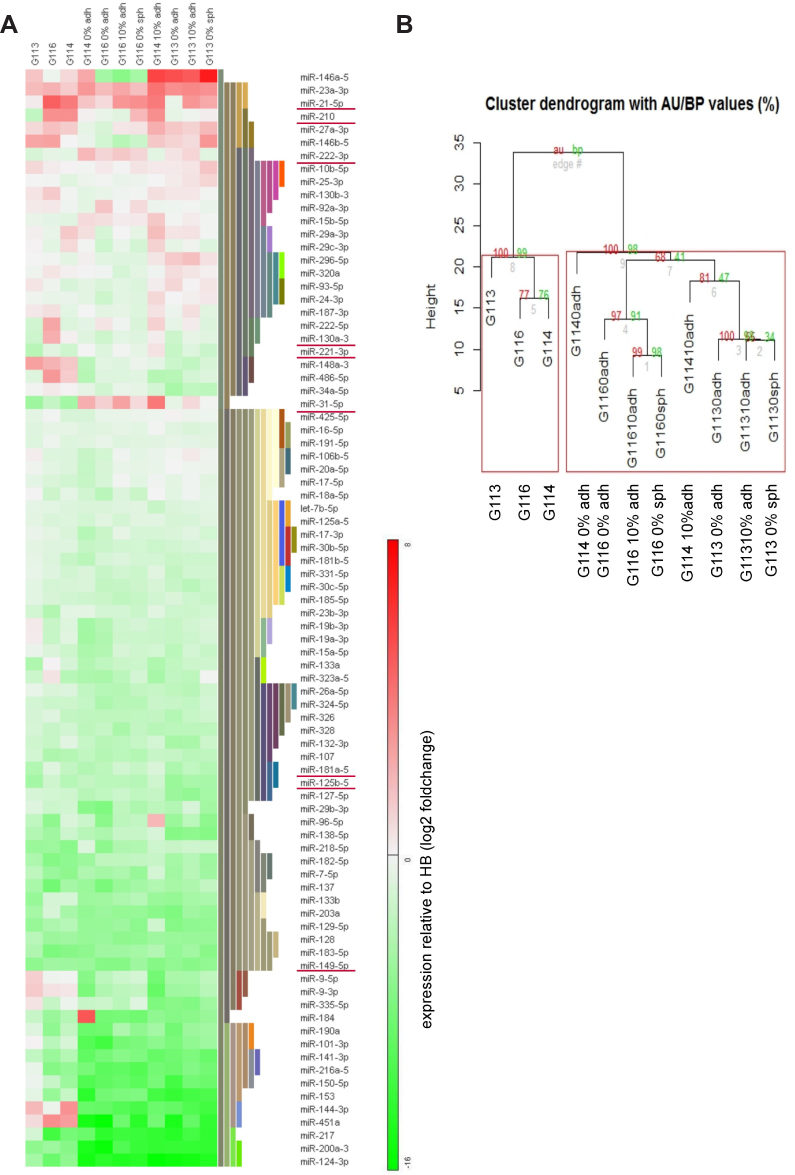 | Figure 2 Results of multi-miRNA analysis in initial tumors and corresponding culture models showing expression levels relative to control human brain. (A) Heat map was generated from the ΔΔCT values (log2 fold change). (–ΔΔCT) values were considered as miRNA underexpression and (+ΔΔCT) values were considered as miRNA overexpression in relation to HB. The results of clustering according to the miRNAs (rows) are depicted as colored bars in the heatmap representing the hierarchical tree splitting at different levels. The root of the tree is located at the bottom, the leaves at the top. The clustered heat map revealed the similarities in expression pattern of miRNAs related to TMZ responsiveness in GB (underlined miRNAs). (B) The results of hierarchical cluster analysis according to the samples present the scale of similarity of miRNA panel in tumor samples and tumor-derived cell cultures based on dendrogram with AU P-values and BP value (%). Two main groups were identified, significant at least at the 95%CI—group of initial tumors (G113, G114, G116) and group of tumor-derived cells cultured as different models in vitro (10% adh, 0% adh, 0% sph). Abbreviations: HB, human brain; TMZ, temozolomide; GB, glioblastoma; AU, approximately unbiased; BP, bootstrap probability. |
The results of cytotoxicity analyses presented in our previous work demonstrated differences in response to temozolomide (TMZ) between particular culture models (10% adh, 0% sph, 0% adh) generated from the same tumors (G113, G116, G114).3
Therefore, following a literature survey, the following miRNAs believed to be related to temozolomide-responsiveness, were selected for validation and further analysis from the panel of 84 miRNAs: miR-125b, miR-130a, miR-21, miR-221, miR-222, miR-31, miR-149, miR-210, miR-181a.1,25–41 The clustered heat map displayed a similarity in expression pattern of six from the selected miRNAs: miR-130a, miR-21, miR-221, miR-222, miR-31 and miR-210, grouped in the same cluster (Figure 2a).
The type of cell culture model influences the profile of miRNAs related to tumor drug resistance
To classify the selected miRNAs (miR-125b, miR-130a, miR-21, miR-221, miR-222, miR-31, miR-149, miR-210, miR-181a) as being under- or overexpressed in initial glioblastoma samples, their expression levels were analyzed in relation to human adult brain tissue (commercially available RNA). The results of the quantitative analyses were also compared to previously published data (Table 1).
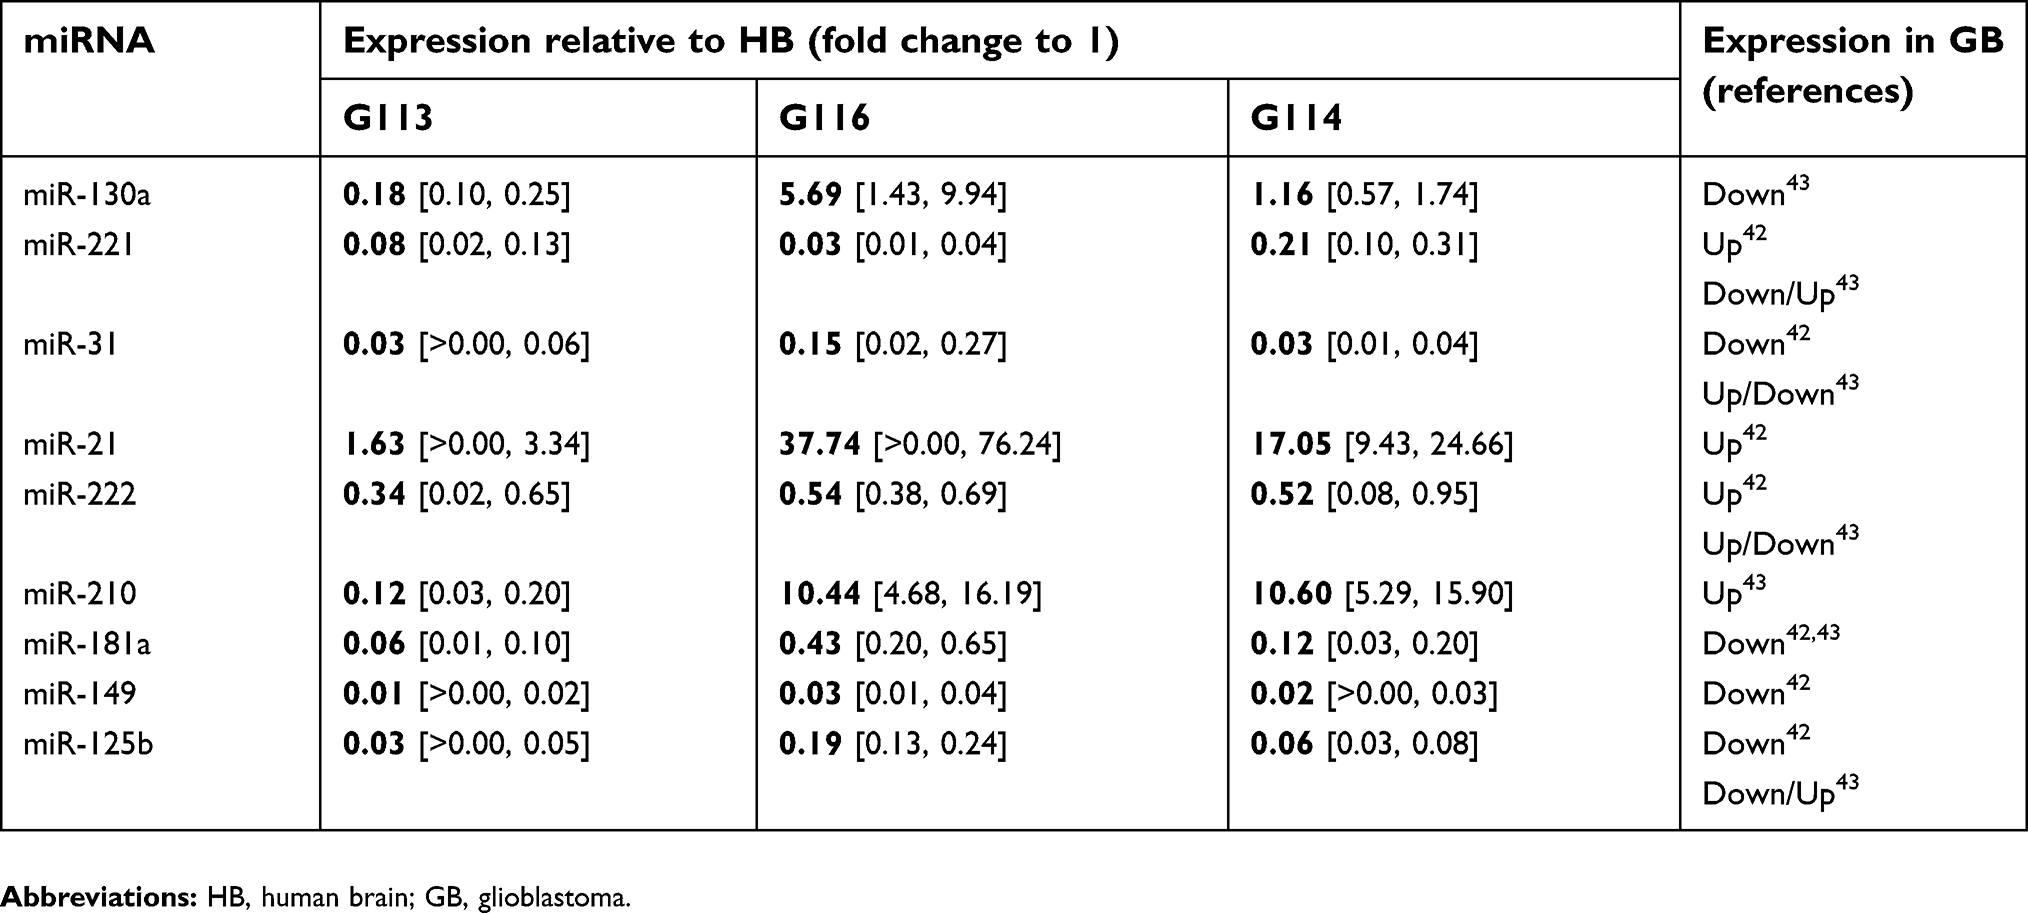 | Table 1 Expression pattern of miRNA related to TMZ responsiveness in examined glioblastoma tumors compared to literature-derived evidence |
However, previous studies present imperfect consistency with regard to the expression pattern of miRNAs in glioblastoma, possibly due to the heterogeneity of glioblastoma and technical difficulties related to the selection of a normal control.42–44 Therefore, our later expression analysis was based on the comparison of selected miRNAs relevant to TMZ-resistance, in particular culture models in relation to their corresponding tumors (not to normal brain tissue).
The second step of the investigation examined the possible differences between the cell cultures and the initial tumors, as well as between particular culture models. The quantitative analysis revealed that examined miRNAs displayed different degrees of vulnerability to changes induced by environmental factors (Figure 3a).
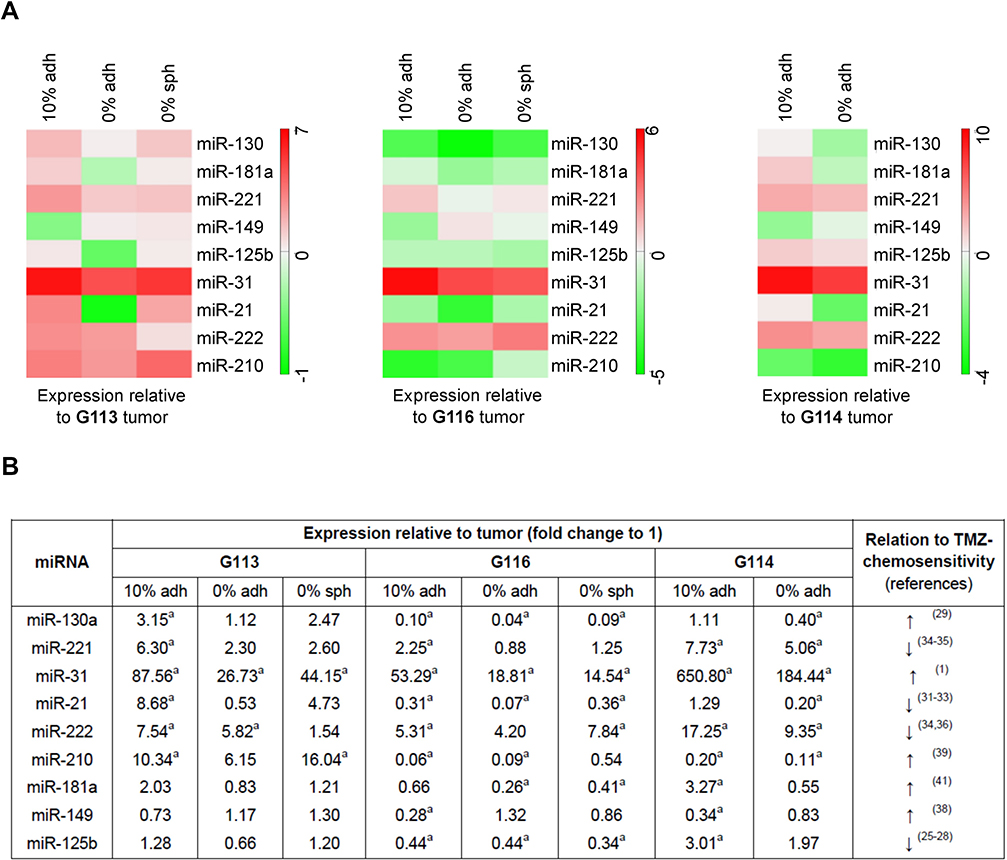 | Figure 3 Expression pattern of miRNAs engaged in TMZ-responsiveness in particular culture models in relation to initial tumors. (A) The heat maps were generated from the ΔΔCT values (log2 fold change) obtained for particular in vitro models relative to initial tumors. (–ΔΔCT) values were considered as miRNA underexpression and (+ΔΔCT) values were considered as miRNA overexpression in relation to initial tumor. (B) The scale of changes in the examined miRNA levels in in vitro models in context of their role in TMZ-responsiveness. Data exhibited as fold change in expression level in relation to tumor. Notes: aStatistical significance of differences between in vitro models and corresponding tumors was assessed using the ΔCT values (FDR ≤0.05). Abbreviation: TMZ, temozolomide. |
In addition, our findings were compared with literature-derived results regarding the relationship of glioblastoma TMZ-chemosensitivity to particular miRNA specified in Figure 3b. To better show the scale of changes detected in vitro, the expression data for each culture model was presented as fold change in relation to the corresponding tumor (Figure 3b).
The most significant differences were observed for the following miRNAs: miR-130a (G116), miR-221 (G113, G114), miR-31, miR-21, miR-222, miR-210 (G113, G116, G114), presenting at least four times overexpression or underexpression in relation to the corresponding tumor (fold change ≥4.00 or ≤0.25 detected in at least one case of tumor and one culture model); (FDR ≤0.05); Figure 3b. The greatest discrepancies were presented by miR-31, which displayed fold changes ranging from several dozen to several hundred times compared to the initial tumor.
The remaining analyzed miRNAs presented no differences in expression between tumors and particular culture models, or the changes were more subtle (Figure 3).
The miRNAs which demonstrated the greatest differences in expression between culture models and initial tumors were computationally analyzed to examine their potential interrelations. The results enabled a molecular network to be drawn up connecting all examined miRNAs (miR-130a, miR-221, miR-31, miR-21, miR-222, miR-210) and 157 target genes, including genes known to be engaged in temozolomide responsiveness in glioblastoma, eg MGMT, TP53, MDM2, PTEN (Figure 4a). Enrichment analysis , performed with GeneTrail2 supported by pathway databases, confirmed that these miRNAs via interaction with their targets, participated in processes involved in drug responsiveness in glioblastoma and highlighted their interdependence (Figure 4b). The ORA was performed with a set of 157 genes that are targeted by the selected miRNAs (miR-130a, miR-221, miR-31, miR-21, miR-222, miR-210) as indicated by published experimental evidence, resulted in a panel of genes enriched in several processes related to glioblastoma drug resistance (Figure 4c).
 | Figure 4 Results of computational analysis presenting interplay of miRNAs involved in TMZresponsiveness in glioblastoma. (A) Molecular network showing interconnection of examined miRNAsa and their targets. Genes depicted as orange are targeted by three or more, genes depicted as blue—by two miRNAs. Presented interactions are all experimentally validated. Interactions with strong evidence are depicted by green edges, interactions with weaker evidence are depicted by blue or orange edges. (B) Dependency wheel of biological pathways created on the basis of enrichment analysis performed for the examined miRNAsa and their targets presenting interrelation of processes specific for tumor-drug resistance including process of DNA damage caused by TMZ treatment; (C) Results of enrichment analysis (significance level: 0.05; FDR adjustment—Benjamini and Hochberg) performed with a set of 157 genes that are targeted by the examined miRNAsa, as indicated by database-available experimental evidence. The table consists of processes important for glioblastoma, however, the results of ORA revealed the molecular events common with other types of tumors (depicted in dependency wheel). Notes: amiR-130a, miR-221, miR-31, miR-21, miR-222, miR-210—miRNAs showing the most discrepant expression pattern in in vitro models in relation to tumors. Abbreviations: TMZ, temozolomide; FDR, false discovery rate; ORA, overrepresentation analysis. |
Discussion
Despite the fact that temozolomide is established as a standard agent in glioblastoma treatment, an inherent or acquired resistance to this drug is still impossible to overcome. The reasons underlying this phenomenon are the subject of constant study. Tumor-derived cell cultures serve as a common model used in studies related to mechanisms of drug resistance. Nevertheless, the feasibility of the development of a representative ex vivo model remains controversial, especially in relation to glioblastomas and other highly heterogeneous tumors.45–52
Multi-miRNA analysis revealed that initial tumors present different expression patterns of miRNAs related to brain tumorigenesis in comparison to cell cultures derived from them, as well as differences between particular culture models. Moreover, our results demonstrate that closer similarity exists between tumor samples derived from different patients and culture models derived from different tumors than between a tumor and a corresponding cell culture (Figure 2).
Our previous article demonstrated that extrinsic in vitro factors can influence not only the molecular background of glioblastoma drug resistance and the efficiency of treatment, but also the mechanisms/pathways of cell death induced by TMZ.3 The current comparative analysis of miRNA profiles of glioblastoma cells cultured as different experimental models revealed differences in the expression of selected miRNAs known to be potential regulators of TMZ chemosensitivity: miR-130a, miR-181a, miR-221, miR-149, miR-125b, miR-31, miR-21, miR-222, miR-210.1,25–41
Since no consistent results exist regarding the expression pattern of miRNAs in glioblastoma, our further analysis was based on comparing the expression of selected miRNAs (miR-130a, miR-181a, miR-221, miR-149, miR-125b, miR-31, miR-21, miR-222, miR-210) in particular culture models to that of the initial tumor. This approach was intended to evaluate the potential discrepancies between neoplastic cells in vivo and in vitro.
It is difficult to assess when the scale of expression variations starts influencing the biological processes, but our results singled out the following miRNAs as the most dissimilar from the initial tumors: miR-130a, miR-221, miR-31, miR-21, miR-222 and miR-210, with miR-31 being particularly divergent. The clustering analysis placed these miRNAs into the same cluster, emphasizing similarity in their expression pattern.
Previous investigations have indicated miR-31 as a tumor suppressor that is commonly downregulated in glioblastoma compared with normal brain tissues.53,54 Rajbhandari et al demonstrated the loss of one or both copies of MIR31HG encoding miR-31 in glioblastoma. However, homozygous deletion was detected in about 30% of glioblastomas, indicating that 70% of cases retain expression of miR-31; nevertheless, its level may still be reduced.55
Our results also show downregulation of miR-31 in all initial tumors compared to control brain tissue, but with a significant increase in its level observed in vitro.
The simplest way to clarify this phenomenon would be through the selective proliferation of a cell population in culture presenting a high expression of miR-31 (positive for MIR31HG), particularly since glioblastoma presents high molecular intratumor heterogeneity, including miRNAs.56 However, the differences in miR-31 level were also observed between particular culture models. The alternative reasons of these discrepancies were considered in context of miR-31 function. It has been shown that miR-31 regulates diverse cellular and developmental processes, including cell differentiation, and more importantly, it is also engaged in glial differentiation and astrocyte specification.57–59 According to Kim et al, a high level of miR-31 has been associated with the mesenchymal subtype of glioblastoma, derived from astrocytic precursors. The miRNA cluster specific for this molecular subclass of tumor included also miR-21, miR-221, miR-222 and miR-210.60 Moreover, Aldaz et al report the participation of miR-221/222 and miR-21 in the differentiation of glioblastoma initiating cells (GICs) in vitro.61 Our present findings indicate that miR-31, miR-221, miR-222 and miR-21 present higher expression in differentiation culture conditions (medium with serum) in comparison to serum-free cultures. It has also previously been found that glioblastoma cells exposed to medium with serum showed features of mesenchymal differentiation.62
To conclude, the observed discrepancies in the levels of some of the examined miRNAs between tumors in vivo and tumor-derived cultures in vitro may be attributed to cell population selection resulting from glioblastoma intraheterogeneity. Alternatively, the artificial environment may play a role, by promoting changes of tumor cell phenotype in vitro (eg cell differentiation).
Regardless of the reasons underlying this phenomenon, it may seriously disturb the drug responsiveness of the tumor in vitro, because the expression of most of the analyzed miRNAs related to TMZ resistance varied considerably between tumors and their corresponding cell cultures, as well as between particular models in vitro. Since the miR-31 expression pattern demonstrated the greatest differences, we could speculate that glioblastoma chemosensitivity will be increased in vitro, especially in serum presence, because the restoration of miR-31 expression has been found to enhance TMZ cytotoxicity in glioblastoma cells.1 But considering the function of examined miRNAs in the context of tumor chemosensitivity and analyzing their expression patterns in vitro (Figure 3b), it is likely that their potential effect on drug resistance may be difficult to predict, due to it being a result of concomitant and contradictory changes at the molecular level. In addition, our computationally generated molecular network and further dependency analysis (Figure 4) confirmed the complexity of interactions between analyzed miRNAs (miR-130a, miR-221, miR-31, miR-21, miR-222, miR-210, miR-31) and their targets, and demonstrated their involvement in processes important for therapy response.
Our computational analysis indicated several genes, including TP53, MDM2, PTEN, BBC3 and MGMT, as interplayers in the molecular network of examined miRNAs (Figure 4). They were also recognized as genes engaged in mechanisms of glioblastoma drug resistance and presented in the context of gene-phenotype connectivity by Shi et al.63–65
On the basis of existing evidence, we discussed the functional relationship between these genes as targets for miRNAs related to glioblastoma resistance.
The studies of the Kang group indicated that miR-221/222 regulate apoptosis, and influence TMZ-sensitivity by targeting BBC3 (PUMA).32,66 They also showed that miR-221 and miR-222 directly modulate PTEN expression in tumor cells.67 Conversely Inaba et al demonstrated that upregulation of PTEN leads to an increase in sensitivity of glioma cells to TMZ.68 PTEN was also recognized as a target for miR-21,which is upregulated in the majority of cancers, including glioblastoma.69 Moreover, it has been shown that silencing of miR-21 increases PTEN expression and enhances the antiproliferative and apoptotic response of GB cells to TMZ.70
The p53/mdm2 pathway is deregulated in the majority of neoplasms including glioblastoma. This dysfunction disturbs several mechanisms important for drug resistance of tumor cells, such as cell proliferation or evasion of apoptosis.71 The aberration of the p53 signalling pathway could be underlain by miRNA activity. Fornari et al found that miR-221 inhibits MDM2 to affect p53/mdm2 axis. By modulating the p53 axis, miR-221 impacts cell-cycle progression and apoptotic response to treatment in tumor-derived cell lines.72.
Apart from the genes closely related to p53 signaling pathways, MGMT is another gene associated with responsiveness to alkylating agents, such as TMZ. Although MGMT repair activity is mainly dependent on the methylation status of its promoter, Quintavelle et al provided evidence that miR-221 and miR-222 regulate MGMT expression level in glioblastoma, thus increasing the response to TMZ.37
Such an analytical approach shows the spectrum of tumor responsiveness complexity and provides the new putative therapeutic targets to overcome TMZ-resistance in glioblastoma.
A number of recent works discuss the dilemma concerning the choice of the best experimental model for tumor cell culture, as in vitro conditions are believed to influence the genotype and phenotype of neoplastic cells, as well as their potential response to treatment.2 Our comparison of different culture conditions showed that even serum-free models, postulated as being closer to the genotype and phenotype of the tumor in vivo, presented divergent miRNA expression patterns.
Conclusion
Due to the heterogeneity of glioblastomas and complexity of miRNA interactions, our findings did not allow us to single out the best culture model suitable for chemosensitivity investigation. But our results reveal that the expression profile of miRNAs related to tumor drug resistance may be strongly influenced by artificial conditions in vitro. Although cell cultures are basic tools in the testing of new therapeutics, our results emphasize that the translation of ex vivo data from bench to clinic requires a comparison of the in vivo and in vitro molecular landscapes.
Acknowledgments
The authors thank E. Lowczowski, MSc, a native English speaker for language correction (Writing Centre, Foreign Language Centre, Medical University of Lodz).
This study was conducted with the financial support of the statutory funds of Department of Medical Biochemistry (503/6-086-01/503-61-001-18) of Medical University of Lodz.
Disclosure
The authors report no conflicts of interest in this work.
References
1. Zhou RJ, Xu XY, Liu BX, et al. Growth-inhibitory and chemosensitizing effects of microRNA-31 in human glioblastoma multiforme cells. Int J Mol Med. 2015;36(4):1159–1164. doi:10.3892/ijmm.2015.2312
2. Ledur PF, Onzi GR, Zong H, Lenz G. Culture conditions defining glioblastoma cells behavior: what is the impact for novel discoveries?. Oncotarget. 2017;8(40):69185–69197. doi:10.18632/oncotarget.20193
3. Witusik-Perkowska M, Zakrzewska M, Sikorska B, et al. Glioblastoma-derived cells in vitro unveil the spectrum of drug resistance capability - comparative study of tumour chemosensitivity in different culture systems. Biosci Rep. 2017;37(3). doi:10.1042/BSR20170058
4. Li M, Li J, Liu L, Li W, Yang Y, Yuan J. MicroRNA in Human Glioma. Cancers. 2013;5:1306–1331. doi:10.3390/cancers5041306
5. Wang BC, Ma J. Role of MicroRNAs in Malignant Glioma. Chin Med J. 2015;128:1238–1244. doi:10.4103/0366-6999.156141
6. Luo JW, Wang X, Yang Y, Mao Q. Role of micro-RNA (miRNA) in pathogenesis of glioblastoma. Eur Rev Med Pharmacol Sci. 2015;19(9):1630–1639.
7. Nan L, Yanyang T. Systematic Review of MicroRNAs and its Therapeutic Potential in Glioma. Cancer Transl Med. 2015;1(1):50–66. doi:10.4103/2395-3977.155924
8. Mizoguchi M, Guan Y, Yoshimoto K. Clinical implications of microRNAs in human glioblastoma. Front Oncol. 2013;3:19. doi:10.3389/fonc.2013.00019
9. Blower PE, Chung JH, Verducci JS. MicroRNAs modulate the chemosensitivity of tumour cells. Mol Cancer Ther. 2008;7(1). doi:10.1158/1535-7163.MCT-07-2370
10. Giovannetti E, Erozenci A, Smit J, Danesi R, Peters GJ. Molecular mechanisms underlying the role of microRNAs (miRNAs) in anticancer drug resistance and implications for clinical practice. Crit Rev Oncol Hematol. 2012;81:103–122. doi:10.1016/j.critrevonc.2011.03.010
11. McNamara MG, Sahebjam S, Mason WP. Emerging biomarkers in glioblastoma. Cancers (Basel). 2013;5(3):1103–1119. doi:10.3390/cancers5031103
12. Lao Z, Kelly CJ, Yang XY. Improved Methods to Generate Spheroid Cultures from Tumour Cells, Tumour Cells & Fibroblasts or Tumour-Fragments: microenvironment, Microvesicles and miRNA. PLoS One. 2015. doi:10.1371/journal.pone.0133895
13. Rafiee MR, Malekzadeh Shafaroudi A. Enrichment of A Rare Subpopulation of miR-302-Expressing Glioma Cells by Serum Deprivation. Cell J. 2015;16(4):494–505.
14. Nam EJ, Lee M, Yim GW. MicroRNA profiling of a CD133(+) spheroid-forming subpopulation of the OVCAR3 human ovarian cancer cell line. BMC Med Genomics. 2012;5:18. doi:10.1186/1755-8794-5-18
15. Louis DN, Perry A, Reifenberger G. The World Health Organization Classification of Tumours of the Central Nervous System: a summary. Acta Neuropathol. 2016;131(6):803–820. doi:10.1007/s00401-016-1545-1
16. Pastor DM, Poritz LS, Olson TL. Primary cell lines: false representation or model system? a comparison of four human colorectal tumours and their coordinately established cell lines. Int J Clin Exp Med. 2010;3(1):69–83.
17. Witusik-Perkowska M, Zakrzewska M, Szybka M. Astrocytoma-associated antigens - IL13Rα2, Fra-1, and EphA2 as potential markers to monitor the status of tumour-derived cell cultures in vitro. Cancer Cell Int. 2014;14:82.
18. Livak KJ, Schmittgen TD. Analysis of relative gene expression data using real-time quantitative PCR and the 2(-Delta Delta C(T)). Method. Methods.. 2001;25(4):402–408. doi:10.1006/meth.2001.1262
19. Wilhelm J, Pingoud A. Real-time polymerase chain reaction. Chembiochem. 2003;4(11):1120–1128. doi:10.1002/cbic.200300662
20. Perez-Llamas C, Lopez-Bigas N, Aerts S. Gitools: analysis and Visualisation of Genomic Data Using Interactive Heat-Maps. PLoS One. 2011;6:e19541. doi:10.1371/journal.pone.0019541
21. Suzuki R, Shimodaira H. Pvclust: an R package for assessing the uncertainty in hierarchical clustering. Bioinformatics. 2006;22(12):1540–1542. doi:10.1093/bioinformatics/btl117
22. Benjamini Y, Hochberg Y. Controlling The False Discovery Rate - A Practical And Powerful Approach To Multiple Testing. J Royal Statist Soc. 1995;57:289–300. Series B..
23. Hamberg M, Backes C, Fehlmann T, et al. MiRTargetLink–miRNAs, Genes and Interaction Networks. Int J Mol Sci. 2016;17(4):564. doi:10.3390/ijms17040564
24. Stöckel D, Kehl T, Trampert P, et al. Multi-omics Enrichment Analysis using the GeneTrail2 Web Service. Bioinformatics. 2016;32:1502–1508. doi:10.1093/bioinformatics/btv770
25. Chen J, Fu X, Wan Y, Wang Z, Jiang D, Shi L. miR-125b inhibitor enhance the chemosensitivity of glioblastoma stem cells to temozolomide by targeting Bak1. Tumour Biol. 2014;35(7):6293–6302. doi:10.1007/s13277-014-1821-4
26. Haemmig S, Baumgartner U, Glück A, et al. miR-125b controls apoptosis and temozolomide resistance by targeting TNFAIP3 and NKIRAS2 in glioblastomas. Cell Death Dis. 2014;5:e1279. doi:10.1038/cddis.2014.245
27. Shi L, Zhang S, Feng K, et al. MicroRNA-125b-2 confers human glioblastoma stem cells resistance to temozolomide through the mitochondrial pathway of apoptosis. Int J Oncol. 2012;40(1):119–129. doi:10.3892/ijo.2011.1179
28. Shi L, Wan Y, Sun G, Zhang S, Wang Z, Zeng Y. miR-125b inhibitor may enhance the invasion-prevention activity of temozolomide in glioblastoma stem cells by targeting PIAS3. BioDrugs. 2014;28(1):41–54. doi:10.1007/s40259-013-0053-2
29. Chen H, Li X, Li W, Zheng H. miR-130a can predict response to temozolomide in patients with glioblastoma multiforme, independently of O6-methylguanine-DNA methyltransferase. J Transl Med. 2015;13:69. doi:10.1186/s12967-015-0541-x
30. Zhang HD, Jiang LH, Sun DW, Li J, Ji ZL. The role of miR-130a in cancer. Breast Cancer. 2017;24(4):521–527. doi:10.1007/s12282-017-0776-x
31. Shi L, Chen J, Yang J, Pan T, Zhang S, Wang Z. MiR-21 protected human glioblastoma U87MG cells from chemotherapeutic drug temozolomide induced apoptosis by decreasing Bax/Bcl-2 ratio and caspase-3 activity. Brain Res. 2010;1352:255–264. doi:10.1016/j.brainres.2010.07.009
32. Wong ST, Zhang XQ, Zhuang JT, Chan HL, Li CH, Leung GK. MicroRNA-21 inhibition enhances in vitro chemosensitivity of temozolomide-resistant glioblastoma cells. Anticancer Res. 2012;32(7):2835–2841.
33. Zhang S, Wan Y, Pan T, et al. MicroRNA-21 inhibitor sensitizes human glioblastoma U251 stem cells to chemotherapeutic drug temozolomide. J Mol Neurosci. 2012;47(2):346–356. doi:10.1007/s12031-012-9759-8
34. Chen L, Zhang J, Han L, et al. Downregulation of miR-221/222 sensitizes glioma cells to temozolomide by regulating apoptosis independently of p53 status. Oncol Rep. 2012;27(3):854–860. doi:10.3892/or.2011.1535
35. Yang JK, Yang JP, Tong J, et al. Exosomal miR-221 targets DNM3 to induce tumour progression and temozolomide resistance in glioma. J Neurooncol. 2017;131(2):255–265. doi:10.1007/s11060-016-2308-5
36. Brognara E, Fabbri E, Montagner G, et al. High levels of apoptosis are induced in human glioma cell lines by co-administration of peptide nucleic acids targeting miR-221 and miR-222. Int J Oncol. 2016;48(3):1029–1038. doi:10.3892/ijo.2015.3308
37. Quintavalle C, Mangani D, Roscigno G, et al. MiR-221/222 target the DNA methyltransferase MGMT in glioma cells. PLoS One. 2013;8(9):e74466. doi:10.1371/journal.pone.0074466
38. She X, Yu Z, Cui Y, et al. miR-128 and miR-149 enhance the chemosensitivity of temozolomide by Rap1B-mediated cytoskeletal remodeling in glioblastoma. Oncol Rep. 2014;32(3):957–964. doi:10.3892/or.2014.3318
39. Lee D, Sun S, Zhang XQ, et al. MicroRNA-210 and Endoplasmic Reticulum Chaperones in the Regulation of Chemoresistance in Glioblastoma. J Cancer. 2015;6(3):227–232. doi:10.7150/jca.10765
40. Slaby O, Lakomy R, Fadrus P, et al. MicroRNA-181 family predicts response to concomitant chemoradiotherapy with temozolomide in glioblastoma patients. Neoplasma. 2010;57(3):264–269.
41. She X, Yu Z, Cui Y, et al. miR-181 subunits enhance the chemosensitivity of temozolomide by Rap1B-mediated cytoskeleton remodeling in glioblastoma cells. Med Oncol. 2014;31(4):892. doi:10.1007/s12032-014-0374-0
42. Hassan A, Mosley J, Singh S, Zinn PO. A Comprehensive Review of Genomics and Noncoding RNA in Gliomas. Top Magn Reson Imaging. 2017;26(1):3–14. doi:10.1097/RMR.0000000000000111
43. Shea A, Harish V, Afzal Z, et al. MicroRNAs in glioblastoma multiforme pathogenesis and therapeutics. Cancer Med. 2016;5(8):1917–1946. doi:10.1002/cam4.775
44. Visani M, de Biase D, Marucci G, Taccioli C, Baruzzi A, Pession A,
45. Inagaki A, Soeda A, Oka N. Long-term maintenance of brain tumour stem cell properties under at non-adherent and adherent culture conditions. Biochem Biophys Res Commun. 2007;361(3):586–592. doi:10.1016/j.bbrc.2007.07.037
46. Pollard SM, Yoshikawa K, Clarke ID. Glioma stem cell lines expanded in adherent culture have tumour-specific phenotypes and are suitable for chemical and genetic screens. Cell Stem Cell. 2009;4(6):568–580. doi:10.1016/j.stem.2009.03.014
47. Potter NE, Phipps K, Harkness W. Astrocytoma derived short-term cell cultures retain molecular signatures characteristic of the tumour in situ. Exp Cell Res. 2009;315(16):2835–2846. doi:10.1016/j.yexcr.2009.06.003
48. Fael Al-Mayhani TM, Ball SL, Zhao JW. An efficient method for derivation and propagation of glioblastoma cell lines that conserves the molecular profile of their original tumours. J Neurosci Methods. 2009;176(2):192–199. doi:10.1016/j.jneumeth.\2008.07.022
49. Wakimoto H, Mohapatra G, Kanai R. Maintenance of primary tumour phenotype and genotype in glioblastoma stem cells. Neuro Oncol. 2012;14(2):132–144. doi:10.1093/neuonc/nor195
50. Qiu B, Zhang D, Tao J, Wu A, Wang Y. A simplified and modified procedure to culture brain glioma stem cells from clinical specimens. Oncol Lett. 2012;3(1):50–54. doi:10.3892/ol.2011.433
51. Denysenko T, Gennero L, Juenemann C. Heterogeneous phenotype of human glioblastoma: in vitro study. Cell Biochem Funct. 2014;32(2):164–176. doi:10.1002/cbf.2988
52. Rappa G, Mercapide J, Anzanello F. Growth of cancer cell lines under stem cell-like conditions has the potential to unveil therapeutic targets. Exp Cell Res. 2008;314(10):2110–2122. doi:10.1016/j.yexcr.2008.03.008
53. Wang S, Jiao B, Geng S, Song J, Liang Z, Lu S. Concomitant microRNA-31downregulation and radixin upregulation predicts advanced tumour progression andunfavorable prognosis in patients with gliomas. J Neurol Sci. 2014;338(1–2):71–76. doi:10.1016/j.jns.2013.12.019
54. Hua D, Ding D, Han X, et al. HumanmiR-31 targets radixin and inhibits migration and invasion of glioma cells. OncolRep. 2012;27(3):700–706.
55. Rajbhandari R, McFarland BC, Patel A, et al. Loss of tumour suppressive microRNA-31 enhances TRADD/NF-κB signaling in glioblastoma. Oncotarget. 2015;6(19):17805–17816. doi:10.18632/oncotarget.4596
56. Singh SK, Vartanian A, Burrell K, Zadeh G. A microRNA Link to Glioblastoma Heterogeneity. Cancers (Basel). 2012;4(3):846–872. doi:10.3390/cancers4030846
57. Stepicheva NA, Song JL. Function and regulation of microRNA-31 in development and disease. Mol Reprod Dev. 2016;83(8):654–674. doi:10.1002/mrd.22678
58. Meares GP, Rajbhandari R, Gerigk M, et al. MicroRNA-31 is required for astrocyte specification. Glia. 2018;66(5):987–998. doi:10.1002/glia.23296
59. Wong HA, Fatimy RE, Onodera C, et al. The Cancer Genome Atlas Analysis Predicts MicroRNA for Targeting Cancer Growth and Vascularization in Glioblastoma. Mol Ther. 2015;23(7):1234–1247. doi:10.1038/mt.2015.72
60. Kim TM, Huang W, Park R, Park PJ, Johnson MD. A developmental taxonomy ofglioblastoma defined and maintained by MicroRNAs. Cancer Res. 2011;71(9):3387–3399. doi:10.1158/0008-5472.CAN-10-4117
61. Aldaz B, Sagardoy A, Nogueira L, et al. Involvement of miRNAs in the differentiation of human glioblastoma multiforme stem-like cells. PLoS One. 2013;8(10):e77098. doi:10.1371/journal.pone.0077098
62. Rieske P, Golanska E, Zakrzewska M, et al. Arrested neural and advanced mesenchymal differentiation of glioblastoma cells-comparative study with neural progenitors. BMC Cancer. 2009;9:54. doi:10.1186/1471-2407-9-54
63. Lee SY. Temozolomide resistance in glioblastoma multiforme. Genes Dis. 2016;3(3):198–210. doi:10.1016/j.gendis.2016.04.007
64. Shi J, Dong B, Zhou P, Guan W, Peng Y. Functional network analysis of gene-phenotype connectivity associated with temozolomide. Oncotarget. 2017;8(50):87554–87567. doi:10.18632/oncotarget.v8i50
65. Messaoudi K, Clavreul A, Lagarce F. Toward an effective strategy in glioblastoma treatment. Part I: resistance mechanisms and strategies to overcome resistance of glioblastoma to temozolomide. Drug Discov Today. 2015;20(7):899–905. doi:10.1016/j.drudis.2015.02.011
66. Zhang CZ, Zhang JX, Zhang AL, et al. MiR-221 and miR-222 target PUMA to induce cell survival in glioblastoma. Mol Cancer. 2010;9:229. doi:10.1186/1476-4598-9-254
67. Chun-Zhi Z, Lei H, An-Ling Z, et al. MicroRNA-221 and microRNA-222 regulate gastric carcinoma cell proliferation and radioresistance by targeting PTEN. BMC Cancer. 2010;10:367. doi:10.1186/1471-2407-10-663
68. Inaba N, Kimura M, Fujioka K, et al. The effect of PTEN on proliferation and drug-, and radiosensitivity in malignant glioma cells. Anticancer Res. 2011;31(5):1653–1658.
69. Papagiannakopoulos T, Shapiro A, Kosik KS. MicroRNA-21 targets a network of key tumor-suppressive pathways in glioblastoma cells. Cancer Res. 2008;68(19):8164–8172. doi:10.1158/0008-5472.CAN-08-1305
70. Ananta JS, Paulmurugan R, Massoud TF. Nanoparticle-Delivered Antisense MicroRNA-21 Enhances the Effects of Temozolomide on Glioblastoma Cells. Mol Pharm. 2015;12(12):4509–4517. doi:10.1021/acs.molpharmaceut.5b00694
71. Zhang Y, Dube C, Gibert M
72. Fornari F, Milazzo M, Galassi M, et al. p53/mdm2 feedback loop sustains miR-221 expression and dictates the response to anticancer treatments in hepatocellular carcinoma. Mol Cancer Res. 2014;12(2):203–216. doi:10.1158/1541-7786.MCR-13-0312-T
 © 2019 The Author(s). This work is published and licensed by Dove Medical Press Limited. The
full terms of this license are available at https://www.dovepress.com/terms
and incorporate the Creative Commons Attribution
- Non Commercial (unported, 3.0) License.
By accessing the work you hereby accept the Terms. Non-commercial uses of the work are permitted
without any further permission from Dove Medical Press Limited, provided the work is properly
attributed. For permission for commercial use of this work, please see paragraphs 4.2 and 5 of our Terms.
© 2019 The Author(s). This work is published and licensed by Dove Medical Press Limited. The
full terms of this license are available at https://www.dovepress.com/terms
and incorporate the Creative Commons Attribution
- Non Commercial (unported, 3.0) License.
By accessing the work you hereby accept the Terms. Non-commercial uses of the work are permitted
without any further permission from Dove Medical Press Limited, provided the work is properly
attributed. For permission for commercial use of this work, please see paragraphs 4.2 and 5 of our Terms.