Back to Journals » Infection and Drug Resistance » Volume 14
Artificial Intelligence Clinicians Can Use Chest Computed Tomography Technology to Automatically Diagnose Coronavirus Disease 2019 (COVID-19) Pneumonia and Enhance Low-Quality Images
Authors Zhang Q, Chen Z, Liu G, Zhang W, Du Q, Tan J, Gao Q
Received 8 December 2020
Accepted for publication 21 January 2021
Published 24 February 2021 Volume 2021:14 Pages 671—687
DOI https://doi.org/10.2147/IDR.S296346
Checked for plagiarism Yes
Review by Single anonymous peer review
Peer reviewer comments 4
Editor who approved publication: Professor Suresh Antony
Quan Zhang,1,2 Zhuo Chen,1 Guohua Liu,1,2 Wenjia Zhang,1,2 Qian Du,1,2 Jiayuan Tan,1,2 Qianqian Gao1,2
1College of Electronic Information and Optical Engineering, Nankai University, Tianjin, 300350, People’s Republic of China; 2Tianjin Key Laboratory of Optoelectronic Sensor and Sensing Network Technology, Nankai University, Tianjin, 300350, People’s Republic of China
Correspondence: Guohua Liu Tel +86-22-85358565
Email [email protected]
Purpose: Nowadays, the number of patients with COVID-19 pneumonia worldwide is still increasing. The clinical diagnosis of COVID-19 pneumonia faces challenges, such as the difficulty to perform RT-PCR tests in real time, the lack of experienced radiologists, clinical low-quality images, and the similarity of imaging features of community-acquired pneumonia and COVID-19. Therefore, we proposed an artificial intelligence model GARCD that uses chest CT images to assist in the diagnosis of COVID-19 in real time. It can show better diagnostic performance even facing low-quality CT images.
Methods: We used 14,129 CT images from 104 patients. A total of 12,929 samples were used to build artificial intelligence models, and 1200 samples were used to test its performance. The image quality improvement module is based on the generative adversarial structure. It improves the quality of the input image under the joint drive of feature loss and content loss. The enhanced image is sent to the disease diagnosis model based on residual convolutional network. It automatically extracts the semantic features of the image and then infers the probability that the sample belongs to COVID-19. The ROC curve is used to evaluate the performance of the model.
Results: This model can effectively enhance the low-quality image and make the image that is difficult to be recognized become recognizable. The model proposed in this paper reached 97.8% AUC, 96.97% sensitivity and 91.16% specificity in an independent test set. ResNet, GADCD, CNN, and DenseNet achieved 80.9%, 97.3%, 70.7% and 85.7% AUC in the same test set, respectively. By comparing the performance with related works, it is proved that the model proposed has stronger clinical usability.
Conclusion: The method proposed can effectively assist doctors in real-time detection of suspected cases of COVID-19 pneumonia even faces unclear image. It can quickly isolate patients in a targeted manner, which is of positive significance for preventing the further spread of COVID-19 pneumonia.
Keywords: coronavirus disease 2019, artificial intelligence, low-quality image enhancement, auxiliary diagnosis, deep learning
Introduction
At present, the number of patients infected with coronavirus disease 2019 (COVID-19) pneumonia is still increasing all over the world. On January 30, 2020, the World Health Organization (WHO) declared COVID-19 pneumonia to be a public health emergency.1 On March 11, 2020, the WHO announced a global pandemic of COVID-19.2 As of November 15, 2020, there are 53,766,728 confirmed cases of COVID-19 pneumonia worldwide, resulting in 1,308,975 deaths.3 With the continuous spread of the virus, medical resources are also facing a shortage.4
Although the reverse transcription-polymerase chain reaction (RT-PCR) technology is an important basis for diagnosing COVID-19 currently,5 it still has strong limitations. (1) The production of kits is limited, and the outbreak base is huge, so the supply of kits is difficult to meet the actual demand. (2) The test requires the extraction of the patient’s respiratory or blood samples, which increases the exposure risk of medical staff.6,7 (3) There are false negatives in the test results, and the test results are related to the attributes of a given population.5,8 (4) RT-PCR detection has very strict requirements on implementation methods and storage conditions, which intensifies the contradiction of lack of medical resources.9
Chest CT scan has been proven to be a reliable tool to assist in the diagnosis of COVID-19.10–12 Through analyzing 50,466 hospitalized patients, 97% of COVID-19 patients reported abnormal chest CT.13 The typical imaging features of COVID-19 include ground-glass opacity, mixed lesions with consolidation and paving stone signs, flaky fibrosis, etc.14 Patients are more likely to be bilaterally involved.15 Compared with RT-PCR testing, which requires strict implementation conditions, chest CT imaging examinations are easy to implement and obtain faster results, which are more beneficial to prevent the further spread of COVID-19 pneumonia.16
Although chest CT scan has been used as an important method to assist in the diagnosis of COVID-19 pneumonia, it still faces challenges. According to the WHO report, the number of newly confirmed cases in a single day globally has hit a new high. With the huge base of patients and the lack of professional radiologists, the workload of manually recognizing CT images has become increasingly difficult to afford. At the same time, the difference in detection environment, scanning parameters, image storage and transmission mode will make the resolution of the image is difficult to guarantee. The reduction in resolution will cause the image to become blurred and difficult to be recognized. The characteristics of the lesions in low-quality images are not clear, so it is difficult to obtain accurate diagnosis results using these data. If the image quality is excessively required, it will reduce the efficiency of diagnosis and increase the demand for resources of computing, storage and transmission resources, which is not conducive to curbing the further spread of COVID-19 pneumonia. At present, the global medical resources are facing status of uneven distribution, it is difficult for some regions to meet the demands of large-scale testing.17 The existing automatic diagnosis methods mostly clean the data before constructing the algorithm, ignoring the low-quality images in the clinic, which limits the clinical applicability of the auxiliary diagnosis method. In addition, in clinical studies, it has also been reported that the CT features of patients with community-acquired pneumonia may be similar to COVID-19, which also increases the difficulty of clinical diagnosis of COVID-19 pneumonia. Although these characteristics may be well distinguished by experts with rich experience in relevant fields, it is still a challenge in the condition of the absence of high-quality medical resources.18 Therefore, if we can automatically and accurately diagnose COVID-19 pneumonia using low-quality chest CT images, it will be of positive significance for the prevention and control of this global epidemic.
Numerous classification and segmentation algorithms combined with artificial intelligence technology have made a huge breakthrough in the processing and analysis of medical images.19–24 These methods can achieve similar performance to human experts in a short time. However, for medical images, image-enhancing techniques like smoothing25 and super-resolution26 are rarely used. Specifically for super-resolution, generative adversarial network has been proven to be an advanced algorithm that can extract semantic features of images and improve the resolution of low-quality data.27 The semantic features of medical images are very important for the identification of disease types. Therefore, compared with traditional algorithms of coding and filter, the generative adversarial network can process CT images better. In terms of disease diagnosis, artificial intelligence models need to determine the health status of samples through the semantic features of CT images. The residual convolution structure can help the artificial intelligence model to grasp different scales semantic features of the image more precisely, which is beneficial to improve the performance of the diagnosis of COVID-19 pneumonia.28
This paper proposed an automatic diagnosis method of COVID-19 pneumonia based on artificial intelligence. Even in the face of low-quality CT images or community-acquired pneumonia with similar characteristics, the model can also give accurate diagnosis results. Compared with existing methods, the method proposed in this paper can also accurately diagnose the low-quality images that exist in the clinic. This makes the model in this paper have a higher potential for clinical application. In addition, this paper uses double loss to jointly guide image restoration. This method prevents the model from losing detailed features while repairing the image to a certain extent, it is more suitable for medical images with features of tiny lesions compared with existing methods that only use content deviation. By comparing the performance of related work, it proves the potential of the method proposed to be used in the clinical diagnosis of COVID-19. The image quality improvement module based on the generation adversarial network can repair and enhance the lesion features of low-quality images and generate high-quality images. The output high-quality images are sent to a disease diagnosis model based on residual convolutional networks to automatically diagnose COVID-19 pneumonia in real time. The existing automatic diagnosis methods mostly clean the data before constructing the algorithm, ignoring the low-quality images in the clinic, which limits the clinical applicability of the auxiliary diagnosis method. The artificial intelligence model proposed in this paper that can recognize low-quality CT images has stronger clinical application potential.
Materials and Methods
Data Description
This is a retrospective study, the data used in the experiment are all chest CT images.29 Due to limited computing resources, this study randomly selected part of the data from the original data set instead of using all the data. In this study, the data includes 14,129 images from 104 patients. Among them, there are 61 confirmed COVID-19 patients (positive) and 43 non-COVID-19 patients (negative). A positive sample refers to a patient diagnosed with COVID-19. Negative samples refer to non-COVID-19 patients. Negative samples include community-acquired pneumonia and normal samples. All patients were confirmed by RT-PCR. All patients were in a supine position, and the patients had received breathing training before the scan. During the scan, the patient was asked to hold breath. The scan range is from the tip of the lung to the lower edge of the ribs. A total of 12,929 samples were used to build the artificial intelligence model, and 1200 samples were used to test the final performance of the algorithm. All samples are randomly selected from the raw data. Training samples and test samples are independent of each other, there is no overlap. During training, we used 10-fold cross-validation. This means that the above training samples are again divided into two parts: 90% of the training samples are used to update the model parameters, and the remaining 10% of the samples are used to verify the temporary performance of the model. This method can help us adjust the hyperparameters of the model. Finally, independent test set data are used to test the final performance of the model. The training set contains 4000 positive samples and 8929 negative samples. Testing set includes 400 positive samples and 800 negative samples. All patients were confirmed by RT-PCR. Each CT image is diagnosed by more than 3 human experts. Each CT image shows evidence of COVID-19. At the same time, the above-mentioned radiologists also reviewed CT images of community-acquired pneumonia. The thickness of all CT slices is 1.25–2mm. The above data have been anonymized. More details and more specific ethical disclosure can be obtained from public reference.29 The image is shown in Figure 1.
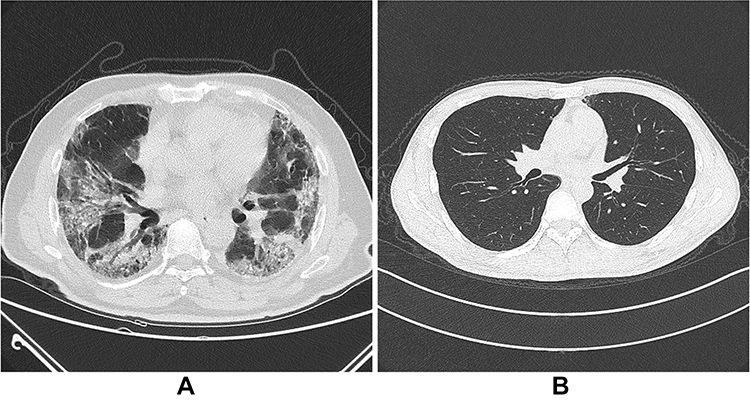 |
Figure 1 The chest CT image dataset (A is COVID-19, B is non-COVID-19). |
Overall Model
This paper proposed a generative adversarial residual convolution diagnostic (GARCD) model. The experiment platform is a workstation with an NVIDIA GTX 1080Ti GPU. All artificial intelligence methods are implemented in Keras. The model includes two modules, the image quality improvement module and the disease diagnosis module. The quality improvement module is located before the disease diagnosis module. The core of the image quality enhancement module is the Generative Adversarial Networks, its purpose is to repair and enhance semantic features and improve image quality. The adversarial neural network uses the adversarial process to train two neural networks, one is responsible for generating high-quality images, the other network is responsible for judging whether the image is a generated image. Adopt a confrontational approach to make the model generate high-quality images. This allows the model to identify unclear images produced by various reasons in the clinical diagnosis process. In addition, multiple losses are used to guide the model to repair low-quality images. Traditional methods use content loss to guide model parameter updates, which is not suitable for chest CT images with features of small lesions. Therefore, while using content loss, this paper also uses feature loss to guide the model parameter optimization process. The core of the disease diagnosis module is the residual convolutional network. With the increase in the number of neural network layers, it is difficult for the traditional artificial intelligence model to make the classifier grasp the primary tiny features of CT images. However, for medical images, different scale features have different meanings for disease diagnosis. Therefore, this paper uses a short-circuit based residual structure. Its purpose is to enable the model to automatically extract the semantic features of the processed data and complete the diagnosis of COVID-19 pneumonia based on them. The residual structure can help the model better understand the influence of features of different scales on the diagnosis results. At the same time, it can also make the gradient flow better and facilitate the optimization of global parameters. Therefore, in order for the model to diagnose low-quality images that exist in the clinic, GARCD may be a good choice. Ten-fold cross-validation was used during the experiment. The training sample is again randomly divided into two parts. Ninety percent of the samples are used to update the parameters of the model, and the remaining ten percent of the samples are used to verify the temporary performance of the model. This strategy helps us adjust the hyperparameters of the model. Finally, an independent test set is used to evaluate the final performance of the model. The overall process is shown in Figure 2.
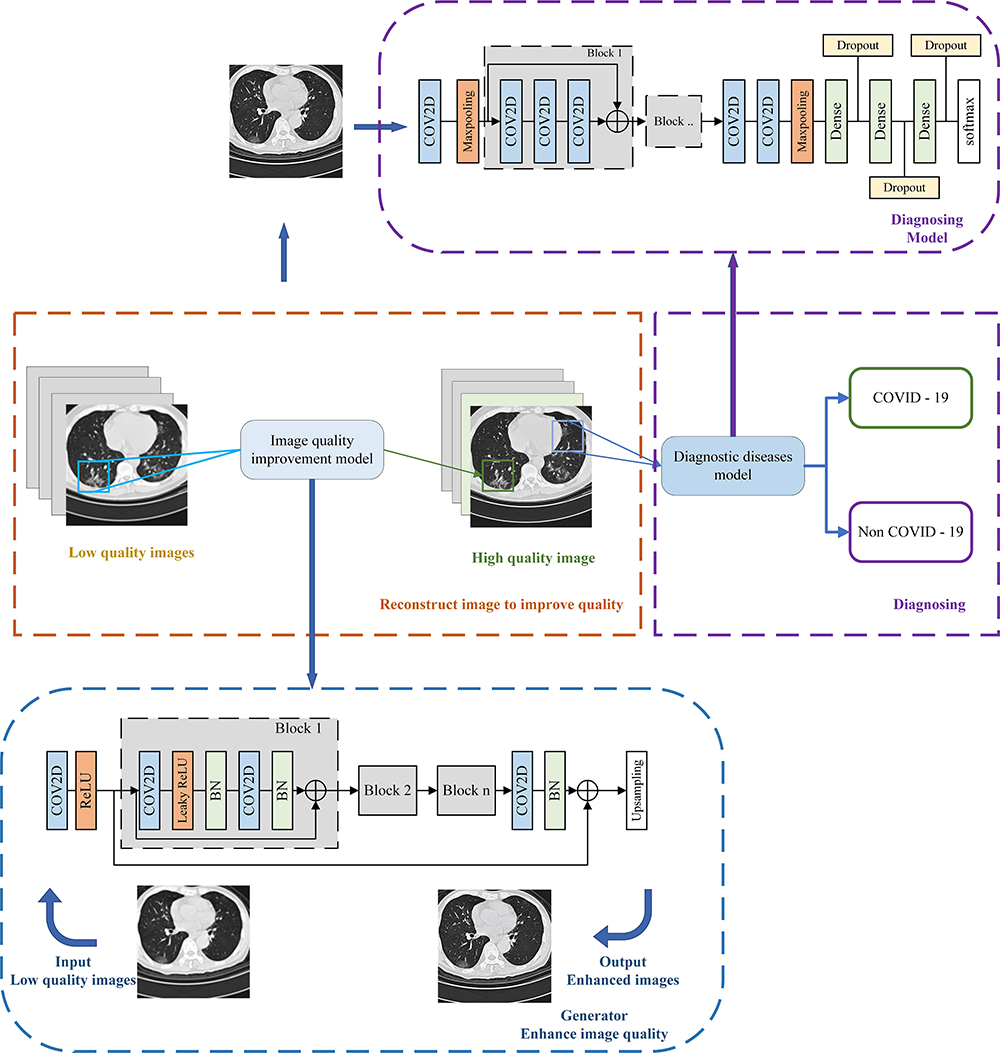 |
Figure 2 The overall schematic diagram of GARCD. |
Image Quality Improvement Module
The core of the image quality improvement module is Generative Adversarial Networks. The generative adversarial networks consist of two networks. The generator is responsible for generating high-quality images, and the discriminator is responsible for judging the quality of the generated images. In this way, the generative adversarial networks can be used to repair the low-quality images that exist in the clinic. In this study, the discriminator uses the VGG19 structure. The generator model uses a convolutional neural network based on the residual structure. The generator includes a total of 16 residual convolution blocks. The image is processed by a convolutional layer and then sent to 16 consecutive residual convolutional blocks for processing. Each residual convolution block consists of two convolutional layers and two batch normalization layers. After the data is processed by the residual convolution block, it is processed by the convolution layer and the batch normalization layers. Finally, after up-sampling, the image is processed to the desired size. In this paper, we also added a feature extraction module to make the generative adversarial networks capable of recognizing tiny features of medical images. This strategy can prevent the model from losing tiny disease features to a certain extent when repairing low-quality images. The detailed structure of the image quality improvement module is shown in Figure 3. It can be used to improve image quality. During the training process, the Adam optimizer is used to update the global parameters of the discriminator and generator. During training processing, low-quality images are obtained by down-sampling the target image. This process simulates the low-quality images that exist in the clinic. The down-sampling tool used in this experiment is OpenCV, down-sampling factor is 4. Up-sampling layer enhances the image to the target size.
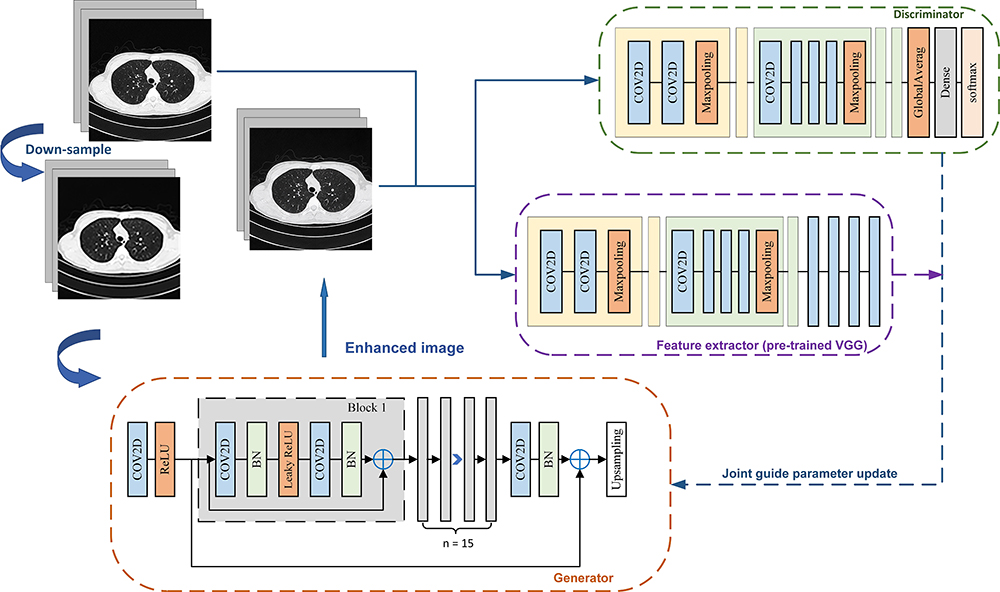 |
Figure 3 Schematic diagram of the image quality improvement module. |
Many state-of-art methods usually use the mean square error (MSE) or cross-entropy loss to measure the content deviation between the generated image and the original image and then use the back-propagation algorithm to update the global parameters of the model, as shown in Equation (1).
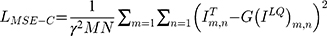
where  is the content deviation based on MSE,
  is sampling coefficient,
  represents the size of the images,
  means target image,
  is generator,
  means low-quality image.
These methods measure the repair degree of CT images according to the global content deviation and use this deviation to guide the model global parameter update. Although the above method is widely used in various fields, it is obviously inappropriate for medical CT images with many subtle semantic features30 as shown in Figure 4.
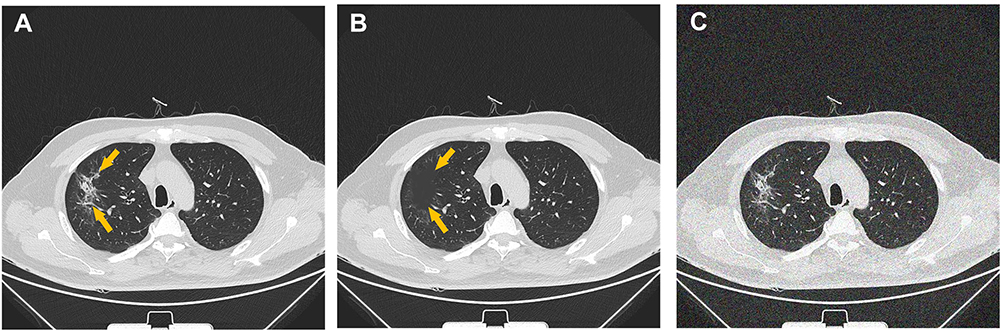 |
Figure 4 CT images processed by different methods (A is raw data. B is image with missing lesion features. C is image with Gaussian noise. We compare the differences between the processed image and the original image to determine whether MSE, PSNR and SSIM are suitable to guide the optimization of the model’s global parameters. MSE means mean squared error, PSNR means peak signal-to-noise ratio, SSIM means structural similarity.The arrow points to the lesion.). |
The calculation method of PSNR and SSIM is shown in Equation (2) and Equation (3).
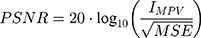
where  means maximum image pixel value.
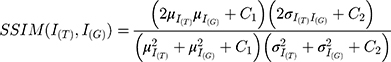
In Equation (3),  is target image,
  is generated image,
  means the average of pixels,
  means the variance of pixels.
Figure 4A is the original image, Figure 4B is the image after occluding the lesion features, and Figure 4C is the image after adding Gaussian noise. The mean square error (MSE), peak signal-to-noise ratio (PSNR), and structural similarity (SSIM) between each image are shown in Table 1.
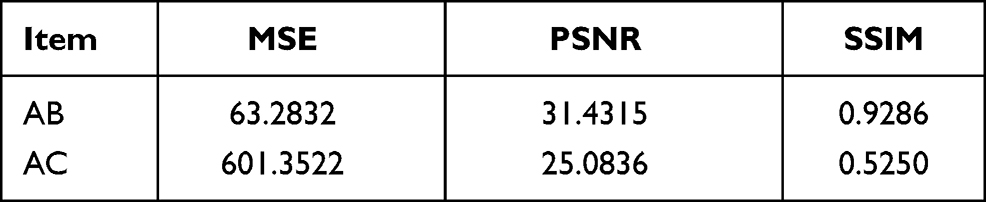 |
Table 1 MSE, PSNR, SSIM Between Different Images |
As shown in Table 1, all indicators show that the quality of Figure 4B is better than that of Figure 4C. However, it is obvious that Figure 4B misses important lesion features. Yet the subtle features of the lesion are more important for determining the type of disease. In the actual clinical process, researchers prefer to get Figure 4C rather than Figure 4B with higher indicators. Using traditional content deviations to guide artificial intelligence models to repair images may lead to the model neglecting the extraction and repair of detail features in order to pursue higher indicators. This is not conducive to improve the quality of CT images and the disease diagnosis module to distinguish the health type of samples. Therefore, the loss function used in this paper adds the feature loss based on the traditional loss function. We let the content deviation and the detailed feature deviation jointly guide the model to complete the repair and enhancement of the chest CT image, instead of letting the model lose the semantic features of the lesion in pursuit of higher indicators. The cost function used in this study is shown in Equation 4. The cost function is used to reversely update the parameters of the generative model.
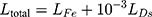
where  is the feature difference between the generated image and the target image,
  is the loss of discriminator. Therefore,
  is feature loss, it measures the feature difference between the generated image and the target image. It can guide the model to repair the image without losing tiny features.
  is adversarial loss. The discriminator judges whether the sample is a real sample. Therefore,
  measures the content loss to a certain extent. The calculation method of
  and
and  is shown in Equation (5) and Equation (6)

where  denotes feature extractor. In this study, pre-trained VGG model was used to be an extractor.

where P denotes probability that the  is considered the target sample.
This research uses transfer learning technology, and the pre-trained VGG19 model is used to extract the semantic features of the generated image and the target image separately. Finally, the differences between the features mentioned above were compared. When extracting features, we frozen all parameters of the VGG19 model pre-trained by Google on ImageNet dataset. The ImageNet dataset includes 14,197,122 images. Therefore, the pre-trained VGG19 model has strong multiple feature extraction capabilities. The final classification layer of the pre-trained VGG19 model is discarded. The output of the last convolution block of the VGG19 model is the extracted image feature. The image quality enhancement module based on dual guidance of feature loss and overall loss will not lose important lesion features in pursuit of better MSE.
During the training process, the Adam is used to optimize global parameters. The parameters β1 and β2 of Adam algorithm are 0.9 and 0.999, respectively. 
 The parameter
  of LeakyReLU is 0.2. The initial learning rate is 0.0002 and the gradient decay method is used to avoid the model from missing the best point. The size of target image is 512
 512. The down-sampling factor is 4, so the size of the down-sampled image is 128
 128. The up-sampling part consists of two convolutional layers. Its purpose is to restore a 128
 128 image to a 512
 512 image. One-hot label is used in the discriminator.
Disease Diagnosis Module
The core of the disease diagnosis module is the residual convolutional network. First, the image is processed by a convolutional layer and then sent to the residual convolution block. The disease diagnosis model in this paper includes four residual convolution blocks. The first two residual convolutional blocks include three convolutional layers, and the remaining two residual convolutional blocks include four convolutional layers. After the data is processed by the residual convolution block, it is sent to two consecutive convolutional layers, and finally processed by three fully connected layers. The network detail structure is shown in Figure 5. Similarly, the Adam optimizer is used for optimizing all parameters of the disease diagnosis model. During training, cross-entropy is used as a cost function. Ten-fold cross-validation is also used during training. At the same time, in order to avoid over-fitting, this paper used dropout technology in the final fully connected layer.
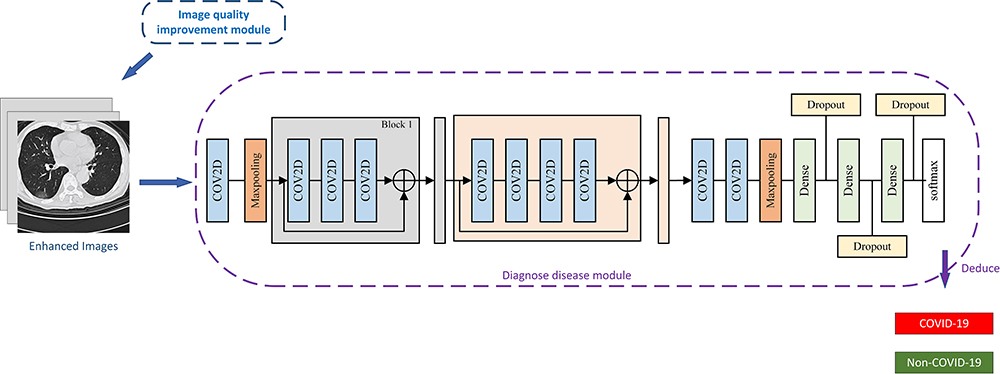 |
Figure 5 Schematic diagram of disease diagnosis module. |
The generated high-quality images are sent to the disease diagnosis module. The model will automatically extract the semantic features of the chest CT image. The partial short-circuit method can make the model more accurately grasp the influence of semantic features of different scales on the diagnosis result, which can improve the diagnosis accuracy of the model.
The classification function is softmax. The label of the data is encoded as one-hot format. COVID-19 is coded as 10, non-COVID-19 is coded as 01. In this study, we did not use a linear classifier. The linear classifier focuses more on learning the linear mapping relationship between the feature vector of the image and the diagnosis result. The nonlinear classifier used in this article infers the possibility that the sample belongs to COVID-19 based on the extracted semantic features. This is closer to the thinking process of human experts. Compared to previous work using linear classifiers,19 nonlinear classifiers may be closer to the way human experts think.
Adam is also the optimizer of the disease diagnosis module. The  and
and  are 0.9 and 0.999, respectively. The parameter
  of LeakyReLU is 0.2. The initial learning rate is 0.001 and the gradient decay method is also used to avoid the model from missing the best point. Enhanced images are used as input (size is 512
 512). The dropout coefficient is 0.8, it means the probability of neurons being randomly dropped is 20%. Where cross-entropy is used as the loss function. In the training process, in order to avoid over-fitting, we used 10-fold cross-validation.
Results
The original data includes 14,129 samples. Among them, 12,929 samples were used to construct the artificial intelligence model, and 1200 samples (400 Positive, 800 negative) were used to test the final performance of the model. We used the ImageNet dataset to initialize the parameters of the image quality improvement module so that the model could reach the desired result faster. Low-quality images are obtained by down-sampling the original image, the down-sampling coefficient is 4, and the down-sampling tool is OpenCV. As shown in Figure 6, based on the generative adversarial network, the image quality improvement module guided by the new loss function can effectively repair the features of chest CT images (including COVID-19 and Non-COVID-19). The improvement of image quality is more conducive to human experts and latter disease diagnosis module to make precise judgments on patient.
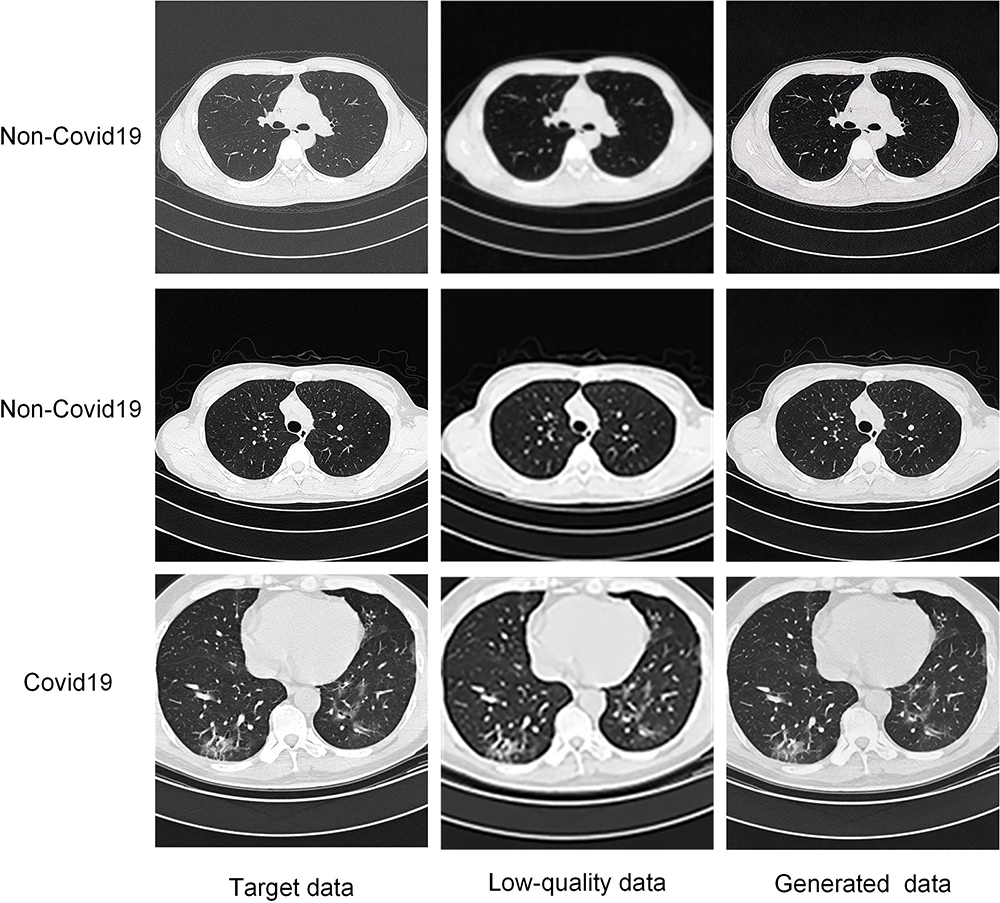 |
Figure 6 Image quality improvement module processing results of low-quality images. |
In order to evaluate the impact of the enhanced images on the radiology researchers, we conducted mean opinion score testing. The evaluation criteria are shown in Table 2.
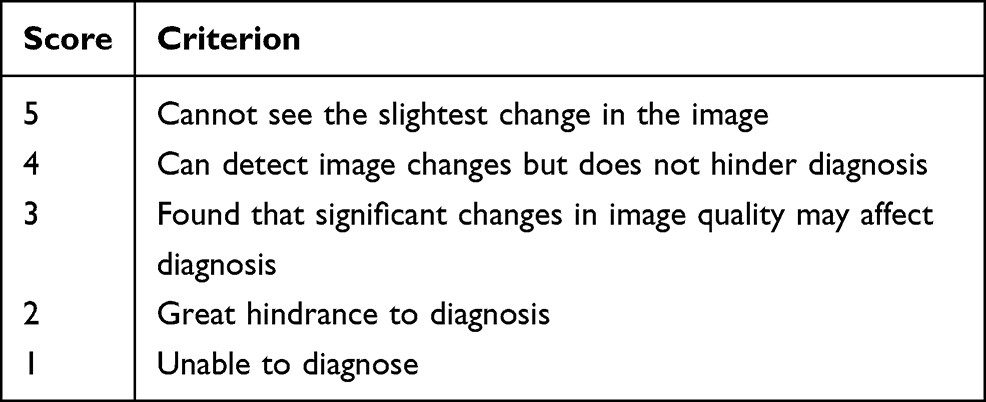 |
Table 2 Evaluation Standard |
Three independent radiology researchers were invited. Each researcher evaluates the quality of 40 random samples according to the above criteria. Images are randomly selected from the test set. In order for each health condition to be evaluated with the same probability, we balanced the data. In other words, each researcher evaluates 20 COVID-19 images and 20 Non-COVID-19 images. Specifically, the above-mentioned pictures include 10 low-quality COVID-19 images, 10 enhanced COVID-19 images, 10 low-quality non-COVID-19 images, and 10 enhanced non-COVID-19 images. The score distribution is shown in Figure 7.
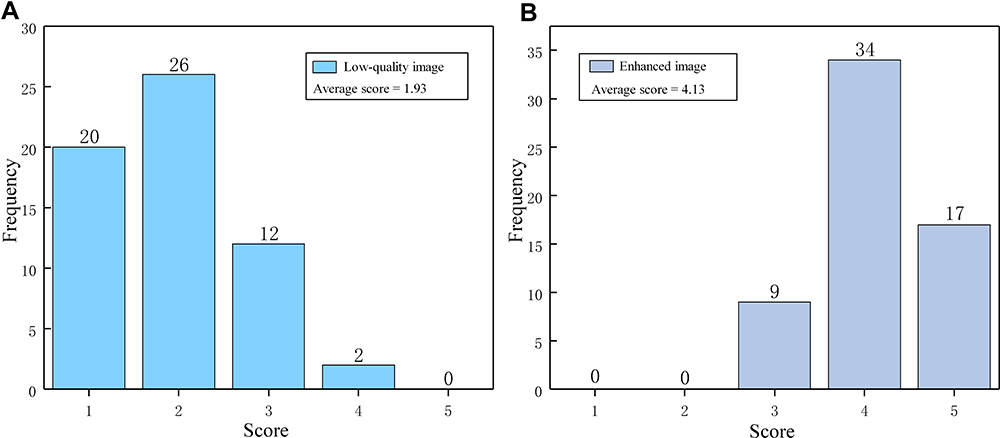 |
Figure 7 Score distribution of low-quality images and enhanced images (A is the score distribution of low-quality images. B is the score distribution of enhanced images. It reflects the auxiliary potential of the image quality improvement module for actual clinical researchers.). |
The average score of pictures enhanced by the image processing module is 4.13. The average score for low-quality images is 1.93. The image quality improvement module increases the average score of low-quality images by 2.2 points. The median scores for enhanced images and low-quality images are 4 and 2, respectively. This shows to a certain extent that the image quality improvement model can better repair low-quality images, so that images that are difficult to be diagnosed can be recognized by human experts or disease diagnosis modules. Finally, image quality images can better improve the low-quality images that exist in the clinic. This allows the subsequent disease diagnosis module to recognize the aforementioned low-quality images. The experimental results show that some enhanced images have a score of 3. We speculate this is due to the extremely low quality of some random samples themselves, it may cause the model to be unable to completely repair them to a very high quality.
The enhanced image is sent to the disease diagnosis module to determine whether the sample belongs to COVID-19. The average loss curve of the training process of the disease diagnosis module based on the residual convolutional network is shown in Figure 8. In order to avoid over-fitting, this study used 10-fold cross-validation to train the model.
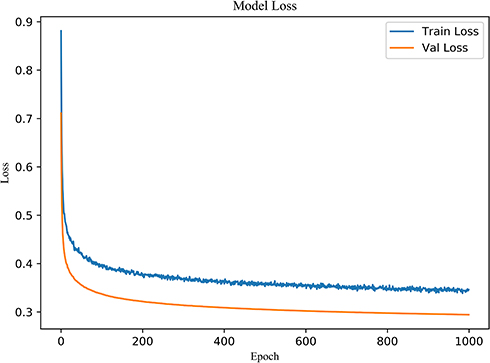 |
Figure 8 The average loss curve of disease diagnosis module in this study using 10-fold cross-validation. |
No over-fitting phenomenon was found during training. AUC is used to evaluate the final performance of the model. We verified the diagnostic ability of the artificial intelligence model proposed in this paper to diagnose COVID-19 pneumonia in a completely independent test set (400 positive cases, 800 negative cases). Meanwhile, the performance of different traditional models in the same test set is compared. Because of the imbalance dataset, ROC metric is used to evaluate model performance. ROC curve can well overcome the problem of imbalance dataset. At the same time, the Precision–Recall curves and Sensitivity–Specificity curves of the models with similar performance are also compared. The ROC curve obtained by different models in the same test set is shown in Figure 9.
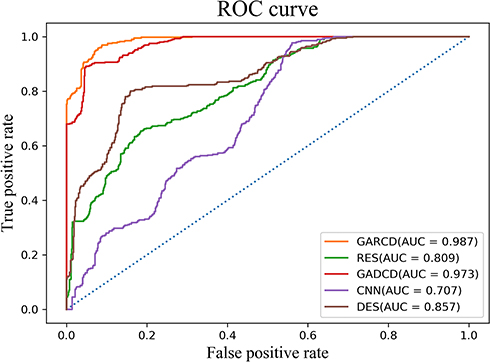 |
Figure 9 ROC curves of different models in the same test dataset. |
Finally, the GARCD proposed in this paper achieved 98.7% AUC in an independent test set. The residual network (ResNet) reached 80.9% AUC. Generating adversarial dense convolution diagnostic (GADCD) model achieved 97.3% AUC. GADCD is to keep the above image quality improvement module unchanged and change the disease diagnosis module to a dense convolutional network (DenseNet). The convolutional neural network reached 70.7% AUC. DenseNet reached 85.7% AUC. The performance of GARCD and GADCD is close, so we use other metrics to further compare the performance of the two models. Precision–Recall curve and Sensitivity–Specificity curve as shown in Figure 10.
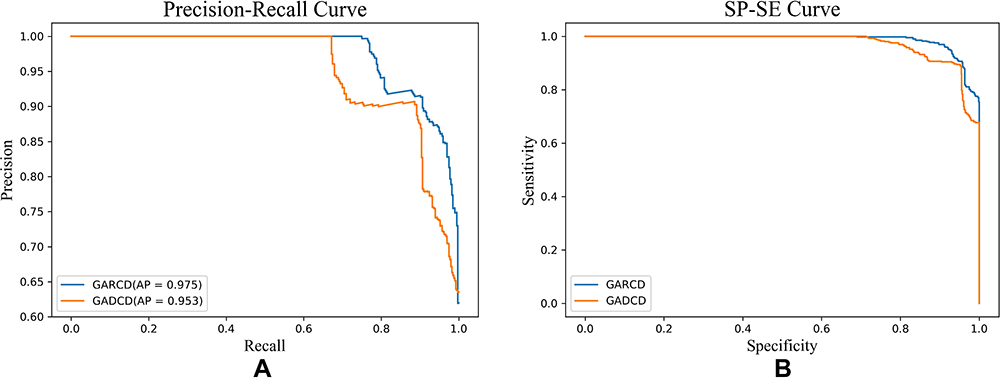 |
Figure 10 Precision-recall curve and sensitivity–specificity curve of different model (A is precision–recall curve of GARCD and GADCD, B is sensitivity–specificity curve of GARCD and GADCD.). |
Discussion
In order to diagnose COVID-19 pneumonia accurately and automatically, reduce the workload of medical workers and reduce the cost of data transmission and storage, we proposed an artificial intelligence diagnosis model GARCD based on CT images. The method proposed can accurately diagnose whether the sample has COVID-19 pneumonia even facing low-quality images. The image quality improvement module used an advanced generative adversarial network and a loss function that considers both feature differences and content differences to enhance the quality of COVID-19 positive and negative samples. The enhanced CT image is sent to the disease diagnosis module. The disease diagnosis module used an advanced residual convolution structure to automatically extract the semantic features of negative or positive samples. The extracted semantic features are sent to the non-linear classification layer to determine the health of the patients. The residual structure helps the model to better grasp the different scales semantic features of COVID-19 pneumonia CT images and improve the accuracy of diagnosis. Experiments have proved that the method we proposed can accurately diagnose COVID-19 pneumonia infections and non-COVID-19 pneumonia infections (including community-acquired pneumonia infections and healthy samples). The final model achieved 98.7% AUC 96.97% sensitivity and 91.16% specificity (400 positive samples and 800 negative samples) in the independent test dataset. When nucleic acid testing cannot be implemented on a large scale, radiologists are lacking, or the quality of clinically obtained CT images is low, the method proposed in this paper can be used as a reliable method to screen asymptomatic infected or suspected COVID-19 cases in real time. It can be used to assist in directing isolation work and avoid the further spread of COVID-19.
Although RT-PCR detection is an important criterion for the clinical diagnosis of COVID-19, it has strong limitations in practical application.6 Chest CT image is considered as an effective method to assist the diagnosis of COVID-19 pneumonia.10,19,31 However, clinical diagnosis based on CT images is still facing challenges. The outbreak of COVID-19 pneumonia is huge, and there is a lack of experienced radiologists to continuously distinguish CT images. Community-acquired pneumonia has similar symptoms to COVID-19 can also interfere with accurate judgments of COVID-19 pneumonia.32 The coverage of the new coronavirus is wide, the amount of CT scanning is huge, and the quality of CT images is difficult to guarantee. Moreover, the image quality may be damaged in the process of data storage and transmission, which further hinders the use of chest CT image in the diagnosis of COVID-19 pneumonia. The method proposed provides a feasible solution to the above problems. According to the experimental results, the artificial intelligence model proposed in this study can improve the quality of unclear images, whether it is COVID-19 patient samples or non-COVID-19 patient samples. This allows unclear CT images can be used for disease diagnosis.
In a limited range, we also compared the performance of CNN, ResNet, and DenseNet which are widely used in many fields today in diagnosing COVID-19 pneumonia as shown in Table 3.
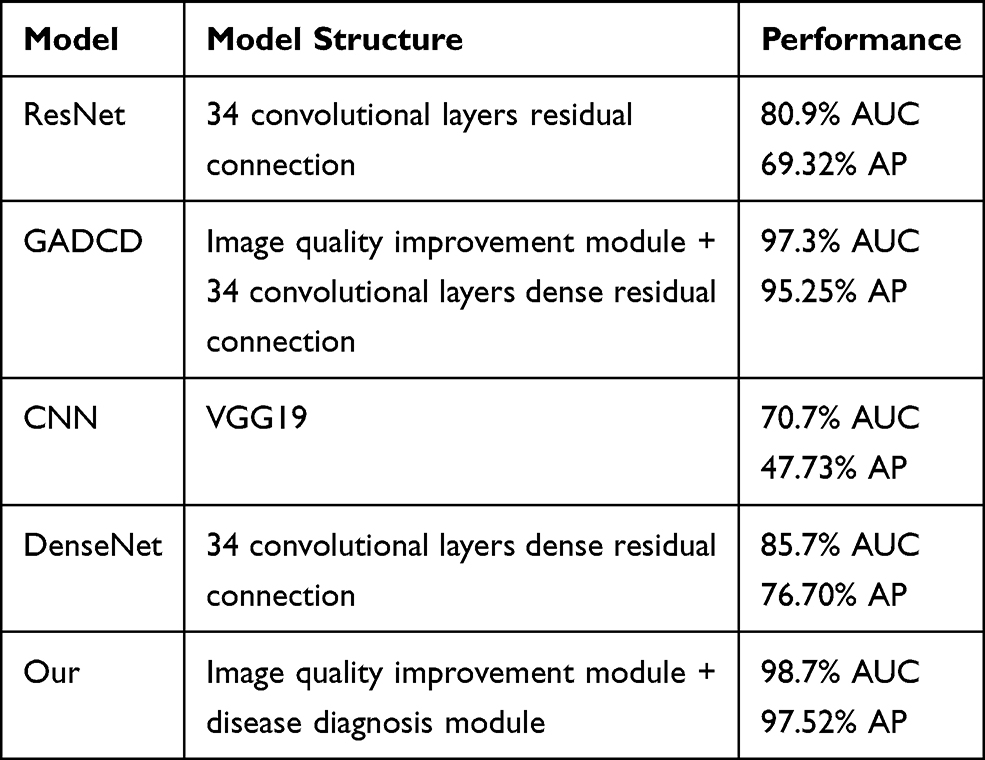 |
Table 3 The Recognition Performance of Each Model on the Same Low-Quality Image (AUC Means Area Under Receiver Operating Characteristic Curve, AP Means Average Precision) |
Under the same number of training iterations and the same test dataset, the above models reached 70.7%, 80.9% and 85.7% AUC, respectively. Our method achieves 98.7% AUC. According to the ROC curve, the cut-off point of our model can be obtained. Through the cut-off point, we can obtain the sensitivity, specificity, and model threshold of the model. The sensitivity of the model reached 96.97%, and the specificity reached 91.16%, the threshold is 0.8813. Compared with CNN, ResNet adds a short-circuit structure, so that the model can better grasp the impact of different scales semantic features on the diagnosis of COVID-19. Therefore, ResNet performs better than CNN. Compared with ResNet, DenseNet uses a dense short-circuit structure, which makes the gradient flow easier and makes the model have a stronger grasp of the semantic features of CT images at different scales. The performance of DenseNet is also better than ResNet. This phenomenon proves that the diagnostic model using the short-circuit structure is more suitable for medical images with many subtle semantic features. Although the above models have strong semantic feature extraction capabilities, this capability is limited when faced with low-quality CT images. But GARCD achieved higher performance. In the actual clinical process with a large number of uncertain factors, it is difficult for all CT images to achieve high quality, especially in the case of COVID-19 global pandemic. Therefore, the GARCD proposed in this paper with the ability to recognize low-quality images has higher clinical applicability. We also compared the performance of GARCD and GADCD. The performance of the above two models is similar, but the GARCD performance is better. We speculate that this phenomenon is due to the fact that the model may over learn some semantic features due to the dense connection, which leads to a slight over learning phenomenon when processing high-quality images. In addition, we also found that during the training process, the model’s loss on the validation set is lower than the training set. We speculate that this is because in order to make the model have higher anti-interference ability, the training set contains more low-quality and noisy data.
The results of this study show that the image quality improvement module based on advanced artificial intelligence technology can effectively enhance the CT images of COVID-19 patients and non-COVID-19 patients. In other words, the semantic features of these two groups of data can be successfully encoded and enhanced. Although the CT image features of some community-acquired pneumonia are very similar to COVID-19 pneumonia, the disease diagnosis module based on residual convolution structure can effectively distinguish the semantic knowledge contained in CT images of two groups of patients through self-supervised. Existing reports show that common imaging features of COVID-19 are ground-glass opacity, consolidation, thickened interlobular septum or paving stone signs, and thickened blood vessels. The most common distribution pattern is bilateral, peripheral/subpleural, opacity and posterior distribution, extensive/multi-lobe involvement with consolidation.14,33 Traditional methods are difficult to deal with the above problems. First of all, the characteristics and quality of images are not exactly the same. It is impossible to use a fixed smoothing filter or sharpening filter to accurately improve the quality of all images. Second, the image features of COVID-19 are often widely distributed and the boundaries are blurred. It is difficult to completely and accurately outline all the areas that need attention in CT images. Third, the imaging features of community-acquired pneumonia are very similar to COVID-19 pneumonia. It is difficult to achieve the goal simply by clustering the feature vectors of the image. Fourth, patients with COVID-19 pneumonia may not have very obvious CT imaging features.34 Pixel coding or feature vector-based methods become infeasible. Artificial intelligence technology based on generating adversarial and residual convolution helps to alleviate the shortcomings of traditional analysis methods in dealing with the above problems. GARCD does not use a fixed filter to smooth or sharpen the entire image. It purposefully learns the optimization methods for different semantic features under the joint guidance of content loss and feature loss. This can better improve the quality of the image. In the aspect of disease diagnosis, GARCD does not use the pixel value of the whole image, but the semantic features contained in the image. At the same time, it also pays attention to the influence of different scale semantic features on the final disease diagnosis through the way of short-circuiting. GARCD used the non-linear classification function softmax to determine whether the sample is COVID-19 pneumonia instead of using a linear classification function. Linear functions often learn the mapping relationship between semantic features and diagnosis results, while softmax learns the probability distribution of samples. It is more inclined to infer the probability that the sample belongs to COVID-19 patients, which is closer to the thinking mode of human experts rather than simple number coding. In other words, GARCD does not optimize images and diagnose COVID-19 pneumonia by encoding every pixel, but uses content features and semantic features to purposefully guide the model to strengthen low-quality images. And it uses semantic features of different scales to infer that the sample is more likely to be COVID-19 pneumonia or community-acquired pneumonia. In an independent test set, the method proposed in this paper achieved an AUC of 98.7%. The sensitivity of the model reached 96.97% and the specificity reached 91.16%. The performance of related works is also compared as shown in Table 4.
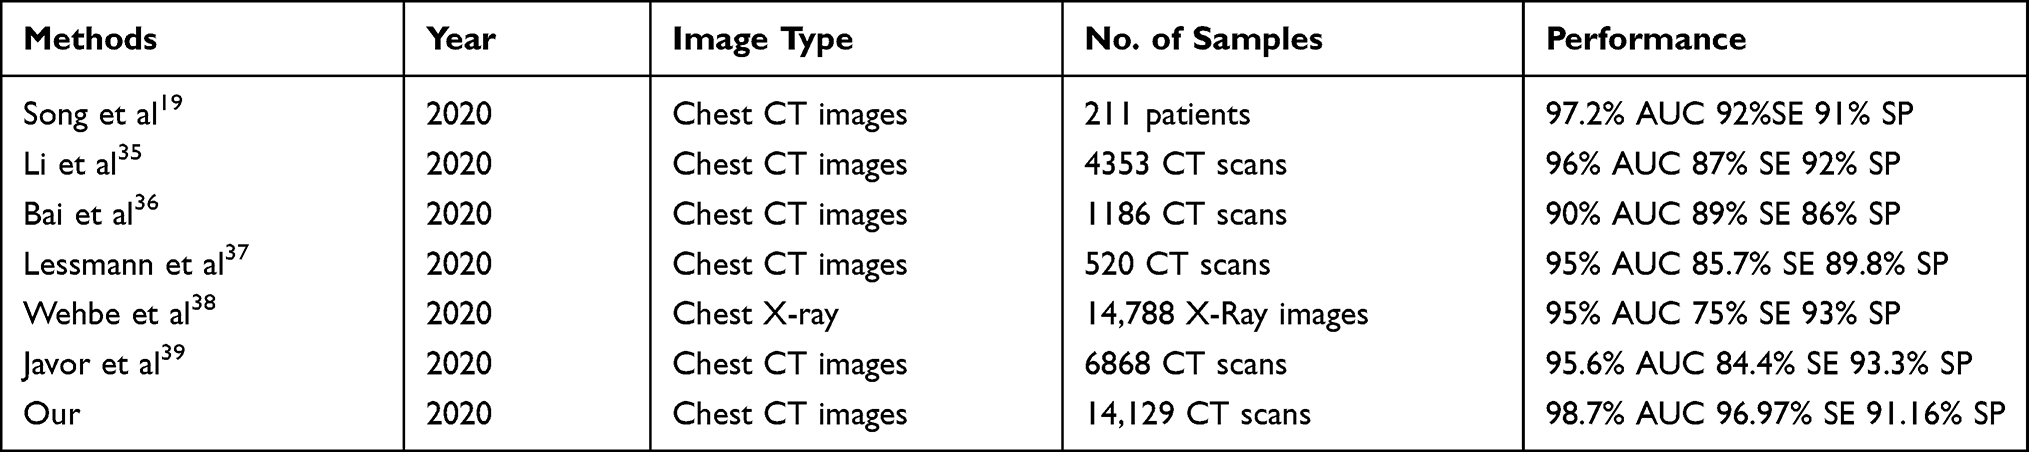 |
Table 4 Best Performance of Different Related Work (AUC Means Area Under Receiver Operating Characteristic Curve, SE Means Sensitivity, SP Means Specificity) |
By comparing achieved by related work, the method proposed in this paper has certain clinical practicability, and it can be used as an auxiliary tool for clinical diagnosis of COVID-19 pneumonia. Existing previous work has revolved around high-quality images while ignoring the low-quality images that exist in the clinic. Although high performance was achieved in the test set, further research is needed.
Experimental results show that our proposed method can improve the quality of low-quality images, as shown in Figure 6. Most studies will perform data cleaning and delete low-quality data before training the model. However, due to the widespread of COVID-19 pneumonia, it is difficult to guarantee the quality of all chest CT images obtained in actual clinical practice. Low-quality images will prevent the auxiliary diagnosis model from extracting semantic features of chest CT images, and semantic features are an important basis for the model to determine whether a sample is COVID-19 pneumonia. The GARCD proposed in this paper can repair the low-quality images under the guidance of the dual loss function so that the model can accurately diagnose COVID-19 pneumonia when facing low-quality samples. This is the advantage of our method proposed compared to previous studies. This is why GARCD and GADCD perform better than CNN, ResNet and DenseNet when low-quality images need to be recognized. Therefore, our proposed method may have higher clinical applicability.
The strategy of combining the image quality improvement module based on generating adversarial and the disease diagnosis module based on residual convolution is also suitable for diagnosing other diseases with imaging features, such as head CT images and lung X-ray images. GARCD does not encode pixel values, nor is it cluster analysis based on image feature vectors.40 Compared with traditional methods, it can automatically improve the quality of CT images and automatically extract the semantic features of different health conditions contained in the images. Finally, the above semantic features are used to infer the probability that the sample belongs to each category. Therefore, GARCD also has the potential to be used to diagnose other types of diseases. We preliminarily demonstrated the widely applicable capabilities of GARCD on chest X-ray images of COVID-19 patients, as shown in Figure 11. GARCD can enhance the quality of various medical images. Due to data limitations, we will study the diagnostic capabilities of artificial intelligence technology for other types of medical images in the future work.
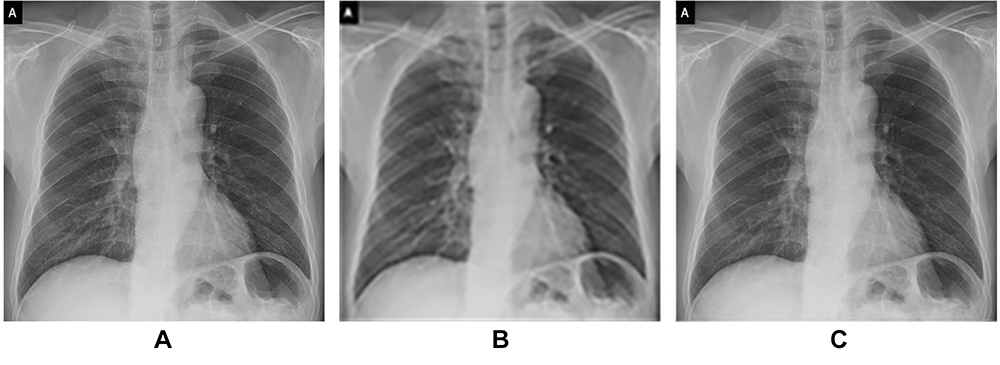 |
Figure 11 GARCD also has the potential to be applied to other types of medical imaging, such as X-ray (A is raw data, B is low-quality image, C is generated high-quality images). |
Although our research work has shown the great potential of artificial intelligence technology to be applied to the diagnosis of COVID-19 pneumonia, there are still certain limitations, and these issues need to be further studied. First of all, this study only used chest CT images to assist in the diagnosis of suspected cases of COVID-19 pneumonia, but in actual clinical diagnosis, many physiological parameters of patients are also used, such as hematology parameters, etc.41 This is also the reason that limits the performance of this model. Therefore, in the future, we should also study how to enable artificial intelligence models to jointly process image data and other patient data. Second, the method of acquiring a CT image also affects its quality, such as scanning parameters and reconstruction algorithms. Although we have shown that GARCD has the function of enhancing image quality, if future work can correct the image according to the scanning parameters, this may enable the artificial intelligence model to achieve a higher ability to diagnose COVID-19 pneumonia or other diseases. At the same time, experiments show that images with high indicators are not necessarily suitable for clinical diagnosis, as shown in Figure 4. Therefore, it is necessary to further study the data quality evaluation system that is more suitable for medical images, such as considering both the lesion and content characteristics. During the experiment, within a limited range, we compared the ability of five widely used artificial intelligence models to assist in the diagnosis of COVID-19 pneumonia using low-quality CT images. These models are widely used in many fields. GARCD showed high performance. But it still has not achieved completely reassuring clinical accuracy. Therefore, in the future work, artificial intelligence models with stronger semantic feature extraction capabilities should also be studied. The scale of the data is also one of the factors that limit the performance of the model. In the future work, we will consider increasing the sample size of multi-center comparisons to improve the model’s recognition and generalization capabilities. In the subjective impression score test, the score of some enhanced images is 3. We guess this is due to the extremely low quality of the random sample itself. Therefore, we will continue to study how to further improve the performance of the model. In addition, we will also collect more types of samples in the future research to improve the comprehensive evaluation capabilities of artificial intelligence models, such as grading COVID-19 pneumonia, analyzing the age difference, gender difference, ethnic difference and predicting biomarkers. By drawing decision curves of different physiological parameters, we may be able to discover the degree of COVID-19’s influence on different human parameters. This model will have the ability to automatically analyze the statistical information of the disease and may have stronger clinical assistance capabilities. We will study the actual auxiliary effect of artificial intelligence models on clinicians, such as comparing the performance of human experts and artificial intelligence doctors to evaluate the diagnostic risk and credibility of the model or to further verify the resist uncertainties ability of the model through multicenter randomized controlled experiments. The ability to diagnose different lung diseases also needs to be further studied, such as fungal pneumonia, Mycoplasma pneumonia et al which can further increase the auxiliary ability of artificial intelligence for clinical medical diagnosis. More evaluation methods should also be studied in the future work. There may be deviations in the performance comparison between different works, so in the future work, the performance of the model in more data sets will be studied. From the perspective of actual clinical use, we will continue to study how to make the model have a pre-judgment function of image quality. Low-quality images are sent to the image quality improvement module, and the images that meet the requirements are directly sent to the disease diagnosis module. This method may further improve the efficiency of the model.
The work in this paper demonstrates an effective artificial intelligence model with more clinical application potential to assist in the diagnosis of COVID-19 pneumonia. It can show better diagnostic performance even facing low-quality CT images. When a large number of PT-PCR tests cannot be performed, radiologists are lacking, or the quality of CT images cannot be fully guaranteed, the method proposed in this paper can effectively assist doctors in real-time detection of suspected cases of COVID-19 pneumonia. It can quickly isolate patients in a targeted manner, which is of positive significance for preventing the further spread of COVID-19 pneumonia.
Data Sharing Statement
The raw data used in this paper can be obtained from the public dataset https://doi.org/10.21203/rs.3.rs-21834/v1.
Ethical Approval
All procedures performed in studies involving human participants were in accordance with the ethical standards of the Nankai University and with the 1964 Helsinki declaration and its later amendments or comparable ethical standards. The study was approved by the institutional review board of the Nankai University. Informed consent was waived in this retrospective study. Patient consent to review their medical records was not required by the institutional review board of Nankai University, because this research is a retrospective research and used public dataset. All data are anonymous.
Acknowledgments
This work is partly supported by the National Natural Science Foundation of China (61771261).
Author Contributions
Q.Z., Z.C. and G.L. conceived and designed the experimental activity; Q.Z. and Z.C. built the model and analyzed the experimental performance; feasibility analysis was performed by Q.D., J.T., Q.G. and W.Z.; Q.Z. and G.L. analyzed elaborated and discussed the experimental data. All authors wrote, edited and drafted the work. All authors have read and agreed the manuscript. All authors contributed to data analysis, drafting or revising the article, have agreed on the journal to which the article will be submitted, gave final approval of the version to be published, and agree to be accountable for all aspects of the work.
Funding
This research received no external funding.
Disclosure
The authors report no conflicts of interest in this work.
References
1. WHO. WHO director-general’s statement on ihr emergency committee on Novel Coronavirus (2019-nCoV). World Health Organization; 2020. Available from: https://www.who.int/dg/speeches/detail/who-director-general-s-statement-on-ihr-emergency-committee-on-novel-coronavirus-(2019-ncov).
2. WHO. WHO director-general’s opening remarks at the media briefing on COVID-19-11 March 2020. World Health Organization; 2020. Available from: https://www.who.int/dg/speeches/detail/who-director-general-s-opening-remarks-at-the-media-briefing-on-covid-19—11-march–2020.
3. WHO. WHO Coronavirus Disease (COVID-19) Dashboard. World Health Organization; 2020. Available from: https://covid19.who.int/.
4. WHO. Shortage of personal protective equipment endangering health workers worldwide. World Health Organization; 2020. Available from: https://www.who.int/news-room/detail/03-03-2020-shortage-of-personal-protective-equipment-endangering-health-workers-worldwide.
5. WHO. Diagnostic testing for SARS-CoV-2. World Health Organization; 2020. https://www.who.int/publications/i/item/diagnostic-testing-for-sars-cov–2.
6. CDC. Interim guidelines for collecting, handling, and testing clinical specimens for COVID-19. Centers for Disease Control and Prevention; 2020. https://www.cdc.gov/coronavirus/2019-ncov/lab/guidelines-clinical-specimens.html.
7. WHO. Public health surveillance for COVID-19: interim guidance. World Health Organization; 2020. Available from: https://www.who.int/publications/i/item/who-2019-nCoV-surveillanceguidance-2020.7.
8. Floriano I, Silvinato A, Bernardo WM, et al. Accuracy of the polymerase chain reaction (PCR) test in the diagnosis of acute respiratory syndrome due to coronavirus: a systematic review and meta-analysis. Rev Assoc Med Bras (1992). 2020;66(7):880–888. doi:10.1590/1806-9282.66.7.880
9. PHLN. PHLN statement on nucleic acid test false positive results for SARS-CoV-2. Public Health Laboratory Network; 2020. Available from: https://www.health.gov.au/resources/publications/phln-guidance-on-nucleic-acid-test-result-interpretation-for-sars-cov–2.
10. Fu B, Hu L, Lv F, et al. Follow-up CT results of COVID-19 patients with initial negative chest CT. Infect Drug Resist. 2020;13:2681–2687. doi:10.2147/IDR.S258677
11. Mahdavi A, Haseli S, Mahdavi A, et al. The role of repeat chest CT scan in the COVID-19 pandemic. Acad Radiol. 2020;27(7):1049–1050. doi:10.1016/j.acra.2020.04.031.
12. Prokop M, van Everdingen W, van Rees Vellinga T, et al. CO-RADS: a categorical CT assessment scheme for patients suspected of having COVID-19—definition and evaluation. Radiology. 2020;296(2):E97–E104. doi:10.1148/radiol.2020201473
13. Sun P, Qie S, Liu Z, et al. Clinical characteristics of hospitalized patients with SARS-CoV-2 infection: a single arm meta-analysis. J Med Virol. 2020;92(6):612–617. doi:10.1002/jmv.25735
14. Ojha V, Mani A, Pandey NN, et al. CT in coronavirus disease 2019 (COVID-19): a systematic review of chest CT findings in 4410 adult patients. Eur Radiol. 2020;30(11):6129–6138. doi:10.1007/s00330-020-06975-7
15. Zhao D, Yao F, Wang L, et al. A comparative study on the clinical features of COVID-19 pneumonia to other pneumonias. Clin Infect Dis. 2020;71(15):756–761. doi:10.1093/cid/ciaa247
16. WHO. Use of chest imaging in COVID-19. World Health Organization; 2020. Available from: https://www.who.int/publications/i/item/use-of-chest-imaging-in-covid–19.
17. Fullman N, Yearwood J, Abay SM, et al. Measuring performance on the healthcare access and quality index for 195 countries and territories and selected subnational locations: a systematic analysis from the global burden of disease study 2016. Lancet. 2018;391(10136):2236–2271.
18. Fang Y, Zhang H, Xu Y, Xie J, Pang P, Ji W. CT manifestations of two cases of 2019 novel coronavirus (2019-nCoV) pneumonia. Radiology. 2020;295(1):208–209. doi:10.1148/radiol.2020200280
19. Song J, Wang H, Liu Y, et al. End-to-end automatic differentiation of the coronavirus disease 2019 (COVID-19) from viral pneumonia based on chest CT. Eur J Nucl Med Mol Imaging. 2020;47(11):2516–2524. doi:10.1007/s00259-020-04929-1
20. Liu Y, Liu G, Zhang Q. Deep learning and medical diagnosis. Lancet. 2019;394(10210):1709–1710. doi:10.1016/S0140-6736(19)32501-2
21. Kermany DS, Goldbaum M, Cai W, et al. Identifying medical diagnoses and treatable diseases by image-based deep learning. Cell. 2018;172(5):1122–1131. doi:10.1016/j.cell.2018.02.010
22. Chilamkurthy S, Ghosh R, Tanamala S, et al. Deep learning algorithms for detection of critical findings in head CT scans: a retrospective study. Lancet. 2018;392(10162):2388–2396. doi:10.1016/S0140-6736(18)31645-3
23. Zhang Q, Liu Z, Jiaxu L, Liu G. Identifying diabetic macular edema and other retinal diseases by optical coherence tomography image and multiscale deep learning. Diabetes Metab Syndr Obes. 2020;13:4787–4800. doi:10.2147/DMSO.S288419
24. Zhang P, Zhong Y, Deng Y, Tang X, Li X. CoSinGAN: learning COVID-19 infection segmentation from a single radiological image. Diagnostics. 2020;10(11):901. doi:10.3390/diagnostics10110901
25. Jun X, Liu Z-A, Hou Y-K, et al. Pixel-level non-local image smoothing with objective evaluation. IEEE Trans Multimedia. 2020. doi:10.1109/TMM.2020.3037535.
26. Zhang Y, Wang P, Bao F, et al. A SINGLE-IMAGE SUPER-RESOLUTION METHOD BASED ON PROGRESSIVE-ITERATIVE APPROXIMATION. IEEE Trans Multimedia. 2020;22(6):1407–1422. doi:10.1109/TMM.2019.2943750
27. Yin H, Molchanov P, Zhizhong L, et al. Dreaming to distill: data-free knowledge transfer via deepinversion. ArXiv Preprint . 2020;1912:08795.
28. Ledig C, Theis L, Huszar F, et al. Photo-realistic single image super-resolution using a generative adversarial network. arXiv Preprint. 2017;1609:04802.
29. Ning W, Lei S, Yang J, et al. iCTCF: an integrative resource of chest computed tomography images and clinical features of patients with COVID-19 pneumonia; 2020. doi:10.21203/rs.3.rs-21834/v1.
30. Ledig C, Theis L, Huszar F, et al. Photo-realistic single image super-resolution using a generative adversarial network. arXiv Preprint. 2017;1609:04802.
31. BSTI. Thoracic imaging in COVID-19 infection: guidance for the reporting radiologist. British Society of Thoracic Imaging; 2020. https://www.bsti.org.uk/media/resources/files/BSTI_COVID-19_Radiology_Guidance_version_2_16.03.20.pdf.
32. Zu ZY, Di Jiang M, Xu PP, et al. Coronavirus disease 2019 (COVID-19): a perspective from China. Radiology. 2020;296(2):E15–E25. doi:10.1148/radiol.2020200490
33. Zhao W, Zhong Z, Xie X, et al. Relation between chest CT findings and clinical conditions of coronavirus disease (COVID-19) pneumonia: a multicenter study. Am J Roentgenol. 2020;1–6.
34. ACR. ACR recommendations for the use of chest radiography and Computed Tomography (CT) for suspected COVID-19 Infection. Am Coll Radiol. 2020. Available from: https://www.acr.org/Advocacy-and-Economics/ACR-Position-Statements/Recommendations-for-Chest-Radiography-and-CT-for-Suspected-COVID19-Infection.
35. Lin L, Qin L, Zeguo X, et al. Using artificial intelligence to detect COVID-19 and community-acquired pneumonia based on pulmonary CT: evaluation of the diagnostic accuracy. Radiology. 2020;296(2):E65–E71. doi:10.1148/radiol.2020200905
36. Bai HX, Wang R, Xiong Z, et al. Artificial intelligence augmentation of radiologist performance in distinguishing COVID-19 from pneumonia of other origin at chest CT. Radiology. 2020;296(3):E156–E165. doi:10.1148/radiol.2020201491
37. Lessmann N, Sánchez CI, Beenen L, et al. Automated assessment of CO-RADS and chest CT severity scores in patients with suspected COVID-19 using artificial intelligence. Radiology. 2020. doi:10.1148/radiol.2020202439.
38. Wehbe RM, Sheng J, Dutta S, et al. DeepCOVID-XR: an artificial intelligence algorithm to detect COVID-19 on chest radiographs trained and tested on a large US clinical dataset. Radiology. 2020:203511. doi:10.1148/radiol.2020203511.
39. Javor D, Kaplan H, Kaplan A, Puchner SB, Krestan C, Baltzer P. Deep learning analysis provides accurate COVID-19 diagnosis on chest computed tomography. Eur J Radiol. 2020;133:10924. doi:10.1016/j.ejrad.2020.109402
40. Song J, Yin Y, Wang H, et al. A review of original articles published in the emerging field of radiomics. Eur J Radiol. 2020;127:108991. doi:10.1016/j.ejrad.2020.108991
41. Zhu J, Zhong Z, Ji P, et al. Clinicopathological characteristics of 8697 patients with COVID-19 in China: a meta-analysis. Fam Med Community Health. 2020;8(2):e000406. doi:10.1136/fmch-2020-000406
 © 2021 The Author(s). This work is published and licensed by Dove Medical Press Limited. The
full terms of this license are available at https://www.dovepress.com/terms
and incorporate the Creative Commons Attribution
- Non Commercial (unported, 3.0) License.
By accessing the work you hereby accept the Terms. Non-commercial uses of the work are permitted
without any further permission from Dove Medical Press Limited, provided the work is properly
attributed. For permission for commercial use of this work, please see paragraphs 4.2 and 5 of our Terms.
© 2021 The Author(s). This work is published and licensed by Dove Medical Press Limited. The
full terms of this license are available at https://www.dovepress.com/terms
and incorporate the Creative Commons Attribution
- Non Commercial (unported, 3.0) License.
By accessing the work you hereby accept the Terms. Non-commercial uses of the work are permitted
without any further permission from Dove Medical Press Limited, provided the work is properly
attributed. For permission for commercial use of this work, please see paragraphs 4.2 and 5 of our Terms.