Back to Journals » International Journal of Nanomedicine » Volume 17
Nanoformulated Recombinant Human Myelin Basic Protein and Rituximab Modulate Neuronal Perturbations in Experimental Autoimmune Encephalomyelitis in Mice
Authors Saad MA, Eissa NM, Ahmed MA ![]() , ElMeshad AN
, ElMeshad AN ![]() , Laible G
, Laible G ![]() , Attia AS
, Attia AS ![]() , Al-Ghobashy MA, Abdelsalam RM, Al-Shorbagy MY
, Al-Ghobashy MA, Abdelsalam RM, Al-Shorbagy MY
Received 19 January 2022
Accepted for publication 24 July 2022
Published 7 September 2022 Volume 2022:17 Pages 3967—3987
DOI https://doi.org/10.2147/IJN.S359114
Checked for plagiarism Yes
Review by Single anonymous peer review
Peer reviewer comments 3
Editor who approved publication: Prof. Dr. Anderson Oliveira Lobo
Muhammed A Saad,1,2 Noha M Eissa,2 Mohammed A Ahmed,3 Aliaa N ElMeshad,3,4 Götz Laible,5– 7 Ahmed S Attia,8 Medhat A Al-Ghobashy,9,10 Rania M Abdelsalam,1,2 Muhammad Y Al-Shorbagy1,11
1Department of Pharmacology and Toxicology, Faculty of Pharmacy, Cairo University, Cairo, Egypt; 2School of Pharmacy, Newgiza University, Giza, Egypt; 3Department of Pharmaceutics and Industrial Pharmacy, Faculty of Pharmacy, Cairo University, Cairo, Egypt; 4Faculty of Nanotechnology for Postgraduate Studies, Cairo University, Giza, Egypt; 5AgResearch, Ruakura Research Centre, Hamilton, New Zealand; 6School of Medical Sciences, University of Auckland, Auckland, New Zealand; 7Maurice Wilkins Centre for Molecular Biodiscovery, Auckland, New Zealand; 8Department of Microbiology and Immunology, Faculty of Pharmacy, Cairo University, Cairo, Egypt; 9Analytical Chemistry Department, Faculty of Pharmacy, Cairo University, Cairo, Egypt; 10Bioanalysis Research Group, School of Pharmacy, Newgiza University, Giza, Egypt; 11Department of Pharmaceutical Sciences, College of Pharmacy, Gulf Medical University, Ajman, United Arab Emirates
Correspondence: Ahmed S Attia, Department of Microbiology and Immunology, Faculty of Pharmacy, Cairo University, Cairo, Egypt, Email [email protected]
Introduction: Rituximab (RTX) and recombinant human myelin basic protein (rhMBP) were proven to be effective in ameliorating the symptoms of multiple sclerosis (MS). In this study, a nanoformulation containing rhMBP with RTX on its surface (Nano-rhMBP-RTX) was prepared and investigated in comparison with other treatment groups to determine its potential neuro-protective effects on C57BL/6 mice after inducing experimental autoimmune encephalomyelitis (EAE).
Methods: EAE was induced in the corresponding mice by injecting 100 μL of an emulsion containing complete Freund’s adjuvant (CFA) and myelin oligodendrocyte glycoprotein (MOG). The subjects were weighed, scored and subjected to behavioural tests. After reaching a clinical score of 3, various treatments were given to corresponding EAE-induced and non-induced groups including rhMBP, RTX, empty nanoparticle prepared by poly (lactide-co-glycolide) (PLGA) or the prepared nanoformulation (Nano-rhMBP-RTX). At the end of the study, biochemical parameters were also determined as interferon-γ (IFN-γ), myeloperoxidase (MPO), interleukin-10 (IL-10), interleukin-4 (IL-4), tumor necrosis factor alpha (TNF-α), nuclear factor kappa B (NF-kB), brain derived neurotrophic factor (BDNF), 2’, 3’ cyclic nucleotide 3’ phosphodiesterase (CNP) and transforming growth factor beta (TGF-β) along with some histopathological analyses.
Results: The results of the Nano-rhMBP-RTX group showed promising outcomes in terms of reducing the clinical scores, improving the behavioural responses associated with improved histopathological findings. Elevation in the levels of IL-4, CNP and TGF-β was also noticed along with marked decline in the levels of NF-kB and TNF-α.
Conclusion: Nano-rhMBP-RTX treated group ameliorated the adverse effects induced in the EAE model. The effectiveness of this formulation was demonstrated by the normalization of EAE-induced behavioral changes and aberrant levels of specific biochemical markers as well as reduced damage of hippocampal tissues and retaining higher levels of myelination.
Keywords: multiple sclerosis, experimental autoimmune encephalomyelitis, nanoparticle, rituximab, recombinant human myelin basic protein
Introduction
Multiple sclerosis (MS) is an autoimmune neurodegenerative disease of the central nervous system (CNS) characterized by multifocal demyelination, inflammation and axonal destruction.1 According to a systematic analysis completed in 2016, it was estimated that over 2 million people worldwide are affected by this disease with around 30,000 patients in Egypt.2 Although it is not confined to a certain age or gender, it is 3 times more common in women than in men and has its highest prevalence in the 20 to 50 year age group with variation in some cases.3
MS is known to be a progressive neurodegenerative disease causing damage in the myelin sheath through the release of various inflammatory mediators. T-cells are considered to be crucial for disease initiation and progression and have always been thought to be the main cells responsible for the pathogenesis of MS along with its released cytokines. In patients with MS, T-cells manage to leak through the blood brain barrier into the CNS. Then it can attract other cells that ultimately leads to an attack on the myelin sheath, affecting the functions of the neurons. T-cells are not the only factor that have a role in MS; studies have also proven that B-cells and their products are involved as well.3–5
There is still no cure for MS but there are some drugs with approval from the US Food and Drug Administration (FDA) that can be used in managing the disease.6 Interferon-β (IFN-β) was the first treatment choice for MS, and it was found to be effective in hindering the autoimmune inflammatory cascade.7 Glatiramer acetate was another drug which was early introduced and used in managing MS. It is a mixture of many synthetic peptides that causes wide range of immunomodulation along with a neuroprotective effect that helps controlling disease progression.8 In 2006, natalizumab was licensed for use in MS by acting as an α4 integrin antagonist blocking the leakage of lymphocytes through the blood brain barrier and into the CNS.9 However, prolonged use of natalizumab was associated with developing progressive multifocal leukoencephalopathy which is a life-threatening brain infection.10 Later in 2011, Fingolimod which is a sphingosine-1-phosphate receptor inhibitor was approved for treatment of MS due to its ability to reduce the infiltration of lymphocytes into the CNS thus the myelin sheath is retained.11 When comparing Fingolimod with IFN-β and glatiramer acetate, it was proven to be better in controlling the disease and reducing the rates of relapses.12 On the other hand, its use was associated with higher risks of cancer development in MS patients when compared to natalizumab.13
Among the treatments suggested for managing MS and proven high efficacy is rituximab (RTX). Although it is used for managing other diseases such as rheumatoid arthritis and Non-Hodgkin’s Lymphoma, it is still not officially approved by the FDA for treating MS. RTX is an example of a chimeric monoclonal antibody which targets CD20 present on the surface of B-cells.14 Several studies supported the off-label use of RTX in patients with MS and had demonstrated its effectiveness in patients suffering from this disease.15,16 Due to its previous use in other conditions, it is considered to have a known safety and tolerance profile when compared to other drugs. Studies comparing RTX with fingolimod and with other disease-modifying treatments in patients with MS indicated the superiority of RTX in terms of its safety, and higher rates of drug survival.17,18 When comparing RTX with ocrelizumab; a humanized monoclonal anti-CD20 antibody which was recently approved by the FDA for treating MS patients, or with ofatumumab; another humanized monoclonal anti-CD20 antibody, studies showed that RTX is still more widely used due to its lower overall cost.19 Also, an increasing body of evidence from different studies suggests that RTX has low drug discontinuation rate due to its high safety profile resulting in increased patients’ compliance.20
Besides the use of monoclonal antibodies, another approach has been studied which involves the use of the auto-antigens which contributes to the development of MS through an auto-reactive immune response against them. The administration of these auto-antigens triggers a tolerance mechanism which reduces the severity of the disease. One of the auto-antigens involved in the pathogenesis of MS is myelin basic protein (MBP), studies showed that administration of antigenic fragments of recombinant human myelin basic protein (rhMBP); reduces the severity of the disease.21,22
The main goal of this study is to contribute to the growing area of research by assessing the effect of combining rhMBP and RTX which have already proven to be effective each alone in managing MS. In our previous study, the effectiveness of nanoformulated rhMBP demonstrated superiority over free rhMBP when used as vaccine for preventing MS showing a relatively higher protection against MS induced symptoms.21 In this study, PLGA (poly (lactic-co-glycolic acid)) nanoparticles (NP) loaded with rhMBP were prepared but this time the main focus was testing its effect as a therapeutic intervention. PLGA is one of the most intensively investigated biodegradable polymers which have proven to have minimal toxicity, increased drug loading capacity along with increased stability.23,24 The development of nanoformulated drug delivery systems provides selective targeting, gradual release of the loaded protein as well as providing a method for delivering biomolecules where they can be adsorbed or covalently attached to the surface or encapsulated within the particles.25–27 As a new approach, RTX was then adsorbed on the surface of the protein loaded nanoparticles to test the effect of combining both drugs in one formulation on ameliorating the symptoms of MS.
Throughout the study, animals were holistically assessed after disease induction by experimental autoimmune encephalomyelitis (EAE) model and following treatments’ initiation to determine any behavioural changes further supported by biochemical and histopathological analyses. This research aims to produce a potential treatment option that will improve the quality of life of the patients suffering from MS.
Materials and Methods
Animals
Male C57BL/6 mice, weighing 20–25 g, were obtained from the animal facility of Theodor Bilharz Research Institute, Egypt. Animals were placed in the animal house of the Faculty of Pharmacy, Cairo University. Before experimentation, animals were allowed to acclimatize for 1 week. All animals were housed under controlled environmental conditions; constant temperature (25°C±2°C), humidity (60%±10%) and a 12/12-hour light/dark cycles. Standard chow diet and water were allowed ad libitum. The protocols used in this study complied with The Guide for Care and Use of Laboratory Animals published by the US National Institutes of Health (NIH Publication No. 85–23, revised 2011) and were approved by the Ethics Committee for Animal Experimentation at Faculty of Pharmacy, Cairo University (Permit Number: PT 2383).
Drugs and Chemicals
In this study, many chemicals were used for EAE induction including MOG (35–55) peptide, pertussis toxin, Incomplete Freund’s Adjuvant (IFA), Mycobacterium tuberculosis H37Ra, inactivated and desiccated and phosphate buffer saline (PBS) all of which were purchased from Sigma-Aldrich.
Rituximab (RTX) was one of the treatments used and was provided by the National Organization for Research and Control of Biologicals (Egypt) as a sterile, colourless clear liquid with a purity of 99.80%. Recombinant human myelin basic protein (rhMBP) was also used and was prepared by a vacuum-driven downstream purification protocol in order to purify the rhMBP from transgenic milk.28 The identity, purity and integrity of the rhMBP in the final preparation were confirmed using sodium dodecyl sulphate polyacrylamide gel electrophoresis (SDS-PAGE), size exclusion high performance liquid chromatography (SE-HPLC), reversed-phase high performance liquid chromatography (RP-HPLC) and ion flux immunosensor.29
PLGA (poly(lactic-co-glycolic acid)) and PVA (Polyvinyl alcohol) used for preparing the nanoparticles were obtained from Sigma. The formulation of the protein loaded nanoparticles composed of 1.30% protein, 1% PLGA and 3.64% PVA. The protein loaded nanoparticles were prepared by single emulsification – solvent evaporation technique. PLGA polymer was dissolved in 2 mL dichloromethane while the protein and PVA were dissolved in 10 mL of distilled water. The organic solution was then emulsified in the aqueous solution using WiseMixTM HG15D Homogenizer (Daihan Scientific Co., Ltd, Korea) at 12,000 rpm for 2 minutes using ice bath. The organic solvent was evaporated by continuous stirring for 2 hours until a colloidal suspension was obtained. D-optimal response surface experimental design was applied to investigate the effect-response relationship. Design Expert software (version 10.0.3, Stat-Ease, USA) was used for the optimization of the nanoparticle formulation. Optimization criteria were set at the highest entrapment efficiency, the lowest negative zeta potential and the lowest particle size. Both numerical and graphical optimization were chosen to maximize the entrapment efficiency and minimize both zeta potential and particle size. The resulting overall desirability is shown in Figure 1. Graphical optimization is shown in Figure 2. The solution with the higher desirability (0.766) was chosen as the optimum formulation (Table 1).
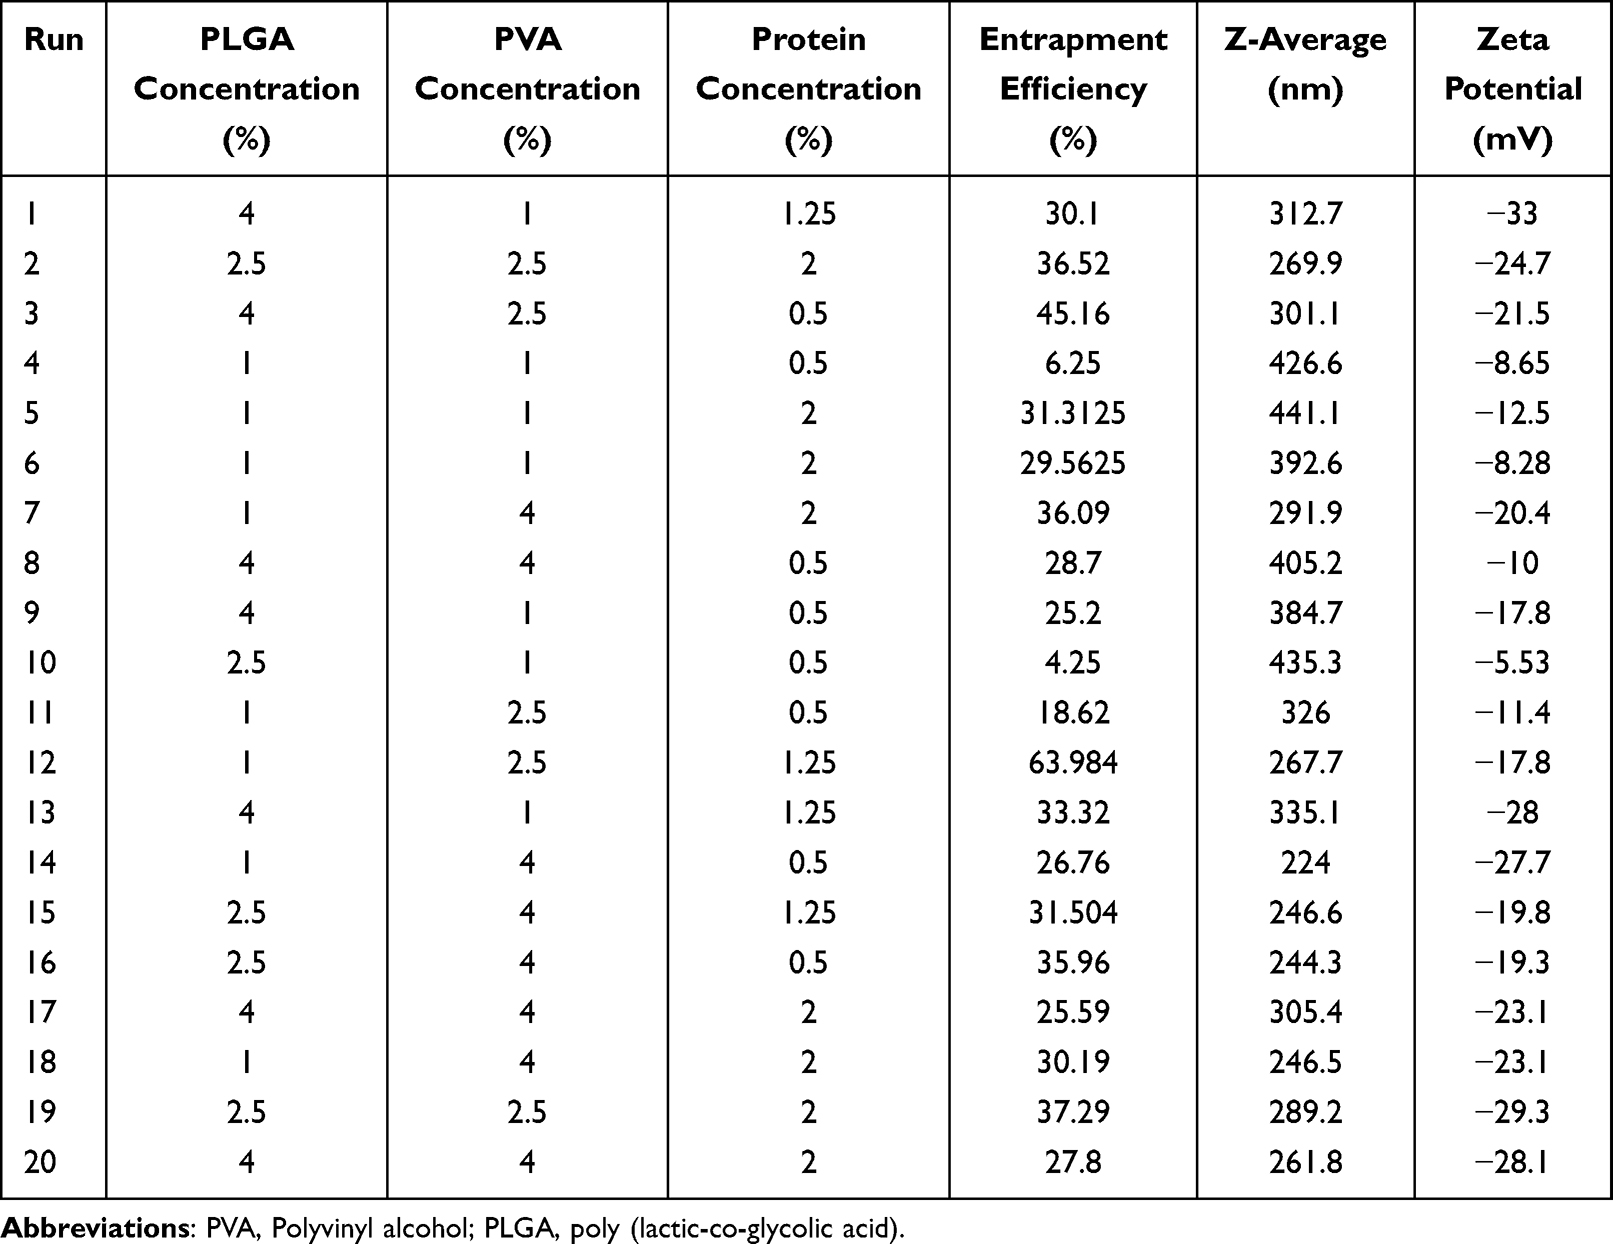 |
Table 1 Characterization of Nanoparticles Formulations |
 |
Figure 1 Desirability curve for optimization (at optimum protein concentration 1.3%). Abbreviations: PVA, Polyvinyl alcohol; PLGA, poly (lactic-co-glycolic acid). |
 |
Figure 2 Graphical optimization of nanoparticles formulations showing design space in yellow color (at optimum protein concentration 1.3%). Abbreviations: PVA, polyvinyl alcohol; PLGA, poly (lactic-co-glycolic acid). |
In order to add RTX, PLGA protein loaded nanoparticles were activated using EDC/NHS (1-(3-Dimethylaminopropyl)-3-ethylcarbodiimide hydrochloride/N-hydroxysuccinimide) chemistry. This was achieved by adding 100µL of 0.05M EDC and 100µL of 0.35M N-Hydroxysulfosuccinimide sodium salt (Sulfo-NHS), both dissolved in PBS (pH 7.4) to 100µL of nanoparticle suspension. RTX (10µL) was added and the volume was completed to 1mL with PBS. The mixture was vortexed and incubated at 4°C overnight. Excess reagents and soluble byproducts were separated by centrifugation at 14.000 rpm for 5 min, and the sediment was washed three times with 1mL PBS. Finally, the antibody-loaded nanoparticles were dispersed in 100µL of PBS. Control NP were prepared as described above but without RTX. Protein content was determined by Bradford assay. Briefly, 900µL of Coomassie Plus reagent was added to 30µL of dispersion of RTX-loaded PLGA nanoparticles. After 10-min incubation, the absorbance was measured at 595 nm. The amount of the antibody conjugated in PLGA nanoparticles was calculated from a standard curve of bovine serum albumin solution in the concentration range from 125µg/mL to 1000µg/mL.
Experimental Autoimmune Encephalomyelitis (EAE) Induction
EAE was induced according to the experimental design. The backs of the mice were shaved 24 hours before the active immunization is initiated using small animal clippers. Complete Freund’s Adjuvant (CFA) was prepared by combining 50 mL IFA and 200 mg M. tuberculosis H37Ra, resulting in a final concentration 4 mg/mL. Myelin oligodendrocyte glycoprotein (MOG) 35–55 was diluted in bidistilled water to a final volume of 4 mg/mL. An emulsion of CFA and MOG (35–55) was prepared by mixing 1 mL of CFA with 1 mL of MOG then 100 μL of the emulsion was injected subcutaneously into the shaved backs of the mice, distributing evenly over three injection sites. One injection placed on the midline of the back just below the shoulders, and two on either side of the midline on the lower back. Pertussis toxin was diluted to 1 μg/mL in sterile PBS then 400 μL of the diluted pertussis toxin (400 ng per mouse) was injected into the peritoneal cavity on the day of disease induction, and again 48 h after induction.30,31
Experimental Design
As illustrated in Figure 3, 80 mice were allocated randomly in ten treatment groups (n = 8) by a technician who was not involved in the analysis. Sample size was based on a power analysis (power = 0.8, α = 0.05) using effect sizes previously determined by Rodrigues et al.32 Group (1): normal control group: mice in this group were given PBS. Group (2): EAE control group: mice in this group were given 100 uL of an emulsion of CFA and MOG (35–55) once subcutaneously (distributed evenly on 3 sites as mentioned in the induction part) followed by 400 uL pertussis toxin injection twice, on day 0 and day 2. Group (3): mice in this group were given rhMBP (50 µg/mouse, s.c, single injection). Group (4): mice in this group were given rhMBP (50 µg/mouse, s.c, single injection) once after induction of EAE and reaching a clinical score of 3. Group (5): mice in this group were given rituximab (50 µg/mouse, s.c, single injection). Group (6): mice in this group were given rituximab (50 µg/mouse, s.c, single injection) once after induction of EAE and reaching a clinical score of 3. Group (7): mice in this group were given empty nanoparticle prepared by poly (lactide-co-glycolide) (PLGA) (50 µg/mouse, s.c, single injection). Group (8): mice in this group were given empty nanoparticle (50 µg/mouse, s.c, single injection) once after induction of EAE and reaching a clinical score of 3. Group (9): mice in this group were given nano rhMBP with rituximab on its surface (50 µg/mouse, s.c, single injection). Group (10): mice in this group were given nano rhMBP with rituximab on its surface (50 µg/mouse, s.c, single injection) once after induction of EAE and reaching a clinical score of 3. All treatments were given after the majority of the animals reached a clinical score of 3.
 |
Figure 3 Schematic diagram of the experimental design. |
Throughout the duration of the study, animals were weighed and scored daily to check for the development of clinical symptoms.33 In addition to the scoring technique, behavioral tests were performed on days 0, 3, 7, 10, 14, 21 and 28 post induction, such as rotarod, grip strength and open field to detect any changes in motor coordination, forelimb strength and locomotor activity, respectively. At the end of the study, animals were sacrificed by decapitation under light anesthesia, the brain of 2 mice from each group were carefully removed and used for histopathological analysis. The rest of the brains were dissected and homogenized in 10% PBS for biochemical analysis. During data analysis, the experimenters were blinded to sample identity, and sample coding and decoding were performed by an independent experimenter.
Clinical Scoring
Animals were daily scored according to the following scoring system; 0: mouse shows no symptoms of disease (asymptomatic), 1: mouse has a limp tail (complete flaccidity, absence of curling at the tip) or hind limb weakness, 2: mouse has both a limp tail and shows hind limb weakness, 3: mouse has partial paralysis of the hind limbs (can no longer maintain posture of the rump, but can still move one or both limbs to an extent), 4: mouse shows complete hind limb paralysis (complete loss of movement of the hind limbs, all movement is the result of the mouse dragging on the forelimbs) and 5: mouse reached score 4 and lost more than 20% of its body weight was euthanized and given a score of 5 or mouse found dead due to paralysis (moribund).33 After reaching a clinical score of 3, different treatments were injected to the corresponding groups.34,35
Behavioral Tests
Open-Field Test
The open field apparatus (wooden box measuring 50 cm x 50 cm x 38 cm) was constructed and painted white so that the mice could be detected. The main aim of this test is to confirm that the induction is done correctly, observe the gait of the mice throughout the study period and to check for any changes in the movement of the animal after the treatments are given. On days 0, 3, 7, 10, 14, 21 and 28 post induction, open-field test was performed. Each mouse was placed in the center of the open field and was observed individually for 5 minutes during which a camera recorded all the movements. At the end of the test time, fecal pellets were removed and the box was cleaned using 95% ethanol before adding the next mouse.36,37 A video tracking application (Tox Trac Organism Video Tracking Application, version 2.80) was used at the end of the study to analyze all recorded videos in terms of the vertical movement, total distance (mm), mobility rate (%), mobility average speed (mm/s) and exploration rate (%).
Rotarod
This test is performed using a rotarod (5 cm in diameter) with a constant speed of 18 rotations per minute (rpm). It is used to assess the motor coordination of the animals and their ability to maintain their balance before and after EAE induction as well as post treatments. Each animal is placed on the rotating drum and the latency to fall (in seconds) is calculated with cut-off time of 5 minutes. Animals were trained on the device 3 days prior to testing and this test was also performed on days 0, 3, 7, 10, 14, 21 and 28 post induction.38,39
Grip Strength
On the same days, grip strength test was performed to evaluate the strength of the forelimbs of the mice and how their performance was affected throughout the study. This test was done by holding each mouse from the tail and allowing its forepaws to grab a metal wire. The mouse was then released and allowed to hold the wire freely. The latency to fall (in seconds) is calculated three times and an average was calculated for each mouse.40
Biochemical Analysis
At the end of the study, animals were sacrificed by decapitation under light anesthesia, brains were dissected and homogenized in 10% PBS then the values of several biochemical parameters including interferon-γ (IFN-γ), myeloperoxidase (MPO), interleukin-10 (IL-10), interleukin-4 (IL-4), tumor necrosis factor alpha (TNF-α), nuclear factor kappa B (NF-kB), brain derived neurotrophic factor (BDNF) and transforming growth factor beta (TGF-β) were estimated using suitable mouse Enzyme-Linked Immunosorbent Assay (ELISA) kits (Sinogeneclon Co., Ltd, Hangzhou, China). The procedures were performed according to the manufacturer’s manual. Additionally, Nuclear Factor Kappa B p65 subunit (NF-kB p65 subunit) levels were analyzed colorimetrically.
Western Blot
Western blot method was used to detect the levels of 2’, 3’ cyclic nucleotide 3’ phosphodiesterase (CNP). After protein extraction using RIBA buffer, samples were loaded on the sodium dodecyl sulphate polyacrylamide gel electrophoresis (SDS-PAGE) and were separated according to their molecular weights (BioRad mini protein electrophoresis separation unit and BioRad electrophoresis power supply). Following electrophoresis, proteins were transferred from the gel to Polyvinylidene difluoride (PVDF) membrane using BioRad Trans-Blot Turbo instrument. The membrane was blocked using 3% bovine serum albumin (BSA) in tris-buffered saline with 0.1% Tween 20 at room temperature for 1 hour. Afterwards, the membrane was incubated with a 1:2000 dilution of antibodies against CNP (Thermo Fisher, USA) at 4°C overnight. Next, membranes were probed with horseradish peroxidase-conjugated immunoglobulins solution (HRP-lmg Goat mab -Novus Biologicals) for 1 hour at room temperature. The chemiluminescent substrate (ClarityTM Western ECL substrate - BIO-RAD, USA cat#170-5060) was applied to the blot and signals were captured using a CCD camera-based imager. Image analysis software was used to read the band intensity of the target proteins against control sample after normalization by beta actin on the Chemi Doc MP imager.
Quantitative Real-Time Reverse Transcription Polymerase Chain Reaction (RT-RT-PCR)
Oligodendrocyte Transcription Factor-1 (Olig-1) was determined using RT-RT-PCR. Total RNA was isolated using Qiagen tissue extraction kit (Qiagen, USA) according to instructions of manufacture. RNA was used for cDNA conversion using high capacity cDNA reverse transcription kit (Fermentas, USA). Real-time qPCR amplification and analysis were performed using an Applied Biosystem with software version 3.1 (StepOne™, USA). The primer sequence is shown Table 2.
 |
Table 2 The Primer Sequence of Olig-1 and Beta Actin |
All values were normalized to β-actin levels.
Histopathological Analysis
The brain of 2 mice from each group were carefully removed, flushed and fixed in 10% neutral buffered formalin for 72 hrs. Samples were trimmed and processed in serial grades of ethanol, cleared in xylene, synthetic wax infiltration and embedding into paraplast tissue embedding media. 5μn thick sagittal brain sections were cut by rotatory microtome. Tissue sections were stained with Harris Hematoxylin and Eosin (H&E) as a general tissue examination staining method. Furthermore, Luxol fast blue (LFB) stain was used for demonstration of myelinated nerve fibers in corpus callosum. Mean area percent of positively stained myelinated nerve fibers in corpus callosum region from 6 random non-overlapping fields per tissue section stained by LFB from different samples of all groups.
All micrographs and data were obtained by using full HD microscopic camera operated by Leica application module for tissue sections analysis (Leica Microsystems GmbH, Wetzlar, Germany)”. All methods of tissue sample preparation and staining as outlined by Drury and Wallington.41
Statistical Analysis
The data of all the biochemical parameters in addition to the % myelination using LFB were analyzed using one-way ANOVA followed by Tukey’s multiple comparison test. Behavioural tests were analyzed using two-way ANOVA followed by Tukey’s multiple comparison test. GraphPad Prism software (version 7.04; GraphPad Software, Inc., San Diego, CA, USA) was used to perform the statistical analysis and create the graphs. ROUT method was used to test for outliers and Kolmogorov–Smirnov test was used as a normality test.
Results
Effect of EAE and Different Treatments on Body Weight and Clinical Score
The scores and mean body weights of the mice on specific days are represented in Table 3. It showed that the mean weights in the group representing the model and EAE+PLGA group decreased from day 0 to day 30 and the later results were significantly different from that of the control group. It can also be seen that the mean weights were almost steady throughout the period of experimentation in the groups in which EAE was induced and then treated with either rhMBP or rituximab. The group that was given the nanoformulation showed increase in the mean weights after EAE induction and its results followed the same pattern of the control group. This is also represented in Figure 4A and Supplementary Figure S1. Turning now to the scores, by comparing the results representing the model and the group treated with PLGA nanoparticle after EAE induction with the other groups, it can be concluded that the animals in both groups experienced more clinical symptoms of the disease. On the other hand, the scores of the other groups were better and showed improvement in the clinical condition of the mice. The results of the group given the nanoparticle enclosing rhMBP with rituximab on its surface were better than other groups in terms of ameliorating the clinical symptoms reflected in low score values. This is also represented in Figure 4B and Supplementary Figure S1 (Full data are shown in Supplementary Table S1).
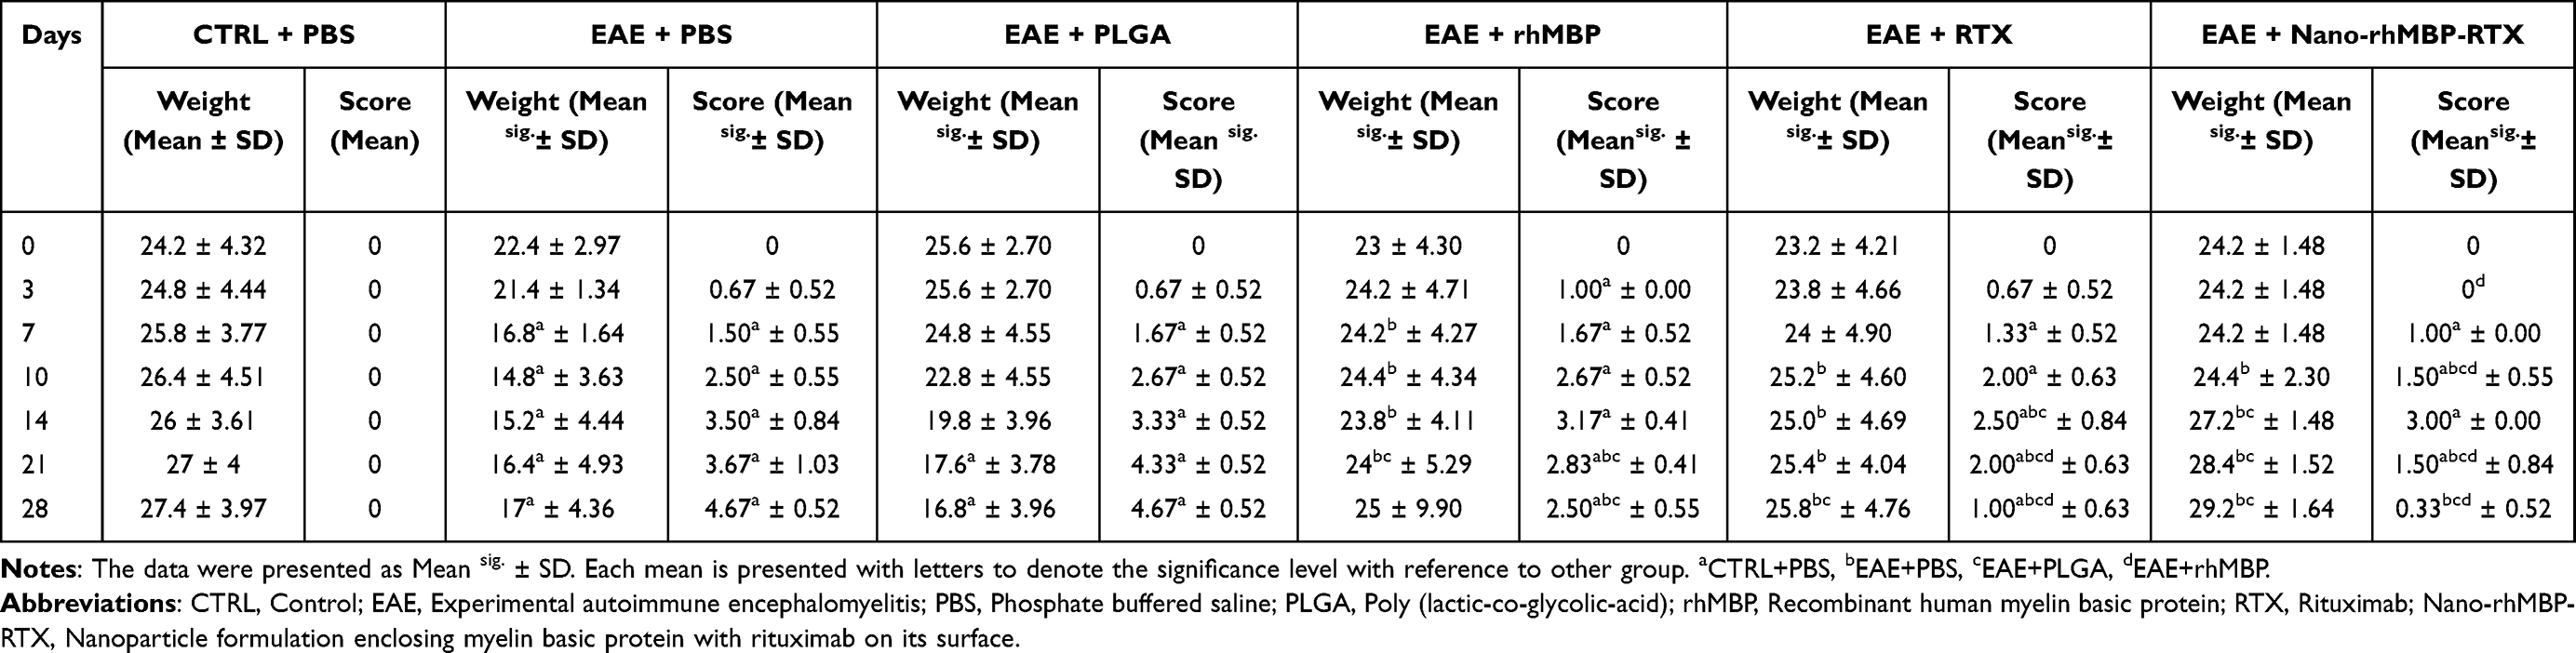 |
Table 3 Results of the Measured Weights and Observed Scores of C57BL/6 Mice in All Groups |
 |
Figure 4 Line charts representing (A) the changes in the weights and (B) scores of the mice throughout the period of experimentation especially on days 0, 3, 7, 10, 14, 21 and 28 post induction and the results were plotted accordingly. The level of significance is presented with letters with reference to the other groups. (a) CTRL+PBS, (b) EAE+PBS, (c) EAE+PLGA, (d) EAE+rhMBP. Each data point represents the mean of experiments ± S.D. (n = 8). Statistical analyses were performed using Two-way ANOVA followed by Tukey’s post hoc test, and the criterion for statistical significance was set to p < 0.05. Abbreviations: CTRL, Control; EAE, Experimental autoimmune encephalomyelitis; PBS, Phosphate buffered saline; PLGA, Poly (lactic-co-glycolic-acid); rhMBP, Recombinant human myelin basic protein; RTX, Rituximab; Nano-rhMBP-RTX, Nanoparticle formulation enclosing myelin basic protein with rituximab on its surface. |
Behavioral Parameters
Effect of EAE and Different Treatments on Rotarod and Grip Strength Tests
The results represented in the line charts (Figure 5 and Supplementary Figure S2) of the groups in which EAE was induced and no treatment option was provided (EAE+PBS, EAE+PLGA) showed a progressive decline throughout the duration of these tests. The charts revealed that the behavior of the mice in the EAE+Nano-rhMBP-RTX group declined in both rotarod and grip strength testing reaching the least values on days 7 and 10, respectively, and then this was improved gradually and significantly after treatment till the end of the experimentation. The other groups that were treated with rhMBP or RTX after induction showed the same pattern of declination and then improvement after treatment but with different significance levels.
 |
Figure 5 Line charts representing the behavioral changes that occurred to the mice throughout the period of experimentation, (A) Rotarod and (B) grip strength were done on days 0, 3, 7, 10, 14, 21 and 28 post induction and the results were plotted accordingly. The level of significance is presented with letters with reference to the other groups. (a) CTRL+PBS, (b) EAE+PBS, (c) EAE+PLGA, (d) EAE+rhMBP, (e) EAE+RTX. Each data point represents the mean of experiments ± S.D. (n = 8). Statistical analyses were performed using Two-way ANOVA followed by Tukey’s post hoc test, and the criterion for statistical significance was set to p < 0.05. Abbreviations: CTRL, Control; EAE, Experimental autoimmune encephalomyelitis; PBS, Phosphate buffered saline; PLGA, Poly (lactic-co-glycolic-acid); rhMBP, Recombinant human myelin basic protein; RTX, Rituximab; Nano-rhMBP-RTX, Nanoparticle formulation enclosing myelin basic protein with rituximab on its surface. |
Effect of EAE and Different Treatments on Movement and Performance in an Open Field
EAE induction reduced the movement of the animals in the model group when compared to the control group; this is reflected in Figure 6 which shows reduction in the total distance moved, rearing, exploration percent, mobility average speed and mobility rate along with increased latency. Data also drags the attention to the maximum improved performance from around day 14 post induction in EAE+Nano-rhMBP-RTX group. The recorded movements of mice are presented in Figure 7. (Results of each group are represented separately in Supplementary Figures S3 and S4).
 |
Figure 6 Line charts representing the movement of the animal in an open field, (A) Rearing, (B) Total distance, (C) Mobility average speed, (D) Mobility rate and (E) Exploration rate were done on days 0, 3, 7, 10, 14, 21 and 28 post induction and the results were plotted accordingly. The level of significance is presented with letters with reference to the other groups. (a) CTRL+PBS, (b) EAE+PBS, (c) EAE+PLGA, (d) EAE+rhMBP, (e) EAE+RTX. (F) Representative digital images showing zones explored by animals during the test on day 28 post induction. The color of the zone indicates the activity frequency, blue represents the least frequency followed by light blue, yellow and finally red. i. Model group, ii. EAE+Nano-rhMBP-RTX. Each data point represents the mean of experiments ± S.D. (n = 8). Statistical analyses were performed using Two-way ANOVA followed by Tukey’s post hoc test, and the criterion for statistical significance was set to p < 0.05. Abbreviations: CTRL, Control; EAE, Experimental autoimmune encephalomyelitis; PBS, Phosphate buffered saline; PLGA, Poly (lactic-co-glycolic-acid); rhMBP, Recombinant human myelin basic protein; RTX, Rituximab; Nano-rhMBP-RTX, Nanoparticle formulation enclosing myelin basic protein with rituximab on its surface. |
 |
Figure 7 Representative sample of the paths of the animals during the time of the test on day 28 post induction. The lines represent the path of one animal from the indicated treatment group during the 5 minutes observation period of the open-field test. These shots were taken using Tox trac software while analyzing the recorded videos. Abbreviations: CTRL, Control; EAE, Experimental autoimmune encephalomyelitis; PBS, Phosphate buffered saline; PLGA, Poly (lactic-co-glycolic-acid); rhMBP, Recombinant human myelin basic protein; RTX, Rituximab; Nano-rhMBP-RTX, Nanoparticle formulation enclosing myelin basic protein with rituximab on its surface. |
Biochemical Determinations
Effect of EAE and Different Treatments on Inflammatory Biomarkers
The bar chart (Figure 8) shows that induction of EAE without treatment increased the levels of interferon-γ (IFN-γ), myeloperoxidase (MPO) and interleukin-10 (IL-10) to about 1.5 times the PBS control, whereas it decreased the levels of interleukin-4 (IL-4) to about 37% of the corresponding control. By contrast, in the groups in which encephalomyelitis was induced and then treated with rhMBP or the new formulation, levels of IFN-γ, MPO and IL-10 were almost halved. Only the values of IFN-γ and IL-10 were reduced to almost 60% when comparing RTX+EAE group with the EAE PBS control. EAE+Nano-rhMBP-RTX group showed a notable elevation in IL-4 levels to about two folds EAE+PBS control group.
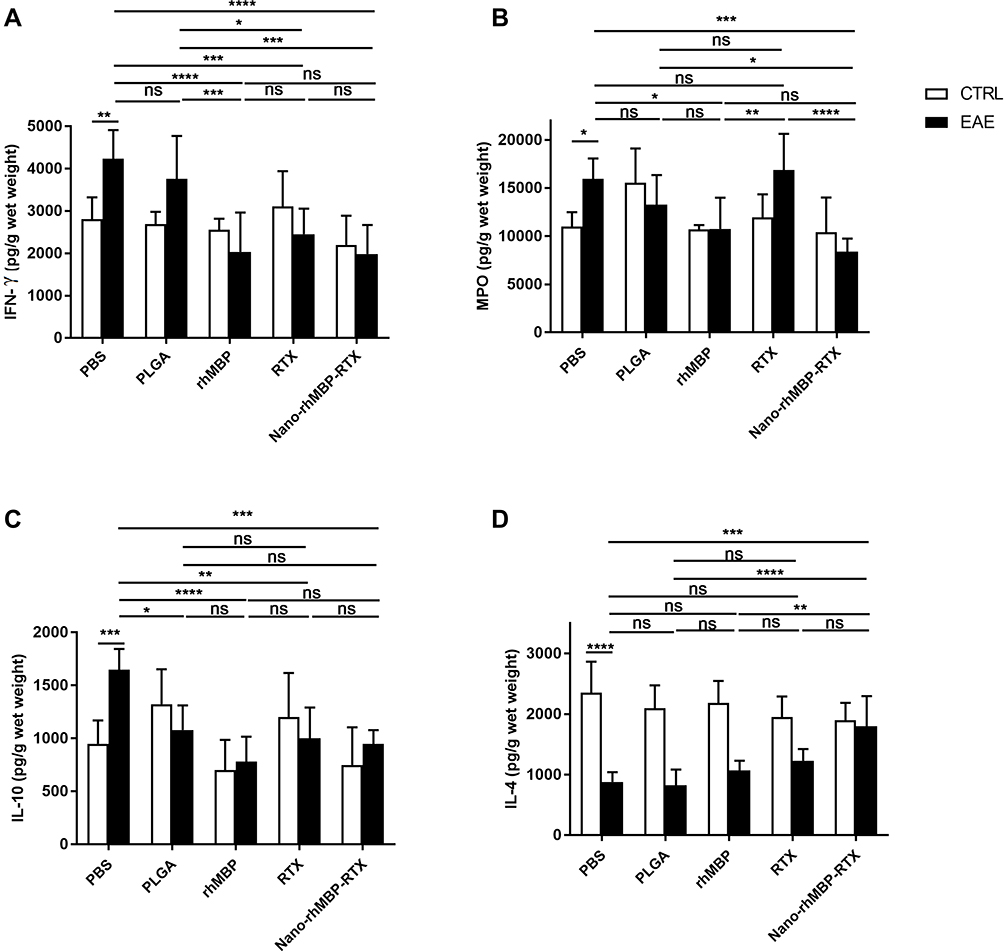 |
Figure 8 EAE induction and different treatments impact on the levels of the inflammatory biomarkers; (A) IFN-γ, (B) MPO, (C) IL-10 and (D) IL-4. Each bar with a vertical line represents the mean of experiments ± S.D. (n=6). Statistical analysis were performed using one-way ANOVA followed by Tukey’s post hoc test. Significance levels are presented as follows: *p < 0.05, **p < 0.01, ***p < 0.005, ****p < 0.001. Abbreviations: ns, no significance; CTRL, Control; EAE, Experimental autoimmune encephalomyelitis; PBS, Phosphate buffered saline; PLGA, Poly (lactic-co-glycolic-acid); rhMBP, Recombinant human myelin basic protein; RTX, Rituximab; Nano-rhMBP-RTX, Nanoparticle formulation enclosing myelin basic protein with rituximab on its surface. |
Effect of EAE and Different Treatments on BDNF, TNF-α, TGF-β and NF-kB Signaling
The results of the analysis represented in Figure 9 indicates that when EAE is induced, the values of tumor necrosis factor alpha (TNF-α) increased to 2 folds and the values of nuclear factor kappa B (NF-kB) increased to nearly 1.5 folds of the corresponding control. Other biochemical parameters such as brain derived neurotrophic factor (BDNF) and transforming growth factor beta (TGF-β) were reduced to 72% and 55.54%, respectively, of the corresponding control. A reduction in the levels of TNF-α was also found in both groups that were treated with rhMBP or rituximab after EAE induction to 61.09% and 37.37%, respectively, when compared to the model while only the group treated with rhMBP following EAE induction experienced a reduction in the levels of NF-kB to almost half. In the Nano-rhMBP-RTX+EAE group the levels of TNF-α and NF-kB were reduced to 25.82% and 58.7%, respectively, and the values of BDNF and TGF-β were increased compared with the model.
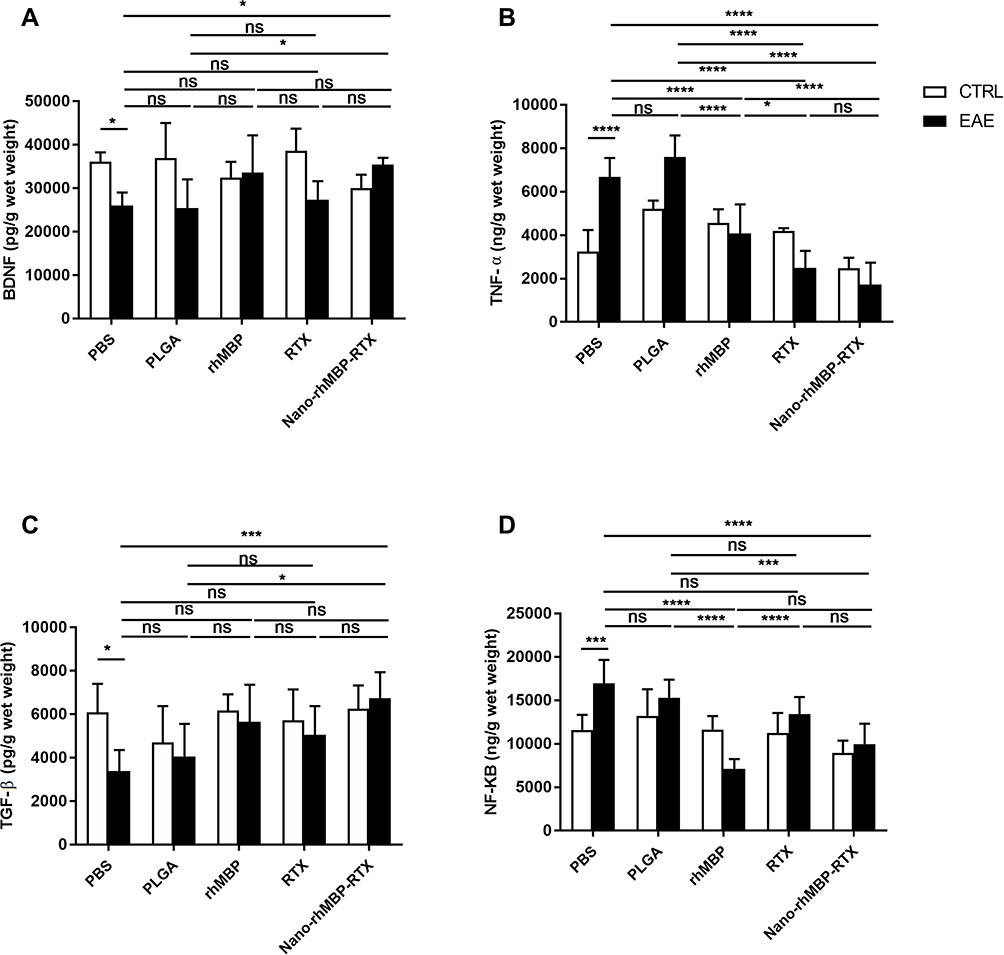 |
Figure 9 EAE induction and different treatments impact on the levels (A) BDNF, (B) TNF-α, (C) TGF-β and (D) NF-kB. Each bar with a vertical line represents the mean of experiments ± S.D. (n=6). Statistical analysis was performed using one-way ANOVA followed by Tukey’s post hoc test. Significance levels are presented as follows: *p < 0.05, ***p < 0.005, ****p < 0.001. Abbreviations: ns, no significance; CTRL, Control; EAE, Experimental autoimmune encephalomyelitis; PBS, Phosphate buffered saline; PLGA, Poly (lactic-co-glycolic-acid); rhMBP, Recombinant human myelin basic protein; RTX, Rituximab; Nano-rhMBP-RTX, Nanoparticle formulation enclosing myelin basic protein with rituximab on its surface. |
Effect of EAE and Different Treatments on Myelination/Demyelination Motifs
As presented in the charts (Figure 10), the levels of myelination markers 2’, 3’ cyclic nucleotide 3’ phosphodiesterase (CNP) and Oligodendrocyte Transcription Factor-1 (Olig-1) were reduced to almost 20% of the corresponding control after EAE was induced while the levels of demyelination determinant Nuclear Factor Kappa B p65 subunit (NF-kB p65 subunit) were increased to almost 2.5 folds of the corresponding control. When comparing the other treated groups with the model, it was found that the values of CNP were increased to around 4–5 folds and the values of Olig-1 were increased as well to about 2–3 folds. If we turn to the results of NF-kB p65 subunit, the results of all groups in which EAE was induced and then treated showed reduction to almost 50% of the model. The group treated with nanoparticle enclosing rhMBP and rituximab after EAE induction showed the highest percent change than the other treatment groups.
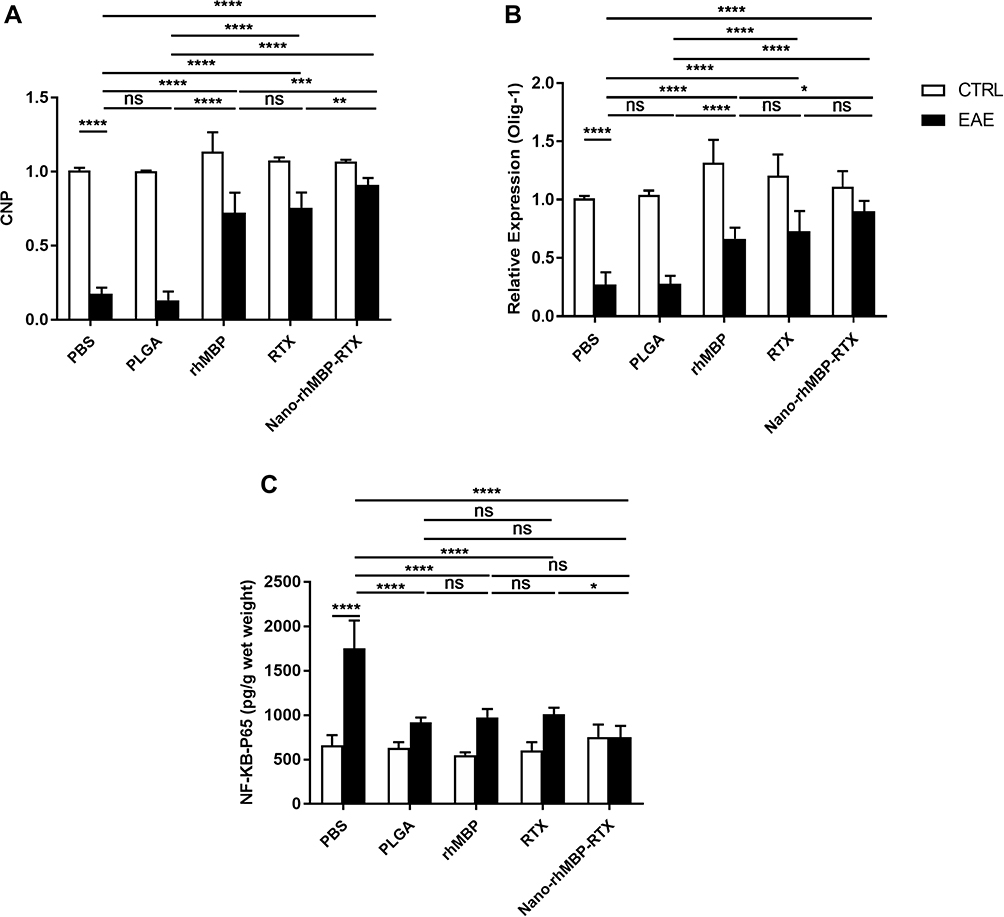 |
Figure 10 EAE induction and different treatments impact on the levels of (A) CNP, (B) Olig-1 and (C) NF-kB p65 subunit. Each bar with a vertical line represents the mean of experiments ± S.D. (n=6). Statistical analysis was performed using one-way ANOVA followed by Tukey’s post hoc test. Significance levels are presented as follows: *p < 0.05, **p < 0.01, ***p < 0.005, ****p < 0.001. Abbreviations: ns, no significance; CTRL, Control; EAE, Experimental autoimmune encephalomyelitis; PBS, Phosphate buffered saline; PLGA, Poly (lactic-co-glycolic-acid); rhMBP, Recombinant human myelin basic protein; RTX, Rituximab; Nano-rhMBP-RTX, Nanoparticle formulation enclosing myelin basic protein with rituximab on its surface. |
Histopathological Analysis
Examination of CA1 and CA3 Hippocampal Regions Using H&E Stain
Microscopic examination of hippocampal regions was performed to assess the effect of EAE induction on these areas as well as the effect of different treatments in ameliorating the EAE-generated damages. After examining all hippocampal areas, CA1 and CA3 regions were found to be the most affected regions which are worth focusing on. All groups in which EAE was not induced demonstrated normal morphological features of CA1 and CA3 hippocampal layers with apparent intact pyramidal neurons having well-defined cellular details, normal intercellular tissue with few scattered glial cells (Figure 11A–J). It is also apparent that the most affected group with respect to CA1 hippocampal region was the model (Figure 11K) which displayed the presence of severe neuronal damage and loss with many shrunken, darkly pyknotic pyramidal neurons, moderate perineuronal edema and glial cells infiltrate. Similarly, CA3 hippocampal region (Figure 11L) was affected showing moderate neuronal damage and loss with many shrunken, darkly pyknotic pyramidal neurons alternated with fewer apparent intact cells, moderate perineuronal edema and glial cells infiltrate. Likewise, the group that was treated with the empty nanoparticle after EAE induction (Figure 11M) displayed the presence of CA1 hippocampal damage reflected in the persistence of many damaged and degenerated pyramidal neurons altered with apparent intact cells, moderate perineuronal edema and mild glial cells infiltrate. When observing the CA3 hippocampal region of this group (Figure 11N), it was noticed that it contained almost intact pyramidal cells with minimal records of cellular damage or alteration, however, persistence of mild perineuronal edema and glial cell infiltrate were recorded. The CA1 hippocampal region of the group that was given rhMBP after disease induction (Figure 11O) contained moderate higher glial cell infiltrates while in the CA3 hippocampal region (Figure 11P) the damage was similar to that of the model. The other group treated with RTX after disease induction showed variable mixture of damaged, shrunken darkly stained pyramidal neurons with moderate perineuronal edema alternated with apparent intact neurons along with the presence of mild glial cells infiltrate in both CA1 and CA3 hippocampal regions with the exception of the edema being mild in CA3 hippocampal region (Figure 11Q and R). The group given the nanoformulation after EAE induction displayed no apparent damage in CA1 hippocampal layers with apparent intact pyramidal neurons having well-defined cellular details and only few scattered glial cells (Figure 11S) and in the CA3 hippocampal regions, most of the pyramidal neurons were apparently intact without abnormal cellular alteration with few scattered degenerated neurons, mild perineuronal edema and mild glial cell infiltrates (Figure 11T). The severity of the damage that occurred in these areas among different groups is represented in Table 4.
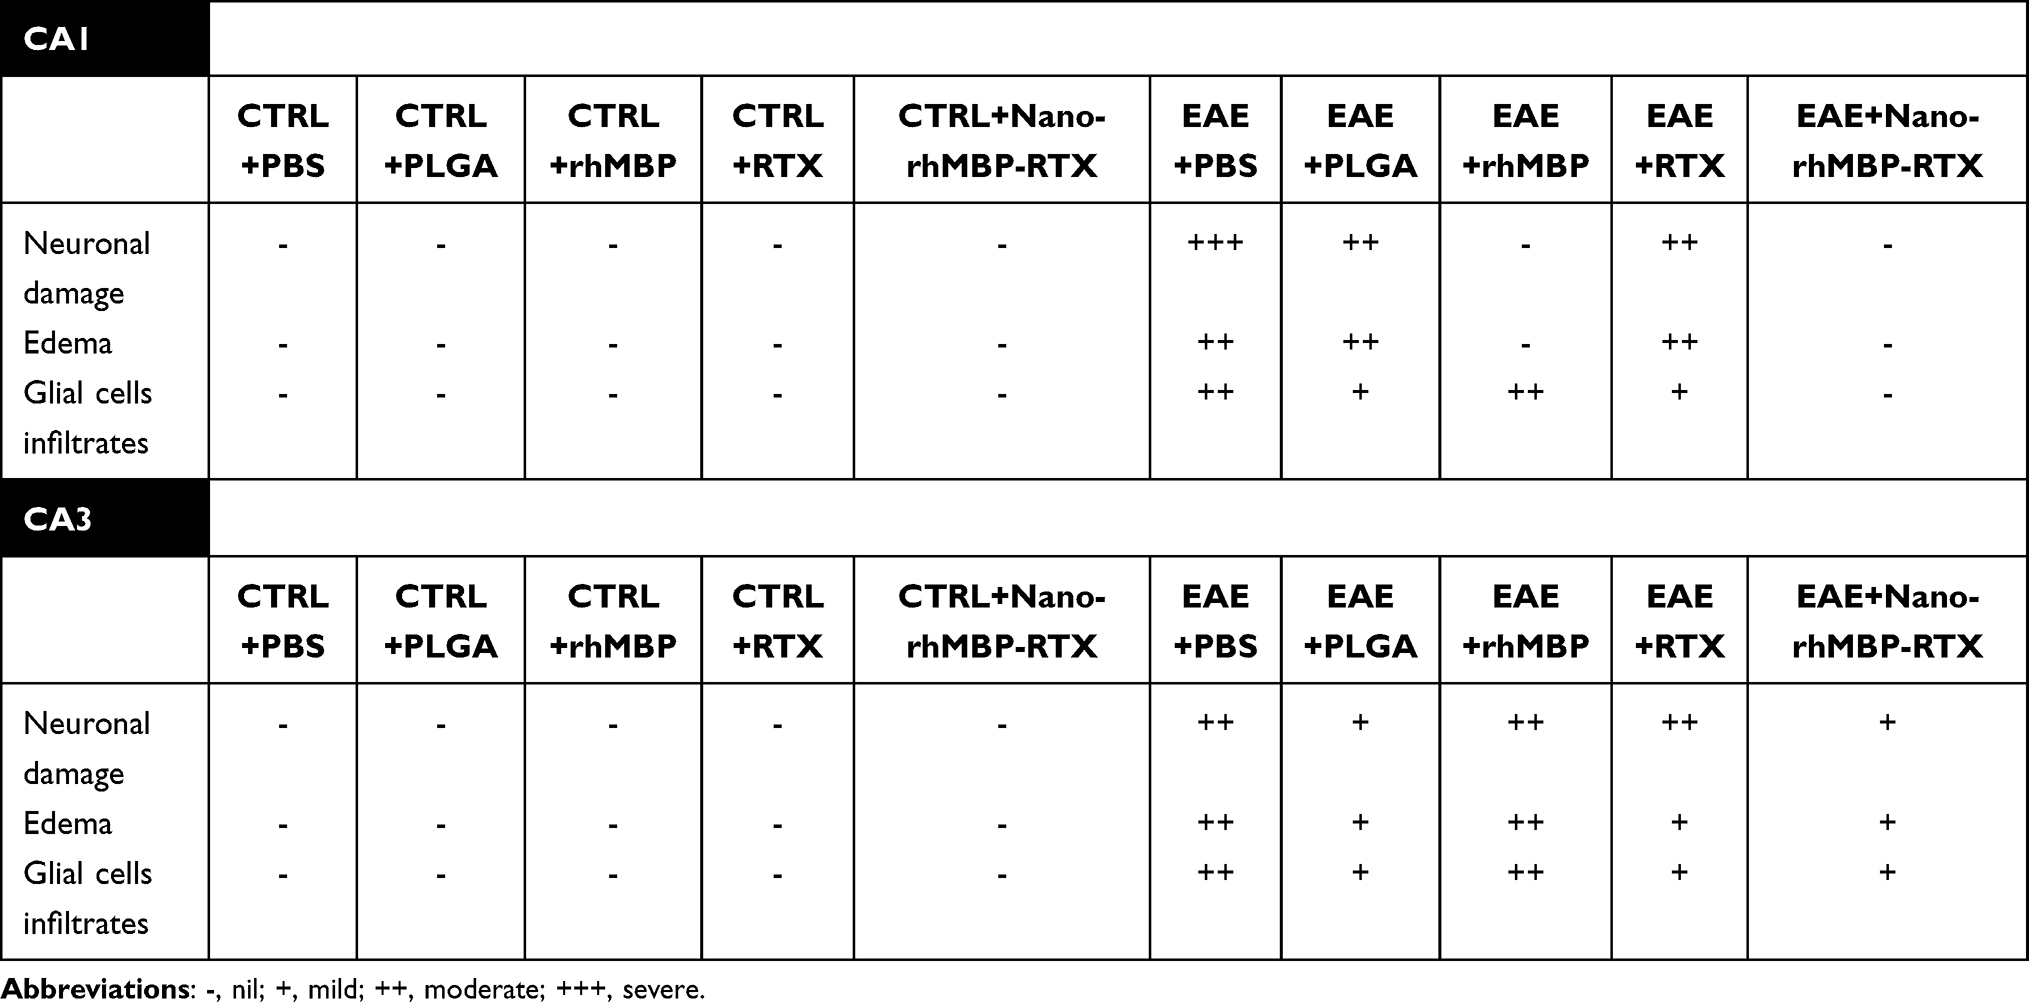 |
Table 4 H&E Stain Results Indicating the Severity of the Damage Induced Among All Experimental Groups in CA1 and CA3 Hippocampal Regions |
 |
Figure 11 CA1/hippocampal regions and CA3/hippocampal regions stained with H&E stain. Normal control group (A and B), different treatments’ control groups (C–J), model (K and L), treated groups after disease induction (M–T). Black arrows point to intact neurons, red arrows indicate damaged, degenerated neurons and arrow heads mark the glial cells infiltrates. Abbreviations: CTRL, Control; EAE, Experimental autoimmune encephalomyelitis; PBS, Phosphate buffered saline; PLGA, Poly (lactic-co-glycolic-acid); rhMBP, Recombinant human myelin basic protein; RTX, Rituximab; Nano-rhMBP-RTX, Nanoparticle formulation enclosing myelin basic protein with rituximab on its surface. |
Examination of Myelin Sheath in the Corpus Callosum Using Luxol Fast Blue Stain
The corpus callosum in the brains of all groups was examined using Luxol fast blue staining as shown in Figure 12A–J with the residual myelin fragments pointed at since demyelination and axonal damage in this area is a remarkable feature of MS. As represented in Figure 12K, induction of EAE caused reduction in the reactive myelin % to nearly quarter the corresponding control likewise in the EAE+PLGA group it decreased to almost ¼ of the control group. The percentages of the groups treated with rhMBP and RTX after disease induction increased by 78%, and 88% of the model, respectively. An even higher increase of the % myelination was found when comparing the group given Nano-rhMBP-RTX after EAE induction with the model by almost 1.5 folds.
 |
Figure 12 Photomicrographs of corpus callosum sections stained with Luxol fast blue stain. Shown are the stains from the non-EAE-induced control groups (CTRL) with the different treatment options as indicated (A–E). EAE-induced groups for the same treatment options are shown in (F–J). Arrows point to the myelin fragments in the corpus callosum. (K) EAE induction and different treatments impact on the % myelination in the corpus callosum. Each bar with a vertical line represents the mean of experiments ± S.D. (n=2). Statistical analysis was performed using ANOVA followed by Tukey’s post hoc test. Significance levels are presented as follows: **p < 0.01, ***p < 0.005, ****p < 0.001. Abbreviations: ns, no significance; CTRL, Control; EAE, Experimental autoimmune encephalomyelitis; PBS, Phosphate buffered saline; PLGA, Poly (lactic-co-glycolic-acid); rhMBP, Recombinant human myelin basic protein; RTX, Rituximab; Nano-rhMBP-RTX, Nanoparticle formulation enclosing myelin basic protein with rituximab on its surface. |
Discussion
The purpose of this study was to test the possible neuroprotective effect of a nanoformulation enclosing rhMBP with RTX on its surface in managing MS symptoms and limiting the disease progression. Based on accumulating evidence, RTX was found to be highly effective for MS with a tolerable safety profile.14,42 C57BL/6 mice were first subjected to EAE induction (except the control groups) using a single subcutaneous injection of a 100 µL emulsion of MOG (35–55) and CFA along with an intraperitoneal injection of pertussis toxin on days 0 and 2. Several follow-up methods and tests were performed varying from behavioural, biochemical and histopathological analyses in addition to scoring and weighing the mice daily. After some days post induction when the majority reached a clinical score of 3, each group was given its corresponding treatment whether empty PLGA nanoparticle, RTX, rhMBP, or the tested nanoformulation.
Following EAE induction, immune-mediated implications occur which have an important role in the evolution of MS lesions and hence the disease progression. The resultant production of certain inflammatory cytokines such as IFN-γ and TNF-α promotes inflammation.43 This is reflected in our study as the model group showed rise in the levels of these parameters as well as MPO levels which is an enzyme correlated with the disease severity.44 Levels of NF-kB p65 subunit which has a role in driving the inflammatory immune responses were also elevated in this group post induction.45 In contrast, BDNF levels were reduced as it is negatively affected by the circulating cytokines as well as the decrease in the levels of TGF-β, CNP, IL-4 and Olig-1. Predictably, the group in which EAE was induced and then empty nanoparticles were given demonstrated the same responses as the model since no actual treatment was provided. Reversing the trend of the untreated EAE group, rhMBP and RTX treatments post induction resulted in a reduction of IFN-γ, NF-kB and TNF-α levels and increased values for CNP and Olig-1. These results are supported by preceding studies which showed nearly similar results.21,46,47 The greatest improvement in the previous parameters was achieved by treating EAE-induced mice with the nanoformulation enclosing rhMBP with RTX on its surface. It showed a marked elevation in the levels of IL-4 which has a potent anti-inflammatory property compared to the EAE-PBS group, highest rise in the levels of both CNP and Olig-1 as well as an increase in BDNF and TGF-β. For NF-kB and TNF-α, where the levels went up following EAE induction, values declined afterwards compared to the controls. The differences observed between the group treated with the free rhMBP and the other treated with the nanoformulation encapsulating rhMBP were previously studied where the latter demonstrated superiority.21 The amelioration of MS signs can be attributed to the fact that although RTX is an antibody against B-cells, its effect on T-cells is intriguing as it causes depletion in the CD20+ T-cells. The reduction in T-cell infiltration into the brain after RTX treatment was observed and could be due to the lack of B-cells, which could act as antigen-presenting cells for T-cells, or perhaps this drug may affect T-cell recruitment and activation through paracrine fashion.48 Furthermore, it has been previously shown that T-cells in the peripheral blood of healthy donors or rheumatoid arthritis patients express CD20 which may be depleted upon RTX therapy.49 On the other hand, the neuroprotection afforded by rhMBP is thought to be by suppressing inflammation and lowering pro-inflammatory cytokines as IFN-γ, TNF-α and IL-17 as well as improving cytoprotective mechanisms which may lead to protection against cytokine-mediated demyelination of CNS axon.50 Interestingly, in the nanoparticle formulated rhMBP-RTX treated group, the animals had higher body weights and lower signs’ scores in comparison with other treatment groups indicating more amelioration of the MS signs. An effect that can be attributed first to the combination of these two drugs and secondary to the relative superiority of the nanoparticle preparation over the free rhMBP or RTX in exhibiting a sustained release pattern and thus a relatively better efficacy.
Biochemical assessments were complemented by performing behavioural tests that reflect the performance of animals along with following up the changes in their weights and clinical scores throughout the study. The group representing the EAE model showed deterioration in almost all behavioural tests demonstrating the least values for both the rotarod and the grip strength in addition to a decline in the movement within the open-field test. It also experienced significant reduction in the weights of the mice throughout the course of the study along with an increase in the clinical scoring denoting the development of more clinical symptoms of the disease. Our results were consistent with prior studies that reported comparable outcomes following EAE induction.5,51 Contrary to their controls, in the rhMBP and RTX treated groups following EAE induction, weights and scores recorded daily remained almost steady with no significant changes which verified that these treatments were capable of causing considerable improvements. Interestingly, in the nanoformulation treated group, in almost all the behavioural tests performed, the animals improved gradually after the treatment was initiated and showed essentially a full recovery at the end of the experiments with levels comparable to animals in the non-induced control group CTRL+PBS. This was also reflected in having lower clinical scores indicating more amelioration of the clinical symptoms. In nearly all the previously mentioned tests, there were differences between the EAE-induced and the non-induced control group which demonstrates that we have achieved comprehensive EAE induction with our approach.
The beneficial effects of the treatments were also confirmed by histopathological examination of brain sections stained with hematoxylin and eosin (H&E) as well as LFB stained brain sections. EAE induction mostly affected the CA1 and CA3 regions while other regions appeared relatively normal. Previous studies mentioned the effect of EAE on these 2 regions.52,53 The nano-rhMBP-RTX group was associated with the least damage and showed only mild damage, edema and infiltration in both regions (Table 4). Analysis of the corpus callosum for changes to the myelination level detected an increase by 1.5 folds in the nano-rhMBP-RTX group compared to untreated EAE-PBS control group. On the other hand, in the EAE group, the CA1 region had severe neuronal damage, moderate edema and moderate glial cell infiltrates compared to CA3 region which was mildly injured. Groups treated with either rhMBP or RTX showed moderate neuronal damage with mild glial cell infiltrates in both regions. Overall, nano-rhMBP-RTX was the most effective treatment in bringing the EAE-affected levels of the measured compounds back or close to normal.
This study was limited to male mice specifically C57BL/6 strain weighing 20–25 g so it needs to be extrapolated on animals with other demographics. Also, deeper investigation in the clinical arena should be taken into consideration in future work. Contrary to expectations, the levels of IL-10 were found to be elevated in the model group compared to its control whereas in the group treated with the nanoparticle formulation its levels were reduced. Although this is not a general outcome in most of the previous literature, as several studies support the role of IL-10 in inhibiting EAE due to its role as an anti-inflammatory cytokine, but some other studies stated that its role is still controversial, and that it might have either no effect or tends to exacerbate the severity of EAE in mice so this left an open question that should be addressed in future studies.54,55
Conclusion
The combined results from the group treated with the formulation enclosing rhMBP with RTX on its surface showed that with this treatment great improvement can be achieved by ameliorating the adverse effects induced in the EAE model. The effectiveness of this formulation was demonstrated by the normalization of EAE-induced behavioral changes and aberrant levels of specific biochemical markers as well as reduced damage of hippocampal tissues and retaining higher levels of myelination. Despite these auspicious results, further studies will be required to prove its safety and efficacy and develop the nano-rhMBP-RTX formulation into a novel treatment option for MS patients.
Acknowledgment
We would like to thank Dr. Ahmed H. Nadim, Lecturer in the Analytical Chemistry Department, Faculty of Pharmacy, Cairo University, for his technical assistance.
Funding
The work was supported by the Science and Technology Development Fund (STDF), Ministry of Scientific Research, Egypt (ID 5875). Part of the Article Processing Charge (APC) for publishing this article was funded by Cairo University.
Disclosure
Götz Laible reports grants from Ministry of Business, Innovation and Employment, during the conduct of the study. The authors report no other potential conflicts of interest in relation to this work.
References
1. Bhattacharya A, Mishra R, Tiwari P. Multiple sclerosis: an overview. Asian Pac J Trop Biomed. 2012;2(3):S1954–S1962. doi:10.1016/S2221-1691(12)60525-5
2. Wallin MT, Culpepper WJ, Nichols E, et al. Global, regional, and national burden of multiple sclerosis 1990–2016: a systematic analysis for the Global Burden of Disease Study 2016. Lancet Neurol. 2019;18(3):269–285. doi:10.1016/S1474-4422(18)30443-5
3. Dolati S, Babaloo Z, Jadidi-Niaragh F, Ayromlou H, Sadreddini S, Yousefi M. Multiple sclerosis: therapeutic applications of advancing drug delivery systems. Biomed Pharmacother. 2017;86:343–353. doi:10.1016/j.biopha.2016.12.010
4. Disanto G, Morahan JM, Barnett MH, Giovannoni G, Ramagopalan SV. The evidence for a role of B cells in multiple sclerosis. Neurology. 2012;78(11):823–832. doi:10.1212/WNL.0b013e318249f6f0
5. Robinson AP, Harp CT, Noronha A, Miller SD. The experimental autoimmune encephalomyelitis (EAE) model of MS. In: Handbook of Clinical Neurology. Vol. 122. Elsevier; 2014:173–189.
6. Gohil K. Multiple sclerosis: progress, but no cure. P T. 2015;40(9):604–605.
7. Weinstock-Guttman B, Ramanathan M, Zivadinov R. Interferon-beta treatment for relapsing multiple sclerosis. Expert Opin Biol Ther. 2008;8(9):1435–1447. doi:10.1517/14712598.8.9.1435
8. Comi G, Amato MP, Bertolotto A, et al. The heritage of glatiramer acetate and its use in multiple sclerosis. Mult Scler Demyelinating Disord. 2016;1(1):6. doi:10.1186/s40893-016-0010-2
9. Brandstadter R, Katz Sand I. The use of natalizumab for multiple sclerosis. NDT. 2017;13:1691–1702. doi:10.2147/NDT.S114636
10. Bloomgren G, Richman S, Hotermans C, et al. Risk of natalizumab-associated progressive multifocal leukoencephalopathy. N Engl J Med. 2012;366(20):1870–1880. doi:10.1056/NEJMoa1107829
11. Chun J, Hartung HP. Mechanism of action of oral fingolimod (FTY720) in multiple sclerosis. Clin Neuropharmacol. 2010;33(2):91–101. doi:10.1097/WNF.0b013e3181cbf825
12. Iaffaldano P, Lucisano G, Pozzilli C, et al. Fingolimod versus interferon beta/glatiramer acetate after natalizumab suspension in multiple sclerosis. Brain. 2015;138(11):3275–3286. doi:10.1093/brain/awv260
13. Alping P, Askling J, Burman J, et al. Cancer risk for fingolimod, natalizumab, and rituximab in multiple sclerosis patients. Ann Neurol. 2020;87(5):688–699. doi:10.1002/ana.25701
14. Ineichen BV, Moridi T, Granberg T, Piehl F. Rituximab treatment for multiple sclerosis. Mult Scler. 2020;26(2):137–152. doi:10.1177/1352458519858604
15. Salzer J, Svenningsson R, Alping P, et al. Rituximab in multiple sclerosis: a retrospective observational study on safety and efficacy. Neurology. 2016;87(20):2074–2081. doi:10.1212/WNL.0000000000003331
16. Leonidou E, Pantzaris M, Kleopa KA, Loizidou MA, Kyriakides T, Christou YP. A retrospective observational study of rituximab treatment in multiple sclerosis patients in Cyprus. Postgrad Med. 2019;131(7):486–489. doi:10.1080/00325481.2019.1649975
17. Alping P, Frisell T, Novakova L, et al. Rituximab versus fingolimod after natalizumab in multiple sclerosis patients: rituximab vs Fingolimod. Ann Neurol. 2016;79(6):950–958. doi:10.1002/ana.24651
18. Granqvist M, Boremalm M, Poorghobad A, et al. Comparative effectiveness of rituximab and other initial treatment choices for multiple sclerosis. JAMA Neurol. 2018;75(3):320. doi:10.1001/jamaneurol.2017.4011
19. Gascón F. Quintanilla-Bordás, C. A C. Effectiveness of rituximab vs. ocrelizumab for the treatment of primary progressive multiple sclerosis: a real-world observational study. J Neurol. 2022;2:1–6.
20. Chisari CG, Sgarlata E, Arena S, Toscano S, Luca M, Patti F. Rituximab for the treatment of multiple sclerosis: a review. J Neurol. 2022;269(1):159–183. doi:10.1007/s00415-020-10362-z
21. Al-Ghobashy MA, ElMeshad AN, Abdelsalam RM, Nooh MM, Al-Shorbagy M, Laible G. Development and pre-clinical evaluation of recombinant human myelin basic protein nano therapeutic vaccine in experimental autoimmune encephalomyelitis mice animal model. Sci Rep. 2017;7(1):46468. doi:10.1038/srep46468
22. Lutterotti A, Hayward-Koennecke H, Sospedra M, Martin R. Antigen-specific immune tolerance in multiple sclerosis—promising approaches and how to bring them to patients. Front Immunol. 2021;12:640935. doi:10.3389/fimmu.2021.640935
23. Hunter Z, McCarthy DP, Yap WT, et al. A biodegradable nanoparticle platform for the induction of antigen-specific immune tolerance for treatment of autoimmune disease. ACS Nano. 2014;8(3):2148–2160. doi:10.1021/nn405033r
24. Loureiro JA, Gomes B, Fricker G, Coelho MAN, Rocha S, Pereira MC. Cellular uptake of PLGA nanoparticles targeted with anti-amyloid and anti-transferrin receptor antibodies for Alzheimer’s disease treatment. Colloids Surf B Biointerfaces. 2016;145:8–13. doi:10.1016/j.colsurfb.2016.04.041
25. Allahyari M, Mohit E. Peptide/protein vaccine delivery system based on PLGA particles. Hum Vaccin Immunother. 2016;12(3):806–828. doi:10.1080/21645515.2015.1102804
26. Hakeem KR, Kamli M, Sabir JSM, Alharby HF. Diverse Applications of Nanotechnology in the Biological Sciences: An Essential Tool in Agri-Business and Health Care Systems.
27. Chountoulesi M, Demetzos C. Promising nanotechnology approaches in treatment of autoimmune diseases of central nervous system. Brain Sci. 2020;10(6):338. doi:10.3390/brainsci10060338
28. Al-Ghobashy MA, Williams MAK, Brophy B, Laible G, Harding DRK. On-line casein micelle disruption for downstream purification of recombinant human myelin basic protein produced in the milk of transgenic cows. J Chromatography B. 2009;877(16–17):1667–1677. doi:10.1016/j.jchromb.2009.04.012
29. Al-Ghobashy MA, Nadim AH, El-Sayed GM, Nebsen M. Label-free potentiometric ion flux immunosensor for determination of recombinant human myelin basic protein: application to downstream purification from transgenic milk. ACS Sens. 2019;4(2):413–420. doi:10.1021/acssensors.8b01315
30. Ramroodi N, Khani M, Ganjali Z, et al. Prophylactic effect of BIO-1211 small-molecule antagonist of VLA-4 in the EAE mouse model of multiple sclerosis. Immunol Invest. 2015;44(7):694–712. doi:10.3109/08820139.2015.1085391
31. Terry RL, Ifergan I, Miller SD. Experimental autoimmune encephalomyelitis in mice. In: Weissert R, editor. Multiple Sclerosis. Methods in Molecular Biology. Vol. 1304. New York: Springer; 2014:145–160.
32. Rodrigues DH, Sachs D, Teixeira AL. Mechanical hypernociception in experimental autoimmune encephalomyelitis. Arq Neuropsiquiatr. 2009;67(1):78–81. doi:10.1590/S0004-282X2009000100019
33. Hasselmann JPC, Karim H, Khalaj AJ, Ghosh S, Tiwari-Woodruff SK. Consistent induction of chronic experimental autoimmune encephalomyelitis in C57BL/6 mice for the longitudinal study of pathology and repair. J Neurosci Methods. 2017;284:71–84. doi:10.1016/j.jneumeth.2017.04.003
34. Green LK, Zareie P, Templeton N, Keyzers RA, Connor B, La Flamme AC. Enhanced disease reduction using clozapine, an atypical antipsychotic agent, and glatiramer acetate combination therapy in experimental autoimmune encephalomyelitis. Multiple Sclerosis J - Exp Transl Clin. 2017;3(1):205521731769872. doi:10.1177/2055217317698724
35. Miller SD, Karpus WJ. Experimental autoimmune encephalomyelitis in the mouse. Current Protocols Immunol. 2007;77(1). doi:10.1002/0471142735.im1501s77
36. Kerschensteiner M, Stadelmann C, Buddeberg BS, et al. Targeting experimental autoimmune encephalomyelitis lesions to a predetermined axonal tract system allows for refined behavioral testing in an animal model of multiple sclerosis. Am J Pathol. 2004;164(4):1455–1469. doi:10.1016/S0002-9440(10)63232-4
37. Seibenhener ML, Wooten MC. Use of the open field maze to measure locomotor and anxiety-like behavior in mice. JoVE. 2015;96:52434.
38. Shiotsuki H, Yoshimi K, Shimo Y, et al. A rotarod test for evaluation of motor skill learning. J Neurosci Methods. 2010;189(2):180–185. doi:10.1016/j.jneumeth.2010.03.026
39. Matsuo N. Behavioral profiles of three C57BL/6 substrains. Front Behav Neurosci. 2010. doi:10.3389/fnbeh.2010.00029
40. Gulinello M. Behavioural core protocols and training. Behav Core Facility. 2020;4:56.
41. Carleton HM, Drury RAB, Wallington EA. Carleton’s Histological Technique.
42. Bellinvia A, Prestipino E, Portaccio E, et al. Experience with rituximab therapy in a real-life sample of multiple sclerosis patients. Neurol Sci. 2020;41(10):2939–2945. doi:10.1007/s10072-020-04434-1
43. Ghasemi N, Razavi S, Nikzad E. Multiple sclerosis: pathogenesis, symptoms, diagnoses and cell-based therapy. Cell J. 2017;19(1):1–10. doi:10.22074/cellj.2016.4867
44. Mahfouz MM, Abdelsalam RM, Masoud MA, Mansour HA, Ahmed-Farid OA, Kenawy SA. The neuroprotective effect of mesenchymal stem cells on an experimentally induced model for multiple sclerosis in mice: MAHFOUZ ET AL. J Biochem Mol Toxicol. 2017;31(9):e21936. doi:10.1002/jbt.21936
45. Zhou Y, Cui C, Ma X, Luo W, Zheng SG, Qiu W. Nuclear factor κB (NF-κB)-mediated inflammation in multiple sclerosis. Front Immunol. 2020;11:391. doi:10.3389/fimmu.2020.00391
46. Brod SA. Ingested (oral) rituximab inhibits EAE. Cytokine. 2016;85:177–183. doi:10.1016/j.cyto.2016.06.026
47. Al-Ani MR, Raju TK, Hachim MY, et al. Rituximab prevents the development of Experimental Autoimmune Encephalomyelitis (EAE): comparison with prophylactic, therapeutic or combinational regimens. J Inflamm Res. 2020;13:151–164. doi:10.2147/JIR.S243514
48. Wilk E, Witte T, Marquardt N, et al. Depletion of functionally active CD20+ T cells by rituximab treatment. Arthritis Rheum. 2009;60(12):3563–3571. doi:10.1002/art.24998
49. Agahozo MC, Peferoen L, Baker D, Amor S. CD20 therapies in multiple sclerosis and experimental autoimmune encephalomyelitis – targeting T or B cells? Mult Scler Relat Disord. 2016;9:110–117. doi:10.1016/j.msard.2016.07.011
50. Caminero A, Comabella M, Montalban X. Tumor necrosis factor alpha (TNF-α), anti-TNF-α and demyelination revisited: an ongoing story. J Neuroimmunol. 2011;234(1–2):1–6. doi:10.1016/j.jneuroim.2011.03.004
51. Gerrard B, Singh V, Babenko O, et al. Chronic mild stress exacerbates severity of experimental autoimmune encephalomyelitis in association with altered non-coding RNA and metabolic biomarkers. Neuroscience. 2017;359:299–307. doi:10.1016/j.neuroscience.2017.07.033
52. Ziehn MO, Avedisian AA, Tiwari-Woodruff S, Voskuhl RR. Hippocampal CA1 atrophy and synaptic loss during experimental autoimmune encephalomyelitis, EAE. Lab Invest. 2010;90(5):774–786. doi:10.1038/labinvest.2010.6
53. Aharoni R, Schottlender N, Bar-Lev DD, et al. Cognitive impairment in an animal model of multiple sclerosis and its amelioration by glatiramer acetate. Sci Rep. 2019;9(1):4140. doi:10.1038/s41598-019-40713-4
54. Cannella B, Gao YL, Brosnan C, Raine CS. IL-10 fails to abrogate experimental autoimmune encephalomyelitis. J Neurosci Res. 1996;45(6):735–746. doi:10.1002/(SICI)1097-4547(19960915)45:6<735::AID-JNR10>3.0.CO;2-V
55. Croxford JL, Feldmann M, Chernajovsky Y, Baker D. Different therapeutic outcomes in experimental allergic encephalomyelitis dependant upon the mode of delivery of IL-10: a comparison of the effects of protein, adenoviral or retroviral IL-10 delivery into the central nervous system. J Immunol. 2001;166(6):4124–4130. doi:10.4049/jimmunol.166.6.4124
 © 2022 The Author(s). This work is published and licensed by Dove Medical Press Limited. The
full terms of this license are available at https://www.dovepress.com/terms
and incorporate the Creative Commons Attribution
- Non Commercial (unported, 3.0) License.
By accessing the work you hereby accept the Terms. Non-commercial uses of the work are permitted
without any further permission from Dove Medical Press Limited, provided the work is properly
attributed. For permission for commercial use of this work, please see paragraphs 4.2 and 5 of our Terms.
© 2022 The Author(s). This work is published and licensed by Dove Medical Press Limited. The
full terms of this license are available at https://www.dovepress.com/terms
and incorporate the Creative Commons Attribution
- Non Commercial (unported, 3.0) License.
By accessing the work you hereby accept the Terms. Non-commercial uses of the work are permitted
without any further permission from Dove Medical Press Limited, provided the work is properly
attributed. For permission for commercial use of this work, please see paragraphs 4.2 and 5 of our Terms.