Back to Journals » Clinical Epidemiology » Volume 14
A Framework for Visualizing Study Designs and Data Observability in Electronic Health Record Data
Authors Wang SV ![]() , Schneeweiss S
, Schneeweiss S ![]()
Received 15 January 2022
Accepted for publication 18 March 2022
Published 29 April 2022 Volume 2022:14 Pages 601—608
DOI https://doi.org/10.2147/CLEP.S358583
Checked for plagiarism Yes
Review by Single anonymous peer review
Peer reviewer comments 4
Editor who approved publication: Dr Eyal Cohen
Shirley V Wang, Sebastian Schneeweiss
Brigham and Women’s Hospital, Harvard Medical School, Boston, MA, USA
Correspondence: Shirley V Wang, Brigham and Women’s Hospital, Harvard Medical School, 1620 Tremont St, Suite 303, Boston, MA, 02120, USA, Tel +1 617-525-8376, Email [email protected]
Background: There is growing interest in using evidence generated from clinical practice data to support regulatory, coverage and other healthcare decision-making. A graphical framework for depicting longitudinal study designs to mitigate this barrier was introduced and has found wide acceptance. We sought to enhance the framework to contain information that helps readers assess the appropriateness of the source data in which the study design was applied.
Methods: For the enhanced graphical framework, we added a simple visualization of data type and observability to capture differences between electronic health record (EHR) and other registry data that may have limited data continuity and insurance claims data that have enrollment files.
Results: We illustrate the revised graphical framework with 2 example studies conducted using different data sources, including administrative claims only, EHR only, linked claims and EHR, as well as specialty community based EHRs with and without external linkages.
Conclusion: The enhanced visualization framework is important because evaluation of study validity needs to consider the triad of study question, design, and data together. Any given data source or study design may be appropriate for some questions but not others.
Keywords: study design, real world evidence, real world data, visualization, methods, bias
Introduction
There is growing interest in using evidence generated from routinely collected data contained in administrative claims, charge master, patient registry, and electronic healthcare record (EHR) databases to support regulatory, coverage and other healthcare decision-making.1–4 The methods used to conduct studies with these types of longitudinal data streams can be complex and long narratives make reviewing difficult and error-prone. A graphical framework for depicting longitudinal study designs to mitigate this barrier was introduced and has found wide acceptance.5,6 The goal was to make studies conducted with secondary healthcare data more reproducible and facilitate clear communication of longitudinal study design decisions to readers. Since publication, this graphical framework has been incorporated into STaRT-RWE,7 a structured study implementation template that was developed in a public-private collaboration that included members from international regulatory agencies and was endorsed by two international professional societies.
The original graphical framework introduced general terminology for temporal anchors required for causal study designs on treatment effectiveness, including base anchors, first-order (primary) and second-order (secondary) anchors defined in calendar or patient event time.5 Examples of design diagrams for different study designs were provided to illustrate the flexibility of the framework to address a variety of study questions using different methods. The original graphical framework did not contain information to help readers assess the appropriateness of the source data in which the study design was applied. For example, whether data were fully observable during the study period or whether there was (partially) unobservable information, as is expected for many EHR databases.8–11 This is an important issue because when conducting research with secondary data, the investigator is not in control of what, when or how data is captured. Thus, clear communication of data completeness and quality within the temporal context of a specific study is critically important to evaluate methodologic validity.
In this paper, we update the original graphical framework for depicting study design to include a simple visualization of data type and observability. This revision is important because evaluation of study validity needs to consider the triad of study question, design, and data together.12 Any given data source or study design may be appropriate for some questions but not others.
There are many aspects involved in evaluating whether a data source is fit-for-purpose, including the ability to measure key study parameters such as exposure, outcome, inclusion criteria, covariates and follow up.13,14 Other aspects include how selected versus representative the data are, the amount of missing data or unreliable data (eg implausible lab values), and the degree of transparency in data provenance or history of data transformations to create the research database.
Although many aspects of evaluating data fitness cannot be visually summarized in a graphical framework (eg quality control, data curation practices), some fundamental features can be. The objective of this update to the graphical framework for study design is to help researchers working with longitudinal secondary data think about data observability when designing a study. The framework can also be used in reporting, to help reviewers understand with a high-level, visual summary, whether and how key study parameters can be captured in the data source.
Methods
In this section, we define data observability and propose a framework for visualizing data observability in the context of study design.
Data Observability
Healthcare databases are largely comprised of longitudinal data streams that are generated by the routine operation of a healthcare system that tracks encounters including medical, billing, and other information.15 Administrative claims databases capture longitudinal data on patient encounters that are covered by insurances across providers and have a defined start and end of the data stream, the enrollment period. However, they lack the richness of clinical detail that can be found in EHR, which may be useful for enhanced confounding adjustment and identifying select endpoints. In contrast, EHR-based data sources have greater depth of clinical information, but particularly troublesome for researchers in countries with fragmented healthcare systems like the US, information is lost to researchers when patient seek care by physicians who operate outside of the index EHR system.16 Integrated healthcare systems or linked claims-EHR data sources benefit from both longitudinal capture of all healthcare encounters and the ability to leverage detailed clinical measurements such as vital signs, laboratory, imaging, and other test results as well as physician notes.16
Hence, as has been previously outlined,8,9 a key difference between claims and EHR data sources is the concept of patient data observability. We define observable time as time windows during which patient healthcare events are routinely captured and stored in the database accessible by the researcher. This is related to but not the same as a classical definition of missing data, which occurs when there a measurement was taken but no value recorded for a variable that is part of the routinely captured data.
In claims data, this characteristic of observable time can be measured through enrollment periods, the start and end dates of which are assiduously captured by insurers because this information is critical to their business function. When measuring baseline characteristics or determining follow up, these enrollment windows can be used to ensure that the ascertainment windows in the study design are restricted to time during which patient healthcare data is observable. That said, for some claims-based data sources, there may be windows of only partially observable data for structural reasons. For example, medication administration data for patients during time spent in hospital or other institutions is often not available for claims-based research databases as they are included in bundled payments.
In EHR or specialty registry data, the issue of data observability can be more complicated. These types of data often do not have clear windows defining when a patient is actively engaged with a provider within the system. Furthermore, it can be difficult to ascertain how much of the patient’s healthcare activity is captured within the network as opposed to other systems. Linkage to claims or other data sources that track all encounters across the care delivery continuum can help elucidate the degree to which patients are seeking healthcare in other systems. Alternatively, researchers can make assumptions about when patient healthcare events are observable or use algorithms to identify and restrict study populations to patients who continuously use a single healthcare system.8–10 For some EHR-based research databases, periods of structurally unobservable patient time may be clear. For example, some databases contain only inpatient hospitalization data, meaning anything outside of hospital is unobservable.17 Others may focus on primary care only or specialty clinics only. Any of these types of EHR data sources may be fit-for-purpose, depending on the study question and design.
Visual Vocabulary for Data Observability and Type
The original design visualization framework was logically centered around a primary anchor that denoted time zero for entry to the study population, and secondary time anchors defined relative to the primary anchor.5 The primary anchor was visually represented by a vertical gray arrow with horizontal boxes representing secondary time anchors such as inclusion-exclusion assessment windows, covariate assessment windows, washout windows for defining incident exposure or outcome, an exposure assessment window, and follow up. The length and placement of the horizontal boxes were used to visually represent the timing of the secondary temporal anchors relative to time zero, with bracketed numbers explicitly denoting the exact timing.5
To bring in the concept of data observability to the design visualization framework, we propose overlaying a continuous or dotted line on each horizontal box using a simple 2 color palette to denote windows of observable patient data (continuous and dark color), partial observability (dashed and dark color), and no observability (continuous and light color). These three categories can only provide crude directions about data observability and may need additional explanations in foot notes. Underneath the design diagram, we therefore use the same palette to break down the observability of common data types as well as data that may be idiosyncratic for the research database.
To illustrate this addition to the design diagram framework, we walk through 2 examples of comparative effectiveness studies using secondary data sources.
Results
Example 1: Comparative Effectiveness of Famotidine versus Non-Use on Risk of Death for Hospitalized COVID-19 Patients
In this hypothetical design of a study of the risk of death for patients initiating famotidine versus non-use on the day of admission to a hospital for COVID (based on a real study18) Day 0 was defined as a hospital admission date. The exposure assessment window for famotidine exposure versus non-exposure was the date of admission. Patients were included if they had lab confirmed COVID-19 from 2 weeks prior up through 3 days after hospital admission. Patients were excluded if there was evidence of exposure to famotidine within 90 days prior to day 0, or if there was evidence of intensive service use within 90 days prior to and including day 0. Baseline covariates to adjust for confounding were assessed over the 90 days prior to and including day 0. Follow up for the outcome of death began the day after admission and continued for up to 30 days, with censoring upon outcome, discharge, or end of study period.
The original design visualization framework does not provide information about data observability. A generic design diagram might appear as panel A in Figure 1. If we were to layer in information about data observability, we would see different issues highlighted for different types of data sources.
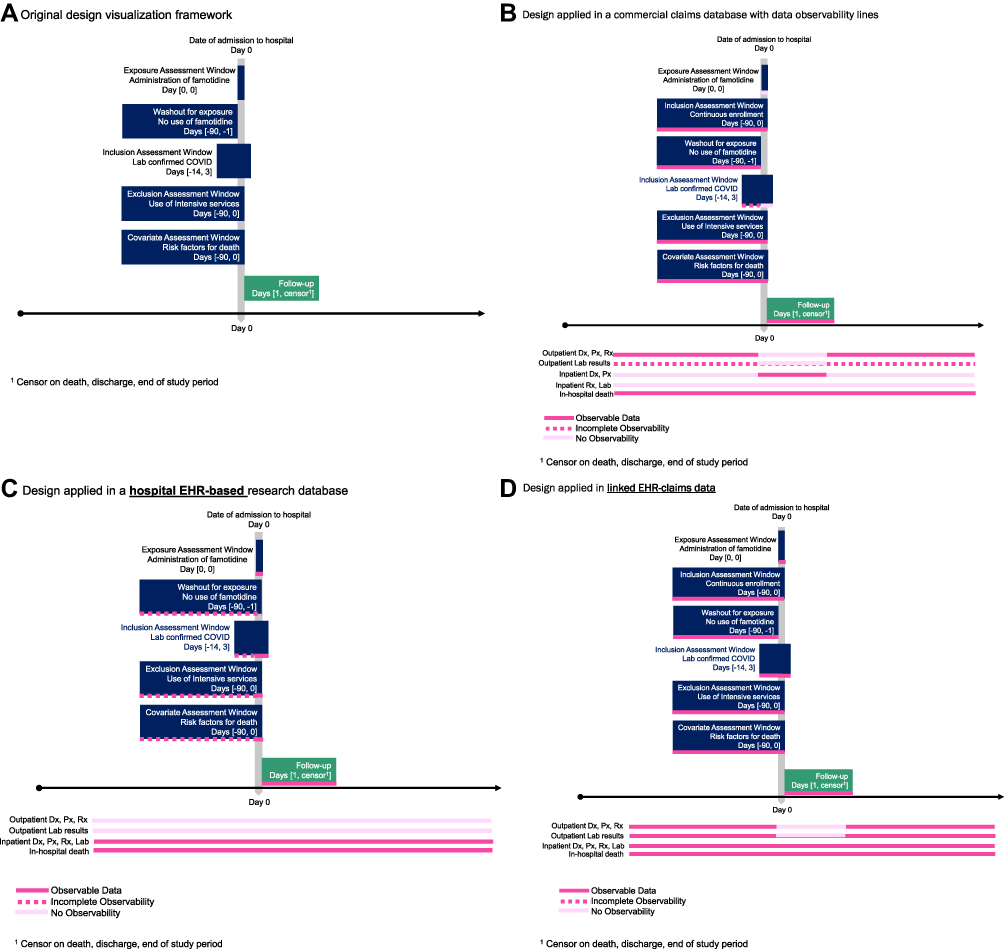 |
Figure 1 Comparative effectiveness of famotidine versus non-use on risk of death for hospitalized COVID-19 patients. (A) Original design visualization framework, (B) design applied in a commercial claims database with data observability lines, (C) Design applied in a hospital EHR-based research database, (D) design applied in linked EHR-claims data. |
If this hypothetical study was conducted with a United States commercial claims database, the design would typically also include an inclusion requirement of having a minimum amount of enrollment prior to day 0. This would serve to ensure a window of observability for measured baseline characteristics. Similarly, follow up would be censored when the enrollment window ends (Figure 1B). The lines indicating data observability given this data source and this design would indicate that patient healthcare events are observable for all assessment windows except for in-hospital medication administration and lab test results. The latter are partially observable in the outpatient setting and unobservable in the inpatient setting. The critical piece of unobservable information on inpatient exposure status makes this combination of data and design not fit-for-purpose. The clarity of the visualization brings this particular study limitation to the forefront for a reviewer.
If the design were to be implemented in a hospital EHR based research database, then there would be a clear window of time during which patient events were observable - during the hospitalization. However, depending on the data source, while prior hospitalizations in the same system may be observable for each patient, capture of patient events from outpatient healthcare contacts or from other hospital systems may not be linkable to the index hospitalization that allowed patients to enter the analytic study cohort. This is reflected by the data observability lines in Figure 1C where patient information before the index hospitalization is only observable if the index hospitalization reflects a rehospitalization within the same system. The inability to observe outpatient drug exposure prior to hospitalization makes it difficult to exclude patients who had prior exposure to the drugs of interest. Similarly, data on intensive service use or baseline characteristics is only partially observable prior to the index admission (observable only through prior hospitalization records). Without the data observability lines overlaid on the design diagram, use of extended baseline assessment windows prior to the index may give the false impression that health events prior to the index admission are measurable and contributing to the definition of incident use or other inclusion-exclusion criteria. To tailor the design to the data, assessment windows could be modified to focus measurement on admitting diagnoses or procedures occurring on the date of admission, thus recognizing limited observability outside of the index hospitalization. Decision rules may be needed to define whether conditions were likely present on admission as opposed to new conditions that developed during hospitalization and ended up on the discharge record. For example, inpatient hypertension diagnoses likely reflect pre-existing conditions whereas inpatient myocardial infarction codes might be considered either pre-existing or indicative of a new event if they were an admission diagnosis or the primary discharge diagnosis.
If the design were to be implemented using a linked claims-EHR database, then the study could benefit from use of clear enrollment windows to capture observable time in the study design inclusion criteria, with data observability lines reflecting that patient health events before hospital admission are measurable, as is drug exposure status upon hospitalization (Figure 1D). Depending on the linked data sources, EHR based patient data may be fully, partially or not observable outside of the index hospitalization (eg fully integrated healthcare system, hospital-based system with some outpatient clinics, hospital only EHR).
Example 2: Comparative Effectiveness of Chemotherapy Regimens in Specialty Oncology Registry Data
In the design of a study based on a previously developed master protocol19,20 of the risk of death for patients initiating programmed death-ligand 1 inhibitor (PD-(L)1) monotherapy (pembrolizumab, nivolumab, atezolizumab) compared to patients initiating a PD-(L)1 plus a doublet chemotherapy combination, day 0 was defined as the first observed treatment episode with either course of treatment (Figure 2A). To identify patients whose healthcare events would likely be observable, patients were required to have at least 2 visits to the same community clinic at any time prior to day 0. Patients were restricted to those who had either a recurrence or progression to advanced non-small cell lung cancer (aNSCLC) within 120 days prior to initiating either course of therapy under investigation. Patients were included if the community clinic at which they were treated collected and provided records of historical treatment to the research database.
 |
Figure 2 Comparative effectiveness of chemotherapy regimens in specialty oncology registry data. (A) Original design visualization framework, (B) design applied in community cancer clinic based EHR database with no external linkage of death data, (C) design applied in community cancer clinic based EHR database with external linkage of death data. |
Baseline covariates were assessed over several different windows. Demographics were assessed on day 0 or using the most recent value observed considering all available data. Lab testing and results were assessed using all available time prior to day 0, using only time within 30 days before day 0, or including time within 30 days after day 0. Non-cancer related comorbid conditions were assessed using all available data prior to and including day 0. Follow up for the outcome of death began the day after treatment initiation and continued until the end of the study period.
If this study design were applied to a data source comprised primarily of community-based oncology clinics, then after applying restrictions in the design phase to include patients who are likely to be receiving all of their cancer care in a clinic that contributes to the research database, the observability lines might indicate that cancer related baseline measures are largely observable while non-cancer related baseline characteristics are only partially observable (through non-cancer related clinical codes or notes captured in the cancer clinic EHR – all external healthcare transactions would be unobservable). If this data source did not have linkage to external sources of information about mortality, then observability lines during follow up for overall survival might indicate that patient events are only partially observable (Figure 2B). The observability lines during follow up might look different if the study was either investigating a different outcome or if the study were investigating overall survival in a similar data source with linkage to additional data. For example, under the assumption that the restriction to patients who have a history of receiving their cancer care from the same community clinic is effective at identifying patients with observable data, then if the outcome was treatment discontinuation instead of survival, the research database would include the necessary information and follow up window for this outcome would be considered observable. Alternatively, if the research database included not just EHR data from community-based oncology clinics, but also death information from the social security death index, linked claims, state death information, etc., then the window of follow up for overall survival could be classified as largely observable (Figure 2C).
Discussion
Working with secondary data requires clear communication of data completeness and quality in the temporal context of a specific study because the investigator is not in control of what to measure, how, or when to measure it. Using visualizations to help researchers be precise about when and how exposure, baseline characteristics, inclusion-exclusion criteria, and outcomes are captured in data and design can help readers better interpret the results of a study. In this paper we introduce terminology and a visual language for data observability that are particularly relevant for electronic health record and disease registry databases based on routinely collected healthcare data. We provide updated power point templates with a color palette (that is friendly for the color-impaired) which can be used to create publication quality figures. The enhancement to the visualization framework can only draw attention to an observability issue in the data; the accompanying text is needed to explain details of the observability issue and how it may impact the validity of the study.
Limitations
A limitation of the proposed enhancement to the design visualization framework is that it does not capture all aspects of assessing whether a data source is reliable, relevant, and fit-for-purpose. Additionally, studies with very complex designs may result in complex diagrams.7,21 Nevertheless, supplementing free text description of the methods for such studies with a summary visualization may still be a useful aid for planning a study as well as interpreting and evaluating the methods.
Conclusions
Study design diagrams can be used as a tool for planning a study, reporting on it, and facilitating validity assessment. For investigators, use of this framework for graphical representation of study design and data observability during the study planning phase will help them to consider and account for important data features or limitations in their study design. Sharing this diagram with a publication or report will help communicate these considerations to reviewers. For reviewers, the presence of a study design and data observability diagram will facilitate effective evaluation of study validity as well as relevance for decision-making.
Acknowledgments
We would like to recognize Judy Maro, Michael Nguyen, Joshua K Lin, and Jeremy Rassen for early discussions on this revision to the graphical framework for study design.
Disclosure
Authors were supported by funding from the NIH: NHLBI RO1HL141505 and NIA R01AG053302. The content is solely the responsibility of the authors and does not necessarily represent the official views of the National Institutes of Health. Dr. Wang has no conflicts of interest to report. Dr. Schneeweiss is principal investigator of the FDA Sentinel Innovation Center funded by the FDA, co-principal investigator of an investigator-initiated grant to the Brigham and Women’s Hospital from UCB and Boehringer Ingelheim unrelated to the topic of this study. He is a consultant to Aetion Inc., a software manufacturer of which he owns equity. His interests were declared, reviewed, and approved by the Brigham and Women’s Hospital and Partners HealthCare System in accordance with their institutional compliance policies.
References
1. Eichler HG, Baird LG, Barker R, et al. From adaptive licensing to adaptive pathways: delivering a flexible life-span approach to bring new drugs to patients. Clin Pharmacol Ther. 2015;97(3):234–246. doi:10.1002/cpt.59
2. Ball R, Robb M, Anderson SA, Dal Pan G. The FDA’s sentinel initiative—a comprehensive approach to medical product surveillance. Clin Pharmacol Ther. 2015;99(3):265–268. doi:10.1002/cpt.320
3. Sun X, Tan J, Tang L, Guo JJ, Li X. Real world evidence: experience and lessons from China. BMJ. 2018;360:j5262. doi:10.1136/bmj.j5262
4. Makady A, Ham RT, de Boer A, et al. Policies for use of real-world data in Health Technology Assessment (HTA): a comparative study of six HTA agencies. Value Health. 2017;20(4):520–532. doi:10.1016/j.jval.2016.12.003
5. Schneeweiss S, Rassen JA, Brown JS, et al. Graphical depiction of longitudinal study designs in health care databases. Ann Intern Med. 2019;170(6):398–406. doi:10.7326/m18-3079
6. Happe LE, Brown JD, Gatwood J, Schneeweiss S, Wang S. Application of a graphical depiction of longitudinal study designs to managed care pharmacy research. J Manag Care Spec Pharm. 2020;26(3):268–274. doi:10.18553/jmcp.2020.26.3.268
7. Wang SV, Pinheiro S, Hua W, et al. STaRT-RWE: structured template for planning and reporting on the implementation of real world evidence studies. BMJ. 2021;372:m4856. doi:10.1136/bmj.m4856
8. Rassen JA, Bartels DB, Schneeweiss S, Patrick AR, Murk W. Measuring prevalence and incidence of chronic conditions in claims and electronic health record databases. Clin Epidemiol. 2019;11:1–15. doi:10.2147/CLEP.S181242
9. Lin KJ, Glynn RJ, Singer DE, Murphy SN, Lii J, Schneeweiss S. Out-of-system care and recording of patient characteristics critical for comparative effectiveness research. Epidemiology. 2018;29(3):356–363. doi:10.1097/EDE.0000000000000794
10. Lin KJ, Rosenthal GE, Murphy SN, et al. External validation of an algorithm to identify patients with high data-completeness in electronic health records for comparative effectiveness research. Clin Epidemiol. 2020;12:133–141. doi:10.2147/CLEP.S232540
11. Lin KJ, Singer DE, Glynn RJ, Murphy SN, Lii J, Schneeweiss S. Identifying patients with high data completeness to improve validity of comparative effectiveness research in electronic health records data. Clin Pharmacol Ther. 2018;103(5):899–905. doi:10.1002/cpt.861
12. Wang SV, Schneeweiss S. Assessing and interpreting real-world evidence studies: introductory points for new reviewers. Clin Pharmacol Ther. 2022;111(1):145–149. doi:10.1002/cpt.2398
13. Daniel G, Silcox C, Bryan J, et al. Characterizing RWD quality and relevancy for regulatory purposes; 2018. Available from: https://healthpolicy.duke.edu/sites/default/files/2020-03/characterizing_rwd.pdf.
14. U.S. Food & Drug Administration. Framework for FDA’s real world evidence program; 2018. Available from: https://www.fda.gov/downloads/ScienceResearch/SpecialTopics/RealWorldEvidence/UCM627769.pdf.
15. Schneeweiss S, Patorno E. Conducting real-world evidence studies on the clinical outcomes of diabetes treatments. Endocr Rev. 2021;42(5):658–690. doi:10.1210/endrev/bnab007
16. Lin KJ, Schneeweiss S. Considerations for the analysis of longitudinal electronic health records linked to claims data to study the effectiveness and safety of drugs. Clin Pharmacol Ther. 2016;100(2):147–159. doi:10.1002/cpt.359
17. Makadia R, Ryan PB. Transforming the premier perspective hospital database into the Observational Medical Outcomes Partnership (OMOP) common data model. Egems. 2014;2(1):1110. doi:10.13063/2327-9214.1110
18. Shoaibi A, Fortin SP, Weinstein R, Berlin JA, Ryan P. Comparative effectiveness of famotidine in hospitalized COVID-19 patients. Am J Gastroenterol. 2021;116(4):692–699. doi:10.14309/ajg.0000000000001153
19. Friends of Cancer Research. FOCR rwEndpoints use case: assessing frontline treatment regimens in real-world patients with Advanced Non-Small Cell Lung Cancer (aNSCLC); 2021. Available from: https://www.focr.org/sites/default/files/Treatment-Comparisons_SAP.pdf.
20. Stewart M, Norden AD, Dreyer N, et al. An exploratory analysis of real-world end points for assessing outcomes among immunotherapy-treated patients with advanced non–small-cell lung cancer. JCO Clin Cancer Inform. 2019;(3):1–15. doi:10.1200/cci.18.00155
21. Franklin JM, Pawar AS. Replication of the EMPAREG diabetes trial in healthcare claims. US National Library of Medicine, Available from: https://clinicaltrials.gov/ct2/show/NCT04215536?id=NCT04215536&draw=2&rank=1&load=cart.
 © 2022 The Author(s). This work is published and licensed by Dove Medical Press Limited. The
full terms of this license are available at https://www.dovepress.com/terms
and incorporate the Creative Commons Attribution
- Non Commercial (unported, 3.0) License.
By accessing the work you hereby accept the Terms. Non-commercial uses of the work are permitted
without any further permission from Dove Medical Press Limited, provided the work is properly
attributed. For permission for commercial use of this work, please see paragraphs 4.2 and 5 of our Terms.
© 2022 The Author(s). This work is published and licensed by Dove Medical Press Limited. The
full terms of this license are available at https://www.dovepress.com/terms
and incorporate the Creative Commons Attribution
- Non Commercial (unported, 3.0) License.
By accessing the work you hereby accept the Terms. Non-commercial uses of the work are permitted
without any further permission from Dove Medical Press Limited, provided the work is properly
attributed. For permission for commercial use of this work, please see paragraphs 4.2 and 5 of our Terms.