Back to Journals » Clinical Epidemiology » Volume 9
Sociodemographic characteristics of nonparticipants in the Danish colorectal cancer screening program: a nationwide cross-sectional study
Authors Larsen MB ![]() , Mikkelsen EM, Rasmussen M
, Mikkelsen EM, Rasmussen M ![]() , Friis-Hansen L, Ovesen AU, Rahr HB
, Friis-Hansen L, Ovesen AU, Rahr HB ![]() , Andersen B
, Andersen B ![]()
Received 7 April 2017
Accepted for publication 22 May 2017
Published 27 June 2017 Volume 2017:9 Pages 345—354
DOI https://doi.org/10.2147/CLEP.S139168
Checked for plagiarism Yes
Review by Single anonymous peer review
Peer reviewer comments 3
Editor who approved publication: Professor H Sorensen
Mette Bach Larsen,1 Ellen M Mikkelsen,2 Morten Rasmussen,3 Lennart Friis-Hansen,4 Anders U Ovesen,5 Hans Bjarke Rahr,6 Berit Andersen1
1Department of Public Health Programmes, Randers Regional Hospital, Central Denmark Region, Randers NO, 2Department of Clinical Epidemiology, Aarhus University Hospital, Central Denmark Region, Aarhus N, 3Digestive Disease Center K, Bispebjerg Hospital, The Capital Region of Denmark, Copenhagen NV, 4Department of Clinical Biochemistry, Nordsjællands Hospital, The Capital Region of Denmark, Hillerød, 5Department of Surgical Gastroenterology, Aalborg University Hospital, North Denmark Region, Aalborg, 6Department of Surgery, Vejle Hospital, Region of Southern Denmark, Vejle, Denmark
Introduction: Fecal occult blood tests are recommended for colorectal cancer (CRC) screening in Europe. Recently, the fecal immunochemical test (FIT) has come into use. Sociodemographic differences between participants and nonparticipants may be less pronounced when using FIT as there are no preceding dietary restrictions and only one specimen is required. The aim of this study was to examine the associations between sociodemographic characteristics and nonparticipation for both genders, with special emphasis on those who actively unsubscribe from the program.
Methods: The study was a national, register-based, cross-sectional study among men and women randomized to be invited to participate in the prevalence round of the Danish CRC screening program between March 1 and December 31, 2014. Prevalence ratios (PRs) were used to quantify the association between sociodemographic characteristics and nonparticipation (including active nonparticipation). PRs were assessed using Poisson regression with robust error variance.
Results: The likelihood of being a nonparticipant was highest in the younger part of the population; however, for women, the association across age groups was U-shaped. Female immigrants were more likely to be nonparticipants. Living alone, being on social welfare, and having lower income were factors that were associated with nonparticipation among both men and women. For both men and women, there was a U-shaped association between education and nonparticipation. For both men and women, the likelihood of active nonparticipation rose with age; it was lowest among non-western immigrants and highest among social welfare recipients.
Conclusion: Social inequality in screening uptake was evident among both men and women in the Danish CRC screening program, even though the program is free of charge and the screening kit is based on FIT and mailed directly to the individuals. Interventions are needed to bridge this gap if CRC screening is to avoid aggravating existing inequalities in CRC-related morbidity and mortality.
Keywords: colorectal neoplasms, mass screening, early detection of cancer, socioeconomic factors, demography
Introduction
Colorectal cancer (CRC) is the second most common cancer in Europe with ~447,000 new cases and 215,000 deaths per year. Among the Northern European countries, Denmark has the highest age-standardized incidence rate of CRC for men (69.2 per 100,000) and the second-highest for women (53.4 per 100,000).1 Most cases of CRC arise from adenomas. Progression from this precursor lesion to CRC is a multistep process with a natural history of at least 10 years.2,3 Survival is strongly associated with stage at time of diagnosis. Hence, 5-year stage-specific survival rates range from above 90% for patients diagnosed at an early stage to <10% for patients diagnosed with distant organ metastasis.4 Symptoms of CRC are diffuse with low positive predictive values, often presenting at advanced stages of the disease.5 Early detection by screening can, therefore, help reduce morbidity and mortality caused by CRC as it makes it possible to remove adenomas or detect cancers at an early stage.6–9
European guidelines for quality assurance in CRC screening and diagnosis10 recommend the noninvasive fecal occult blood test (FOBT), of which the guaiac FOBT (gFOBT) is the oldest and most thoroughly studied.11–13 More recently, the fecal immunochemical test (FIT) has come into widespread use as studies have found it to be superior to gFOBT with respect to detection rate, positive predictive value, participation rate, and cost-effectiveness.14–19 Earlier studies of nonparticipation in CRC screening were based on gFOBT or primary colonoscopy, and sociodemographic data were self-reported. These studies found that younger age, male gender, living alone, low educational attainment, low income, and belonging to an ethnic minority were associated with a higher likelihood of nonparticipation in CRC screening programs.20–25 As these sociodemographic factors have also been associated with poorer CRC prognosis,26–29 it could be argued that CRC screening widens health inequalities. However, sociodemographic differences between participants and nonparticipants may be less pronounced in programs using FIT as there are no preceding dietary restrictions and only one fecal sample is required from each participant. In previous studies,20–25 nonparticipants were described as a homogeneous group, although individuals who actively decide not to participate and unsubscribe from the program may differ from those who simply do not participate. Therefore, the effect of interventions may be different than expected if expectations are based on studies considering nonparticipants as a homogeneous group.
In the present nationwide cross-sectional study, we used register data to examine the associations between sociodemographic characteristics and nonparticipation in the FIT-based Danish CRC screening program. With regard to nonparticipation, our specific aim was to evaluate if there were gender differences in the associations and to investigate whether associations between sociodemographic charactaristics and overall nonparticipation differed from associations between sociodemographic characteristics and active nonparticipation.
Methods
Setting
In Denmark, health care is organized in five administrative regions, and cancer screening is offered free of charge to all citizens. The Danish CRC screening program was introduced nationally in March 2014. It includes all individuals aged 50–74 years. Invitations are posted to the individuals along with the screening kit and a preaddressed, prepaid return envelope. If the screening kit is not returned within 45 days, a reminder is sent. All individuals in the age group are invited. However, in the invitation letter, it is specified that those who are already participating in a surveillance program after having received a CRC or adenoma diagnosis should not participate in the screening program, and those with ulcerative colitis or Crohn’s disease should discuss with their physician whether participation would be relevant for them.
The national program is phased in over a 4-year period (prevalence round), during which all individuals in the target population are invited once before the end of 2017. After this, the target population will receive biennial invitations. During the prevalence round, individuals aged between 50 and 75 years on January 1, 2014, are invited randomly according to month of birth, and individuals turning 50 and 75 years are invited just before their birthday, if they have not been invited earlier.
Design
The study was designed as a nationwide cross-sectional study of men and women randomized to be invited to participate in CRC screening between March 1 and December 31, 2014 (born between January 1, 1940, and December 31, 1963). Individuals turning 50 and 75 years of age during the period were excluded because they were not randomly invited to participate in screening and thus would be overrepresented in the study population. Individuals registered with a diagnosis of CRC prior to January 1, 2014, were excluded as the invitation letter recommended that they refrain from participation in the screening program (Figure 1).
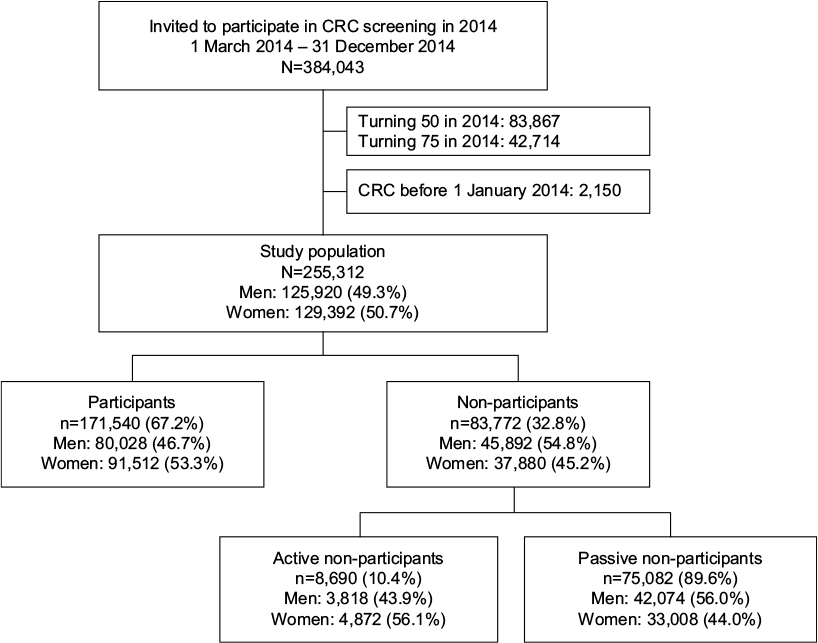 | Figure 1 Flow chart of individuals invited to participate in colorectal cancer screening in 2014. Abbreviation: CRC, colorectal cancer. |
Data
The study population was identified using the Danish CRC Screening Database, which monitors the quality of the screening program in relation to different parameters including participation.30 Data on nonparticipation and active nonparticipation were also collected from the Danish CRC Screening Database. Individuals were categorized as participants if they had returned an FIT kit within 3 months after receiving the reminder. Nonparticipants were categorized as active nonparticipants if they had actively unsubscribed from the program either via telephone or a web-based self-service.
Data on CRC cancer diagnoses prior to March 1, 2014, were collected from the Danish National Patient Registry (NPR).31,32 In the NPR, CRC diagnoses were classified according to the International Classification of Diseases (ICD) version 8 (codes: 153 and 154) until the end of 1993, and the ICD10 thereafter (codes: DC18 and DC20).
Data on sociodemographic variables were obtained from Statistics Denmark.33 Using Statistics Denmark’s classification, ethnic status was categorized either as Danish, immigrant from western countries (EU, Andorra, Australia, Canada, Iceland, Liechtenstein, Monaco, New Zealand, Norway, San Marino, Switzerland, and the USA), or immigrant from non-western countries (others). Marital status was classified as married/living in a registered partnership, cohabitating, or living alone. Occupation was classified as self-employed and chief executive, employed, social welfare recipient (including unemployment benefits, social security, and sick leave), retired or other. Educational level was classified according to the classification of United Nations Educational, Scientific and Cultural Organization as low (≤10 years), middle (11–15 years), or higher education (>15 years).34 To assess disposable household income, we used the Organisation for Economic Co-operation and Development (OECD)-modified equivalence scale.35 Based on tertiles and rounded off to the nearest 100 Euros, household income was categorized as low (<27,000 Euros), middle (≤27,000–41,000 Euros), and high (≥41,000 Euros). We linked data using the individuals’ unique civil registration number.36
Analyses
Differences in sample characteristics between participants and nonparticipants were tested using Pearson’s chi-square test. Prevalence ratios (PRs) with 95% confidence interval (CI) were used to quantify associations between sociodemographic characteristics and nonparticipation (including active nonparticipation). PRs were assessed using Poisson regression with robust error variance.37,38 Unadjusted analyses were performed for each independent variable along with a multivariate model adjusting for age, ethnicity, marital status, education, occupation, household income, and region of residence. All analyses were stratified according to gender.
Statistical analyses were conducted using STATA version 14 (STATA Corp., College Station, TX, USA).
Approval
According to Danish legislation and the Central Denmark Region Committees on Biomedical Research Ethics, the study did not require ethical approval because it was based on register data. The same institutions waived patient consent for use of register data. In accordance with Danish law, the study was approved by the Danish Data Protection Agency (J.No.: 2012-58-0006/1-16-02-590-15).
Results
Characteristics of participants and overall nonparticipants
A total of 384,043 individuals were invited to participate in the Danish CRC screening program in 2014. Of these, 255,312 were eligible for study inclusion (49.3% men and 50.7% women). The overall participation rate was 67.2% (46.7% men and 53.3% women) (Figure 1). Table 1 shows the distribution of sociodemographic characteristics for participants and overall nonparticipants. Differences between participants and nonparticipants for all sociodemographic characteristics were statistically significant. In all sociodemographic subgroups, women participated more often than men; and for both men and women, nonparticipation was highest among non-western immigrants, individuals living alone, social welfare recipients, and those with a low income (Figure 2).
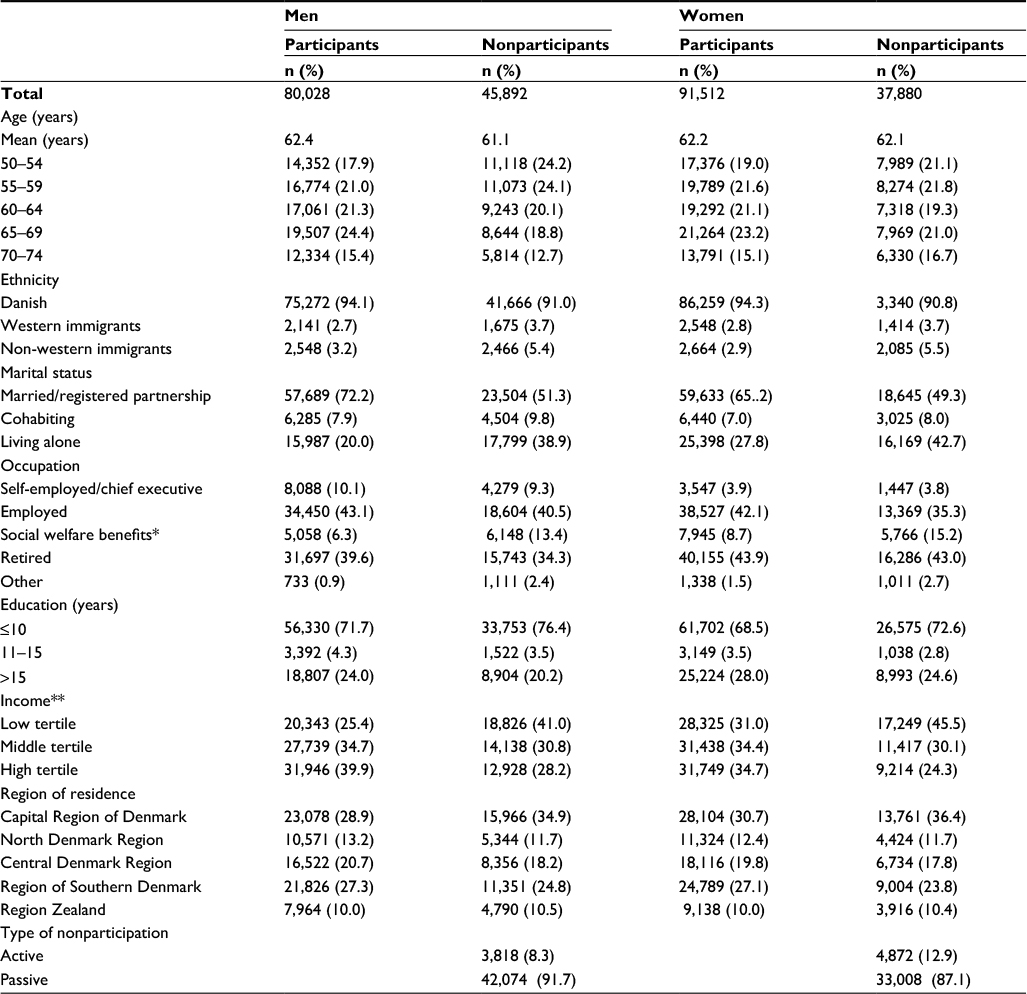 | Table 1 Characteristics of men and women participants and overall nonparticipants Notes: *Including social security, unemployment benefit, and sick leave. **Organisation for Economic Co-operation and Development–adjusted household income. All differences between participants and nonparticipants were statistically significant (p<0.001). |
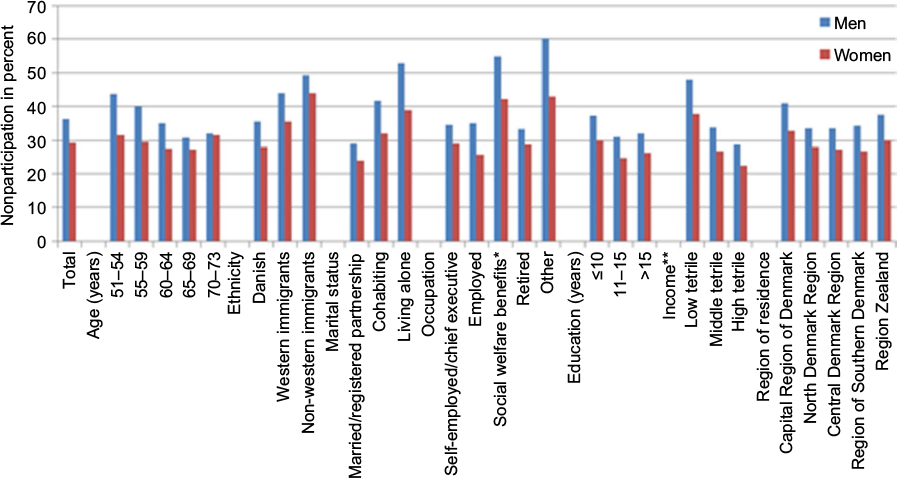 | Figure 2 Overall nonparticipation in percent by sociodemographic groups for men and women, respectively. Notes: *Including social security, unemployment benefit, and sick leave. **Organisation for Economic Co-operation and Development–adjusted household income. |
Associations between sociodemographic characteristics and overall nonparticipation
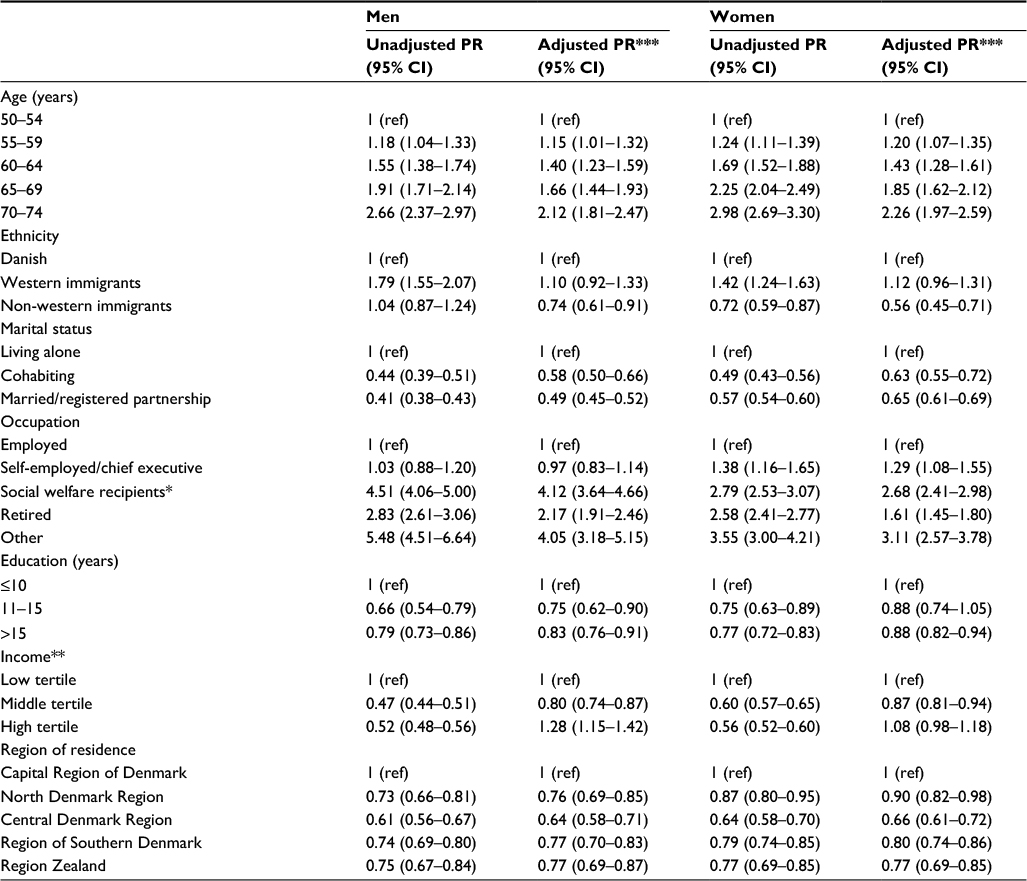
Table 2 presents adjusted and unadjusted associations between sociodemographic characteristics and nonparticipation. The likelihood of being a nonparticipant was highest in the younger part of the population. For women, the association across age groups was slightly U-shaped, and the adjusted PR for being a nonparticipant was 0.86 (95% CI: 0.84–0.89) in the age group 60–64 compared with the age group 50–54, while the adjusted PR increased to 0.97 (95% CI: 0.93–1.01) in the age group 70–74 years compared with the age group 50–54. The U-shaped curve was not observed among men. Immigrants had a higher probability of being nonparticipants than ethnic Danes, and this tendency was most pronounced for non-western female immigrants (adjusted PR: 1.16 [95% CI: 1.12–1.21]). Living alone compared with being married, being on social welfare compared with being employed, and having lower income were associated with nonparticipation for both men and women. There was a U-shaped association for both men and women between education and nonparticipation, with the lowest likelihood of nonparticipation evident among individuals with 11–15 years of education (adjusted PRmen: 0.87 [95% CI: 0.84–0.91] and adjusted PRwomen: 0.88 [95%CI: 0.84–0.93]). Furthermore, participation differed between the regions, with the likelihood of nonparticipation being highest in citizens in the Capital Region of Denmark followed by Region Zealand.
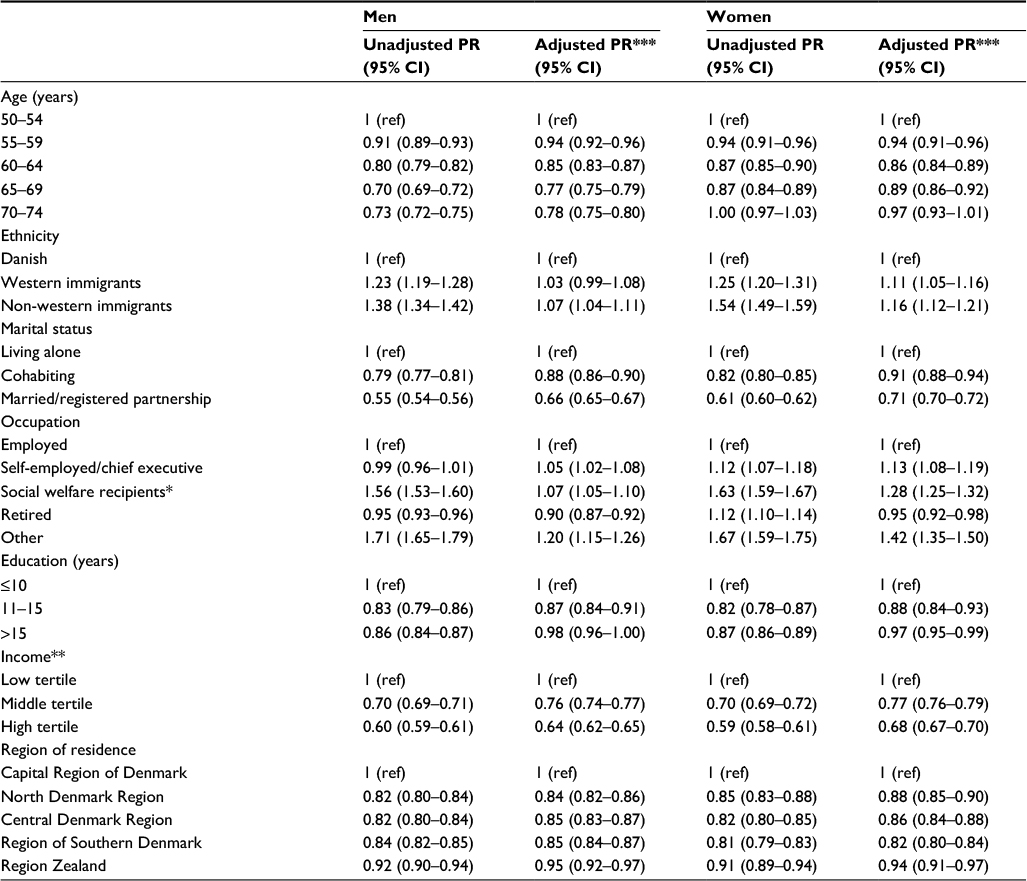 | Table 2 Unadjusted and adjusted prevalence ratios (PRs) with 95% confidence interval (CI) for associations between sociodemographic characteristics and overall nonparticipation compared with participation for men and women, respectively Notes: *Including social security, unemployment benefit, and sick leave. **Organisation for Economic Co-operation and Development–adjusted household income. ***Adjusted for age, ethnicity, marital status, education, occupation, income, and region of residence. |
Association between sociodemographic characteristics and active nonparticipation
Table 3 presents adjusted and unadjusted associations between sociodemographic characteristics and active nonparticipation as opposed to participation. For both men and women, the likelihood of active nonparticipation compared with participation increased with age, peaking with an adjusted PR of 2.12 (95% CI: 1.81–2.47) for men aged 70–74 years compared with 50–54 years and an adjusted PR of 2.26 (95% CI: 1.97–2.59) for women aged 70–74 years compared with 50–54 years. The likelihood of active nonparticipation was lowest among non-western immigrants compared with ethnic Danes; for women, the adjusted PR was 0.56 (95% CI: 0.45–0.71), and for men the adjusted PR was 0.74 (95% CI: 0.61–0.91). The likelihood of active nonparticipation was higher among social welfare recipients than among those in employment (PRmen: 4.12 [95% CI: 3.64–4.66]; PRwomen: 2.68 [95% CI: 2.41–2.98]).
 | Table 3 Unadjusted and adjusted prevalence ratios (PRs) with 95% confidence interval (CI) for associations between sociodemographic characteristics and active nonparticipation compared with participation for men and women, respectively Notes: *Including social security, unemployment benefit, and sick leave. **Organisation for Economic Co-operation and Development–adjusted household income. ***Adjusted for age, ethnicity, marital status, education, occupation, income, and region of residence. |
Discussion
In this nationwide register-based study, we examined sociodemographic differences between participants and nonparticipants in a random sample of the Danish population invited in the prevalence round of the FIT-based CRC screening program. The overall patterns of the association between sociodemographic characteristics and nonparticipation were similar for men and women; compared with participants, nonparticipants were more likely to be younger, non-western immigrants, to live alone, have a low income, and to have 11–15 years of education. By contrast, compared with participants, active nonparticipants were more likely to be older, ethnic Danes, to be receiving social welfare, and to be retired.
A major strength of this study is the register-based approach, which minimizes the risk of both classification and information bias because data on sociodemographic characteristics and participation were collected independently and without the potential bias of self-reported data. The Danish CRC Screening Database was used to identify the study population and their participation (including active nonparticipation). This database is linked to the system administrating the CRC screening program, which, in turn, is linked to the Danish Civil Registration System where information on immigration/migration and death is updated on a daily basis. Thus, all invited individuals are included, which minimizes the risk of selection bias. Data on CRC diagnoses were retrieved from the NPR, which has been shown to have high validity.31 However, it is known that coding practices and, therefore, data quality in the NPR have improved over time, which means that some CRC patients might have been included who should have been excluded. As such, nonparticipation might be overestimated, but we have no reason to believe that this should be related to sociodemographic characteristics. Data from Statistics Denmark on sociodemographic characteristics have been classified as high-quality variables and are highly valid with very few missing values.39
This study was conducted within the prevalence round of the Danish CRC screening program, and the included sample, therefore, represents the entire target population as noone could have unsubscribed from the program before it started. Furthermore, the study population was invited to CRC screening randomly according to month of birth and is, therefore, representative of the total Danish population in the target group for CRC screening.
Lack of information on comorbidity is a limitation of our study. In some cases, that is, individuals with inflammatory bowel diseases who routinely undergo colonoscopies, comorbidity should lead to nonparticipation; however, in other cases, comorbidity may have constituted a barrier for participation even though screening would have been relevant. A Danish study found that chronic diseases and multimorbidity were associated with nonparticipation in breast cancer screening.40 Moreover, the association between receiving social welfare and nonparticipation may be particularly influenced by confounding by indication if comorbidity is associated with nonparticipation and is also the reason for becoming a social welfare recipient. Furthermore, it is a limitation that we have no available data on psycosocial factors, for example, degree of social network, which most likely is related both to sociodemographic factors and nonparticipation.
Even though using FIT instead of gFOBT may decrease the social inequalities associated with uneven screening uptake,41 the present study supports earlier findings from gFOBT-based programs regarding lower screening participation among the least affluent citizens.20–25 In our study, similar associations were found for both men and women, even though women participated more often than men. The U-shaped association between educational attainment and nonparticipation contrasts with earlier findings where lower educational attainment, but not higher educational attainment, was associated with nonparticipation.20 However, a similar U-shaped association was observed among participants in the prevalence round of the Danish breast cancer screening program.42 It has been shown that informed choice is more difficult for individuals with low educational attainment.43 Moreover, discussions in the media, for example, about the harms and benefits of CRC screening may influence screening behavior in the two groups differently.
Our study showed that nonparticipants in CRC screening are a diverse group. Regarding ethnicity, we found an increased likelihood of overall nonparticipation and a decreased likelihood of active nonparticipation for non-western immigrants compared with ethnic Danes. There may be several reasons for this, but one explanation could be language barriers. If non-western immigrants have reasons not to participate in CRC screening, they may not have the language skills to unsubscribe, and if they wish to participate, there may be barriers related to understanding the invitation and the instructions. Interventions may be needed to ensure that minority groups obtain the same benefits from the national CRC screening program as the rest of the population.
We found the likelihood of overall nonparticipation to be highest among the youngest individuals in the study population, whereas the likelihood of active nonparticipation increased with age. This indicates that the youngest may just not get around to doing it as they are people of working age, and they may not consider the offer of CRC screening to be relevant because they do not feel at risk of getting CRC.44
Our study calls for interventions designed to reduce the sociodemographic gradient in screening uptake. A few studies have examined this issue and they demonstrate that enhanced reminder letters have some effect.45 Other suggested strategies include “nudging” where decision-making processes or subjective assessments of the risk of CRC are influenced, for example, by creating images of peers with CRC or showing people similar to the target population undergoing screening.44,46,47 Interventions targeting the younger age groups may be particularly effective because they have low participation rates and are likely to benefit the most from CRC screening because the risk of advanced CRC increases with age.
In conclusion, social inequality in screening uptake was evident among both men and women in the Danish CRC screening program even though the program is free of charge and the screening kit is based on FIT and mailed directly to individuals. Interventions are needed to bridge this gap if CRC screening is to avoid aggravating existing inequalities in CRC-related morbidity and mortality.
Disclosure
The authors report no conflicts of interest in this work.
References
Ferlay J, Steliarova-Foucher E, Lortet-Tieulent J, et al. Cancer incidence and mortality patterns in Europe: estimates for 40 countries in 2012. Eur J Cancer. 2013;49(6):1374–1403. | ||
Stryker SJ, Wolff BG, Culp CE, Libbe SD, Ilstrup DM, MacCarty RL. Natural history of untreated colonic polyps. Gastroenterology. 1987;93(5):1009–1013. | ||
Vogelstein B, Fearon ER, Hamilton SR, et al. Genetic alterations during colorectal-tumor development. N Engl J Med. 1988;319(9):525–532. | ||
O’Connell JB, Maggard MA, Ko CY. Colon cancer survival rates with the new American Joint Committee on Cancer sixth edition staging. J Natl Cancer Inst. 2004;96(19):1420–1425. | ||
Hamilton W. The CAPER studies: five case-control studies aimed at identifying and quantifying the risk of cancer in symptomatic primary care patients. Br J Cancer. 2009;101(Suppl 2):S80–S86. | ||
Brenner H, Stock C, Hoffmeister M. Effect of screening sigmoidoscopy and screening colonoscopy on colorectal cancer incidence and mortality: systematic review and meta-analysis of randomised controlled trials and observational studies. BMJ. 2014;348:g2467. | ||
Bretthauer M. Colorectal cancer screening. J Intern Med. 2011;270(2):87–98. | ||
Holme O, Bretthauer M, Fretheim A, Odgaard-Jensen J, Hoff G. Flexible sigmoidoscopy versus faecal occult blood testing for colorectal cancer screening in asymptomatic individuals. Cochrane Database Syst Rev. 2013;(9):CD009259. | ||
Towler BP, Irwig L, Glasziou P, Weller D, Kewenter J. Screening for colorectal cancer using the faecal occult blood test, hemoccult. Cochrane Database Syst Rev. 2000;(2):CD001216. | ||
Segnan N, Patnick J, von Karsa L, editors. European Guidelines for Quality Assurance in Colorectal Cancer Screening and diagnosis. 1st ed. Luxembourg: Publications Office of the European Union; 2010. | ||
Heresbach D, Manfredi S, D’halluin PN, Bretagne JF, Branger B. Review in depth and meta-analysis of controlled trials on colorectal cancer screening by faecal occult blood test. Eur J Gastroenterol Hepatol. 2006;18(4):427–433. | ||
Hewitson P, Glasziou P, Irwing L, Towler B, Watson E. Screening for colorectal cancer using the faecal occult blood test, hemoccult (Updated 2011). Cochrane Database Syst Rev. 2007;(1):CD001216. | ||
Kerr J, Day P, Broadstock M, Weir R, Bidwell S. Systematic review of the effectiveness of population screening for colorectal cancer. N Z Med J. 2007;120(1258):U2629. | ||
Tinmouth J, Lansdorp-Vogelaar I, Allison JE. Faecal immunochemical tests versus guaiac faecal occult blood tests: what clinicians and colorectal cancer screening programme organisers need to know. Gut. 2015;64(8):1327–1337. | ||
Brenner H, Tao S. Superior diagnostic performance of faecal immunochemical tests for haemoglobin in a head-to-head comparison with guaiac based faecal occult blood test among 2235 participants of screening colonoscopy. Eur J Cancer. 2013;49(14):3049–3054. | ||
Parra-Blanco A, Gimeno-Garcia AZ, Quintero E, et al. Diagnostic accuracy of immunochemical versus guaiac faecal occult blood tests for colorectal cancer screening. J Gastroenterol. 2010;45(7):703–712. | ||
Burch JA, Soares-Weiser K, St John DJ, et al. Diagnostic accuracy of faecal occult blood tests used in screening for colorectal cancer: a systematic review. J Med Screen. 2007;14(3):132–137. | ||
Vart G, Banzi R, Minozzi S. Comparing participation rates between immunochemical and guaiac faecal occult blood tests: a systematic review and meta-analysis. Prev Med. 2012;55(2):87–92. | ||
Goede SL, Rabeneck L, van Ballegooijen M, et al. Harms, benefits and costs of fecal immunochemical testing versus guaiac fecal occult blood testing for colorectal cancer screening. PLoS One. 2017;12(3): e0172864. | ||
Wools A, Dapper EA, Leeuw JR. Colorectal cancer screening participation: a systematic review. Eur J Public Health. 2016;26(1):158–168. | ||
von Wagner C, Baio G, Raine R, et al. Inequalities in participation in an organized national colorectal cancer screening programme: results from the first 2.6 million invitations in England. Int J Epidemiol. 2011;40(3):712–718. | ||
Frederiksen BL, Jorgensen T, Brasso K, Holten I, Osler M. Socioeconomic position and participation in colorectal cancer screening. Br J Cancer. 2010;103(10):1496–1501. | ||
Weber MF, Banks E, Ward R, Sitas F. Population characteristics related to colorectal cancer testing in New South Wales, Australia: results from the 45 and up study cohort. J Med Screen. 2008;15(3):137–142. | ||
Weller D, Coleman D, Robertson R, et al. The UK colorectal cancer screening pilot: results of the second round of screening in England. Br J Cancer. 2007;97(12):1601–1605. | ||
Wee CC, McCarthy EP, Phillips RS. Factors associated with colon cancer screening: the role of patient factors and physician counseling. Prev Med. 2005;41(1):23–29. | ||
Kogevinas M, Porta M. Socioeconomic differences in cancer survival: a review of the evidence. IARC Sci Publ. 1997;(138):177–206. | ||
Egeberg R, Halkjaer J, Rottmann N, Hansen L, Holten I. Social inequality and incidence of and survival from cancers of the colon and rectum in a population-based study in Denmark, 1994–2003. Eur J Cancer. 2008;44(14):1978–1988. | ||
Frederiksen BL, Osler M, Harling H, Danish Colorectal Cancer Group, Ladelund S, Jorgensen T. The impact of socioeconomic factors on 30-day mortality following elective colorectal cancer surgery: a nationwide study. Eur J Cancer. 2009;45(7):1248–1256. | ||
Frederiksen BL, Osler M, Harling H, Ladelund S, Jorgensen T. Do patient characteristics, disease, or treatment explain social inequality in survival from colorectal cancer? Soc Sci Med. 2009;69(7):1107–1115. | ||
Danish Colorectal Cancer Screening Database. Danish colorectal cancer screening database, annual report 2014. The first 10 months of the first screening round of the national screening programme. Available from: https://www.sundhed.dk/content/cms/45/61245_dts%C3%A5rsrapport-2014_8-1-16_final_inklbilag.pdf. Updated 2016. Accessed June 28, 2016. | ||
Schmidt M, Schmidt SA, Sandegaard JL, Ehrenstein V, Pedersen L, Sorensen HT. The Danish National Patient Registry: a review of content, data quality, and research potential. Clin Epidemiol. 2015;7:449–490. | ||
Lynge E, Sandegaard JL, Rebolj M. The Danish National Patient Register. Scand J Public Health. 2011;39(7 Suppl):30–33. | ||
Statistics Denmark. Available from:http://dst.dk/da/TilSalg/Forskningsservice. Accessed June 28, 2016. | ||
UNESCO. International Standard Classification of Education, ISCED 2011. Quebec, Canada: UNESCO Institute for Statistics; 2012. Available from: http://www.uis.unesco.org/Education/Documents/isced-2011-en.pdf. Accessed February 13, 2017. | ||
OECD Project on Income Distribution and Poverty. What are equivalence scales? Available from: http://www.oecd.org/els/soc/OECD-Note-EquivalenceScales.pdf. Accessed February 13, 2017. | ||
Pedersen CB. The Danish Civil registration System. Scand J Public Health. 2011;39(7 Suppl):22–25. | ||
Zou G. A modified Poisson regression approach to prospective studies with binary data. Am J Epidemiol. 2004;159(7):702–706. | ||
Barros AJ, Hirakata VN. Alternatives for logistic regression in cross-sectional studies: an empirical comparison of models that directly estimate the prevalence ratio. BMC Med Res Methodol. 2003;3:21. | ||
Statistics Denmark. High-quality variables. Available from:http://www.dst.dk/da/TilSalg/Forskningsservice/Dokumentation/hoejkvalitetsvariable. Accessed March 10, 2017. | ||
Jensen LF, Pedersen AF, Andersen B, Vestergaard M, Vedsted P. Non-participation in breast cancer screening for women with chronic diseases and multimorbidity: a population-based cohort study. BMC Cancer. 2015;15:798. | ||
Digby J, McDonald PJ, Strachan JA, Libby G, Steele RJ, Fraser CG. Use of a faecal immunochemical test narrows current gaps in uptake for sex, age and deprivation in a bowel cancer screening programme. J Med Screen. 2013;20(2):80–85. | ||
Jensen LF, Pedersen AF, Andersen B, Vedsted P. Identifying specific non-attending groups in breast cancer screening--population-based registry study of participation and socio-demography. BMC Cancer. 2012;12:518. | ||
Smith SK, Simpson JM, Trevena LJ, McCaffery KJ. Factors associated with informed decisions and participation in bowel cancer screening among adults with lower education and literacy. Med Decis Making. 2014;34(6):756–772. | ||
Ferrer R, Klein WM. Risk perceptions and health behavior. Curr Opin Psychol. 2015;5:85–89. | ||
Wardle J, von Wagner C, Kralj-Hans I, et al. Effects of evidence-based strategies to reduce the socioeconomic gradient of uptake in the English NHS bowel cancer screening programme (ASCEND): four cluster-randomised controlled trials. Lancet. 2016;387(10020):751–759. | ||
Purnell JQ, Thompson T, Kreuter MW, McBride TD. Behavioral economics: “Nudging” underserved populations to be screened for cancer. Prev Chronic Dis. 2015;12:E06. | ||
Power E, Miles A, von Wagner C, Robb K, Wardle J. Uptake of colorectal cancer screening: system, provider and individual factors and strategies to improve participation. Future Oncol. 2009;5(9):1371–1388. |
 © 2017 The Author(s). This work is published and licensed by Dove Medical Press Limited. The
full terms of this license are available at https://www.dovepress.com/terms
and incorporate the Creative Commons Attribution
- Non Commercial (unported, 3.0) License.
By accessing the work you hereby accept the Terms. Non-commercial uses of the work are permitted
without any further permission from Dove Medical Press Limited, provided the work is properly
attributed. For permission for commercial use of this work, please see paragraphs 4.2 and 5 of our Terms.
© 2017 The Author(s). This work is published and licensed by Dove Medical Press Limited. The
full terms of this license are available at https://www.dovepress.com/terms
and incorporate the Creative Commons Attribution
- Non Commercial (unported, 3.0) License.
By accessing the work you hereby accept the Terms. Non-commercial uses of the work are permitted
without any further permission from Dove Medical Press Limited, provided the work is properly
attributed. For permission for commercial use of this work, please see paragraphs 4.2 and 5 of our Terms.