Back to Journals » Patient Preference and Adherence » Volume 20
Development and Psychometric Evaluation of a Novel Medication Adherence Scale for Patients with Chronic Diseases in Low- and Middle-Income Countries
Authors Khoiry QA ![]() , Alfian SD
, Alfian SD ![]() , Van Boven JF
, Van Boven JF ![]() , Jatnika R, Abdulah R
, Jatnika R, Abdulah R
Received 12 February 2026
Accepted for publication 6 May 2026
Published 19 May 2026 Volume 2026:20 602433
DOI https://doi.org/10.2147/PPA.S602433
Checked for plagiarism Yes
Review by Single anonymous peer review
Peer reviewer comments 2
Editor who approved publication: Dr Johnny Chen
Qisty A Khoiry,1 Sofa D Alfian,1– 3 Job FM Van Boven,4,5 Ratna Jatnika,6,7 Rizky Abdulah1,2
1Department of Pharmacology and Clinical Pharmacy, Faculty of Pharmacy, Universitas Padjadjaran, Jatinangor, Indonesia; 2Center of Excellence for Pharmaceutical Care Innovation, Universitas Padjadjaran, Jatinangor, Indonesia; 3Center for Health Technology Assessment, Universitas Padjadjaran, Jatinangor, Indonesia; 4Department of Clinical Pharmacy and Pharmacology, Groningen Research Institute for Asthma and COPD (GRIAC), University Medical Centre Groningen, University of Groningen, Groningen, the Netherlands; 5Medication Adherence Expertise Centre of the Northern Netherlands (MAECON), Groningen, the Netherlands; 6Department of Psychology, Faculty of Psychology, Universitas Padjadjaran, Jatinangor, Indonesia; 7Center for Psychometrics Study, Universitas Padjadjaran, Jatinangor, Indonesia
Correspondence: Sofa D Alfian, Department of Pharmacology and Clinical Pharmacy, Faculty of Pharmacy, Universitas Padjadjaran, Jl. Raya Jatinangor, KM 21 Jatinangor, Sumedang, Indonesia, Tel/Fax +62-022-7796200, Email [email protected]
Introduction: Existing instruments for assessing medication nonadherence lack sufficient insights into the specific barriers to Low-Middle-Income-Countries (LMICs), thus limiting their utility in developing tailored intervention approaches. This cross-sectional scale development and validation study therefore aimed to develop and validate a patient-centered, self-reported scale to identify patients’ medication adherence and barriers relevant to LMICs contexts among people with chronic diseases.
Methods: This study had three-phases: (i) item development, (ii) content and face validity, and (iii) psychometric analysis. After item development, the items were refined through Item Content Validity Index (I-CVI) assessment and patient pre-testing. The third phase evaluated psychometric properties along with an assessment of agreement with objective clinical indicators (blood pressure and fasting blood glucose) and comparison with the validated scales Medication Adherence Report Scale-5 (MARS-5) and VAS Adherence using 419 patients. Statistical analyses included confirmatory factor analysis (CFA) to determine model fit. We also determined reliability and assessed test-retest reliability.
Results: A final set of 15 items were selected, which were grouped into 4 dimensions: patient, medication, healthcare system, and socioeconomic related-barriers. The CFA showed that the data was fit for the model (χ2= 179.477, P< 0.001, RMSEA=0.052, CFI=0.961, GFI=0.947). The reliability test showed a good internal consistency (Cronbach’s-α=0.727 and McDonalds- Ω=0.812) and test-retest reliability (correlation coefficient 0.802). The new scale exhibited strong negative correlations with MARS-5 (r=− 0.707) and VAS Adherence (r=− 0.725), and a moderate negative correlation with clinical measurements (r=− 0.632).
Conclusion: A psychometrically validated 15-item scale to assess medication adherence and its barriers in patients with chronic disease was developed, offering a reliable, contextually relevant tool that addresses information gaps and supports tailored interventions for improved patient outcomes in LMIC settings.
Keywords: adherence, barriers, scale development, psychometric, LMICs
Introduction
Globally, chronic noncommunicable diseases are a significant health problem, causing 74% of all deaths, with 77% of these fatalities occurring in low- and middle-income countries.1 For many chronic diseases, medication is part of the cornerstone treatment. However, poor medication adherence can significantly hinder treatment’s effectiveness.2 The World Health Organization emphasizes that improving adherence to prescribed treatments may have a more profound impact on overall population health than any new medical therapy.3
A systematic review and meta-analysis of studies on medication adherence in one of the most prevalent chronic conditions globally (ie. hypertension) revealed consistently low levels of medication adherence, ranging from 27% to 40%, regardless of the adherence measurement method employed.4 While underlying factors may differ, adherence to chronic medication is suboptimal in both high-income countries (HICs) and low- and middle-income countries (LMICs) such as Indonesia.5–7 Importantly, nonadherence can exacerbate patients’ health issues and increases the burden on healthcare systems.8–10 Effective patient education and the development of tailored interventions are crucial for improving medication adherence.11 By addressing the specific barriers and misconceptions that patients have about their treatment, healthcare providers can enhance patient adherence, ultimately leading to better health outcomes and more effective management of chronic diseases.12
Regular assessment of medication adherence is a fundamental component for effective medication management in patients with chronic conditions.13 Although there is a variety of adherence assessment methods available (blood concentrations, electronic monitoring, prescription records and self-report), there is no single gold standard method for measuring adherence, as each method has its own specific limitations and none is necessarily better than another.14 Nevertheless, self-reported scales are the most commonly used method, frequently preferred in clinical care for their efficiency, low cost, and ease of administration.15
The currently existing self-report scales typically focus on measuring a limited number of reasons for poor adherence, mostly related to behavior such as forgetfulness, and stopping medications when feeling better.16–21 Commonly used self-reported adherence instruments include the Morisky Medication Adherence Scale (MMAS-8),22 the Medication Adherence Report Scale (MARS-5),18 and the Adherence to Refills and Medications Scale (ARMS). While these scales have been validated and widely applied, they were predominantly developed in HICs settings. The MMAS-8 and MARS-5 principally measure behavioral dimensions of adherence, such as forgetting to take medication or stopping treatment when feeling better, without capturing structural, financial, or cultural barriers.18,22 The ARMS scale, while developed with resource-limited settings in mind, focuses primarily on medication refill and dosing behavior and does not comprehensively address socioeconomic, healthcare system-level, or cultural barriers to adherence.23 When applied to LMICs populations, these instruments may therefore underestimate the full scope of non-adherence by failing to identify LMICs-specific barriers such as financial constraints in obtaining medications, the concurrent use of traditional or herbal medicines, limited transportation access to healthcare facilities, religious or cultural beliefs influencing medication-taking practices, and the complexity of navigating resource-limited health systems. Their use in LMICs settings may thus fail to generate actionable, context-specific data needed for targeted intervention development. However, considering the multifaceted nature of medication nonadherence, self-reported scales should be capable of capturing all relevant barriers and contexts.19 Importantly, self-reported scales should also capture country and health care system relevant non-adherence barriers to be effective. Similar adherence measurement challenges and LMICs-specific barriers have been documented across diverse low-resource settings. Studies in sub-Saharan Africa have reported that financial burden, health system access limitations, and cultural beliefs about medicine are primary drivers of non-adherence among patients with chronic diseases.24–27 In South Asia, limited health literacy and reliance on informal healthcare providers have been identified as key contextual barriers.28,29 These cross-national patterns underscore the need for a self-reported adherence scale grounded in the realities of LMICs healthcare delivery, one that extends beyond behavioral dimensions to systematically capture the structural, socioeconomic, and cultural barriers that shape medication-taking behavior in these settings. However, most of the self-reported medication adherence instruments have been developed in HICs with a well-established health care system. Therefore, these instruments have several drawbacks when used in LMICs, such as lack of local applicability (eg. not considering alternative medicines use, infrastructure, religious beliefs or financial constraints) and the extra costs of obtaining a license.20,21
However, to date, there is no self-reported scale to assess medication adherence that is suitable for LMICs with rigorous development and strong psychometric properties.30 Hence, this study aims to develop and validate a patient-centered, self-reported scale to assess medication adherence and identify barriers among patients with chronic diseases, which will inform tailored interventions to improve adherence in LMICs.
Methods
Study Design
This adherence scale development study employed a three-phase methodology, adhering to Best Practices for Developing and Validating Scales for Health, Social, and Behavioural Research: A Primer Guidelines:31 (1) item development and generation, (2) content validity and face validity, and (3) psychometric analysis. The research was conducted and reported in accordance with the standards outlined in the Consensus-based Standards for the selection of health Measurement Instruments (COSMIN) guidelines for evaluating the methodological quality of studies on the measurement properties of health-related patient-reported outcome measures,32 (Appendix 1).
Phase 1: Item Development and Generation
The initial stage of developing the novel adherence scale involved conceptualization and identification of item domain and item generation. This phase considered various information sources, including (i) a systematic review of existing literature to understand previously studied aspects and measures of adherence of people living with chronic diseases in LMICs (reported separately30), (ii) in-depth qualitative interviews (further detailed in next section), and (iii) established theoretical frameworks utilizing the Information-Motivation-Behavioral (IMB),33 the Ascertaining Barriers to Compliance (ABC) taxonomy of ESPACOMP,34 and the WHO framework.3 By integrating these three sources, this phase aimed to clearly define which aspects of adherence and its barriers to consider and to generate a broad pool of potential items that are relevant, understandable, and grounded in both theory and empirical evidence.
In-Depth Qualitative Interviews
The qualitative interviews allow for the identification of both explicit and implicit factors influencing medication adherence in patients with chronic disease, providing a variety understanding of respondents’ experiences and perspectives.
Sample Selection
Respondents selected for individual interviews were healthcare professionals (physician, nurses, and pharmacists) in Community Health Centres (CHCs) and people living with chronic disease(s). CHCs serve as the primary reference for health services that provides basic health services for the Indonesian community at the village and sub-district levels. CHCs focus on managing chronic diseases such as diabetes mellitus and hypertension to improve the quality of life for patients through regular medical consultations, group education sessions, and health status monitoring. Inclusion criteria for healthcare professionals comprised: 1) working in a CHC; 2) seeing/consulting for patients with chronic disease(s); and 3) willing to participate in the study. Inclusion criteria for patients with chronic disease(s) were: 1) aged over 18 years; 2) has a chronic condition that has been confirmed by a doctor and is being treated; 3) use medication for chronic disease; 4) willing to participate in the study. All physician participants were general practitioners actively involved in outpatient consultations for chronic disease management at the CHC level. Nurse participants were registered nurses assigned to chronic disease monitoring programs (Prolanis). Pharmacist participants were licensed pharmacists in direct patient counselling and medication dispensing within the CHC setting. Respondents were recruited and selected by the purposive sampling method. For those willing to participate, one of the authors did a one-on-one in-depth interview.
Data Collection
Individual interviews were conducted to explore medication adherence and associated barriers. Each respondent was interviewed once (15–30 min per interview). The interview was conducted in a semi-structured format to obtain the necessary information while using mostly open questions allowing respondents to share their experiences freely. The format of the interviews can be found in Appendix 2. All interviews were recorded using voice recorders. The interviewer took note of the respondents’ nonverbal clues during the session. Each interview was immediately followed by the interviewer writing field notes and directly transcribing the audio content. Interviews were undertaken until saturation was achieved, when categories had adequately developed in accordance with the previously described properties and dimensions, no longer containing any new attributes, dimensions, or relationships.35 A total of 27 in-depth interviews were conducted, comprising 10 healthcare professionals (4 pharmacists, 3 physicians, and 3 nurses) and 17 patients with chronic diseases. Thematic saturation was assessed separately for each participant group. Among healthcare professionals, no new adherence-related categories emerged after the ninth interview; one additional interview was conducted to confirm saturation (n = 10). Similarly, among patients, saturation was reached after the fifteenth interview, followed by two additional interviews to verify stability of the findings (n = 17). All interviews were conducted in Bahasa Indonesia, the national language and native tongue of all participants. Transcription was performed directly in Bahasa Indonesia by the interviewer, a native speaker with qualitative research training. English translations of selected excerpts presented in this manuscript were prepared by the research team. After saturation was achieved, we concluded that all major categories that could explain medication adherence were collected and the interview ended.
Data Analysis
The analysis began with initial coding to identify key features related to medication adherence and barriers. These codes were then organized into potential themes with the help of Atlas.ti9 software, which were reviewed and refined to ensure they accurately represented the data. A thematic content analysis approach was employed to systematically analysed the qualitative data. The domains and items were initially drafted by QAK and then reviewed by SDA.
Phase 2: Content and Face Validity
Content Validity
Once preliminary items were developed, the drafted scale underwent content validation by a panel of 12 experts, including 4 pharmacists, 3 doctors, 3 nurses, 1 epidemiologist, and 1 psychometric expert, who were the same professional health workers involved in the in-depth interviews. It is advised that these panels include at least five experts with multidisciplinary background (at least doctor, pharmacist, nurse, and pharmacoepidemiologist) to have adequate control over chance agreement.36 This content validity assessment resulted in the refinement of sentence structures, deletion of certain items, and the addition of new items based on the panel’s feedback. Notably, the panel provided feedback on the comprehensiveness and appropriateness of the individual items and evaluated how well they reflected the attributes of the drafted novel medication adherence scale. The quantitative content validity of the draft scale was determined by computing the Content Validity Index (CVI) for each item. Experts independently evaluated each item using a four-point Likert scale. Ratings ranged from 1= indicating complete irrelevance, 2= indicating relevant but needs some revision, 3= relevant but needs minor revision, and 4= full relevance. To obtain the content validity index for relevance of each item (I-CVIs), the number of experts who thought the item was relevant or clear (rated 3 or 4) was divided by the number of total experts. Items with an I-CVI score below 0.7 were deleted, while scores ranging between 0.79 and 0.70 indicated the need for modification.37
The Content Validity Ratio (CVR), which evaluates the perceived necessity of individual items, was not separately calculated in this study. This decision was based on the theory-driven nature of item generation: all items were derived deductively from the WHO five-dimension framework of medication adherence, in which the essentiality of each dimension as a domain of the construct was established a priori. As CVR is primarily indicated for screening large, inductively generated item pools where item necessity is uncertain,38,39 its application was considered redundant given the structured conceptual basis of item development. The use of I-CVI was judged sufficient to ensure accurate, chance-corrected assessment of item relevance and scale-level content validity.40 Content validity assessments were conducted using structured rating forms completed independently by experts. Agreement was quantified using the I-CVI, which serves as a consensus-based measure of agreement. Formal interrater reliability statistics (eg., Cohen’s kappa) were not calculated.
Additionally, the panel was invited to provide general suggestions and input on the scale. Regarding the qualitative content validity, the panel evaluated and remarked on word choice, item sequence, and score.41 They were also asked to evaluate the relevance of each item to chronic conditions, specifically hypertension, diabetes mellitus, and dyslipidaemia, the comprehensiveness of the key concepts, the clarity of the instructions, items, response options, and recall period, and the overall suitability of the items regarding specific populations and context.42
Based on the results of the first-stage content validity assessment, the items were revised to address issues related to clarity, wording, and conceptual alignment before proceeding to the second-stage evaluation. Content validity was assessed in two sequential stages. In the second stage, an independent panel consisting of one pharmacist and two psychometric experts, who were not involved in the qualitative phase, conducted a separate content validity assessment of the revised item set to provide an additional layer of independent evaluation. This two-stage process was designed to balance contextual relevance from the initial panel with independent expert validation in the second stage. Their input was used for refining the item pool and ensuring that the scale effectively captured the multifaceted nature of medication adherence barriers.
Face Validity
The draft self-reported scale was administered to 10 patients with chronic disease(s), which is consistent with recommendation for preliminary qualitative pretesting and cognitive interviewing, where small samples (typically 5–15 participants) are considered sufficient to identify major issues related to clarity, comprehension, and item interpretation.43 This was done through individual face-to-face interviews to check for readability, comprehensibility, and clarity. This methodology allowed insights into item clarity and readability, informing subsequent revisions. By eliciting verbalizations of thought processes, cognitive interviewing enabled the identification of potential ambiguities, question reformulations, and the optimization of item content to accurately capture intended constructs.44 A pre-test was conducted to ensure items were relevant to the target population, thereby minimizing misunderstandings and subsequent measurement errors before the larger scale survey administration.45 Pre-testing eliminates poorly worded items and could revise phrasing for clarity, reducing cognitive burden on research respondents and allowing the target population to contribute insights to the survey development process.46
Phase 3: Psychometric Analysis
Psychometric analyses were conducted to evaluate the measurement properties of the newly developed adherence scale.
Population Sampling and Adherence Scale Administration
We administered the newly developed draft adherence scale at seven CHCs and one public hospital in Bandung, Indonesia among patients with chronic disease(s). In light of the shared disease trajectories of hypertension, diabetes, and dyslipidaemia, the study was limited to patients with these conditions to ensure sample homogeneity and a targeted assessment of the scale’s structure. The study respondents were chosen based on predefined inclusion and exclusion criteria, ie. all outpatients, including adults and the elderly who were diagnosed by a doctor and were currently taking medication met the inclusion criteria. Patients under 18 years old, pregnant women, patients with mental illnesses, and patients who were diagnosed with chronic diseases for the first time were excluded. We generated descriptive statistics on the characteristics of the respondents, encompassing gender, age group, type of primary disease (initial diagnosis), presence or absence of multimorbidity (defined as the presence of at least two diagnosed conditions, regardless of whether the disease of the inclusion criteria or are other chronic diseases), duration of the first diagnosed disease, and total number of medications administered for all conditions. This scale was provided in a paper-based format during the period October 2023 to February 2024. Data collection was conducted during scheduled Prolanis (chronic disease management program) sessions, where eligible patients were routinely present. Prior coordination with healthcare providers ensured that patients were informed about the study following the session. All eligible patients who were approached agreed to participate, and no refusals were recorded. Questionnaires were completed on-site and reviewed for completeness at the time of collection, resulting in a complete dataset with no missing responses. Data collection was carried out by three pharmacy graduates who had received prior training. To perform psychometric analysis on scale items, eight times the number of items was required for an appropriate sample size.47 To observe acceptable comparison patterns, the minimum sample size was estimated to range from 100–250 respondents.48 To ensure the stability and generalizability of our findings, we aimed for a larger sample size that would minimize measurement errors and produce more reliable factor structures. Therefore, we set a target of 400 respondents.
Confirmatory Factor Analysis
Confirmatory Factor Analysis (CFA) was employed to evaluate the quality of scale’s items and select the optimal items for the scale. Prior to the CFA, the data’s skewness was examined to assess its distribution. Data can generally be considered to have a normal distribution if their skewness values are between −2 and +2 and their kurtosis values are between −7 and +7.49 As the data did not show a normal distribution, the Maximum Likelihood Robust (MLR) estimator was employed. This method corrects for non-normality by adjusting standard errors and chi-square statistics (using the Satorra-Bentler correction), leading to more accurate p-values, confidence intervals, and less biased chi-square values.50 Item deletion decisions were not based solely on standardized factor loading magnitudes, but also incorporated consideration of cross-loading patterns, item’s impact on overall model fit improvement upon removal, and essential theoretical justifications. Items having absolute loading values of at least 0.3 were considered to be suitable.51 Average variance extracted (AVE) was calculated to measure the proportion of variance in a set of indicators explained by the latent construct relative to measurement error.
Reliability
The reliability of the novel adherence scale was assessed using composite reliability (McDonald’s Omega) and Cronbach’s Alpha. These two methods, while distinct in their calculations, converge on assessing the internal consistency of the latent variables. Test-retest reliability was evaluated by asking respondents to complete the scale a second time after a one-week interval. The test-retest was assessed in a sub-sample of 34 respondents who, at the time of the initial survey agreed to complete the scale a second time after a one-week interval. The test-retest reliability of the scale was determined using Spearman correlation coefficient, a coefficient of ≥ 0.70 was pre-specified as the minimum acceptable threshold for instrument stability.52
Convergent Validity
Convergent validity was evaluated to demonstrate that the newly developed medication adherence scale measured the same construct as other established instruments. This was assessed by examining correlations between the total adherence score obtained from our new scale and two comparator measures administered concurrently to the same respondents at the same time. The first comparator was the total score of the 5-item Medication Adherence Report Scale (MARS-5), a widely used and previously validated self-report measure.18 The second comparator was the Visual Analog Scale (VAS) for Adherence, a single item measuring adherence in the past 7 days, obtained by asking respondents, “In the last 7 days, how many days did you take your medication as prescribed by your doctor?” The response ranged from 7 (no missed doses) to 0 (no doses taken).53 MARS-5 captures multiple behavioral dimensions of adherence (eg., forgetfulness and intentional non-adherence),18 whereas VAS provides a global estimate of adherence,54 allowing for complementary validation of the construct. It is important to note that this scale measures adherence barrier burden, higher total scores indicate a greater number and/or frequency of self-reported barriers to medication adherence (score range 0–60, where 0 = no adherence barriers and 60 = maximum barrier burden). This scoring direction is inverse to that of adherence behavior scales (eg., MARS-5 and VAS adherence), in which higher scores reflect better adherence.
Concurrent Criterion Validity
Criterion validity, specifically concurrent validity, was assessed by examining the relationship between scores on the newly developed medication adherence scale and relevant clinical outcomes. These clinical outcomes were measured concurrently with the administration of the scale, ensuring a direct comparison between the self-reported adherence data and the objective clinical measures. Clinical outcome status was defined based on the respondent’s primary diagnosis. Blood pressure was used for respondents with hypertension, and fasting blood glucose for those with diabetes. Respondents were classified as “controlled” or “uncontrolled” according to condition-specific clinical thresholds. For respondents with both conditions, the most recent measurements for each condition were used, and individuals were classified as “controlled” only if all relevant indicators met the defined thresholds. For patients diagnosed with hypertension, clinical control status was determined based on resting blood pressure (BP) measurements, with a BP of < 140/90 mmHg classified as “controlled” and ≧ 140/90 mmHg as “uncontrolled”.55 For patients with diabetes, clinical control status was assessed using Fasting Blood Glucose (FBG) levels; patients were instructed to fast for at least 6 hours prior to the measurement, with an FBG level of < 126 mg/dL classified as “controlled” and ≧ 126 mg/dL as “uncontrolled”.56 For the purpose of this analysis, a dichotomous clinical outcome variable (0 = uncontrolled, 1 = controlled) was created for each patient based on the criteria relevant to their specific chronic condition. These clinical indicators represent disease control outcomes rather than direct measures of medication adherence.
Optimal Cut-off Score
To determine the optimal cut-off score for the newly developed adherence scale, Receiver Operating Characteristic (ROC) curve analysis was conducted. A single-item VAS was used as the external criterion for adherence. VAS was used as a reference measure for ROC analysis due to its feasibility and widespread use in adherence research. For the purpose of this analysis, respondents who reported taking medication for 7 days a week were categorized as “Adherent”, while those who reported taking medication for 0 to 6 days a week were categorized as “Non-Adherent”. The total score from the newly developed adherence scale was set as the test variable, while the dichotomized VAS Adherence status (0 = Non-Adherent, 1 = Adherent) served as the state variable. The positive state was defined as 1 (Adherent).
The ROC curve was plotted to visualize the trade-off between sensitivity and specificity at various possible cut-off points. The Area Under the Curve (AUC) was calculated to assess the overall discriminative ability of the scale, with the following criteria for interpretation: an AUC of 0.9 or higher was considered excellent; values between 0.8 and 0.9 were interpreted as considerable; those from 0.7 to 0.8 were deemed fair; an AUC between 0.6 and 0.7 was categorized as poor; and any value less than 0.6 was classified as a fail.57
The optimal cut-off score was identified from the “Coordinates of the Curve” table This point was determined by selecting the score that maximized Youden’s Index (J), which is calculated as J=Sensitivity+Specificity−1.57 This approach ensures a balanced optimization of both sensitivity (the ability to correctly identify truly adherent individuals) and specificity (the ability to correctly identify truly non-adherent individuals).
Missing Value Analysis
A two-person verification process was implemented for data input. A primary officer was responsible for data entry, while a secondary officer, the checker, verified the accuracy and completeness of each record. Any missing data identified by the checker was subject to reconfirmation and verification against the original interview sheet. Missing data were assessed using Missing Value Analysis procedures. The results indicated that there were no missing values in the variables included in the analysis. Consequently, EM estimation and Little’s MCAR test were not computed. Although, missing data were initially planned to be handled using the Full Information Maximum Likelihood (FIML) method, a method commonly applied in confirmatory factor analysis under Missing at Random (MAR) or Missing Completely at Random (MCAR) assumptions.58 Unlike listwise deletion, which discards cases with missing values, or imputation techniques that fill in missing data, FIML utilizes all available information from each case, even when some values are absent. However, as no missing values were present in the analytical dataset, FIML estimation did not influence the results.
Statistical Analysis
The evaluation of model fit relied on several commonly used techniques, including the chi-square test, Root Mean Square Error of Approximation (RMSEA ≤ 0.06), Tucker Lewis Index (TLI ≥ 0.95), Comparative Fit Index (CFI ≥ 0.95), Standardized Root Mean Square Residual (SRMR ≤ 0.08), Weighted Root Mean Square Residual (WRMR ≤ 1.0), and Goodness-of-Fit (GoF) index ≥ 0.8.31 These metrics provided valuable insights into the adequacy of the measurement model. An AVE value ≥ 0.5 generally indicates acceptable convergent validity at the factor level. However, if the AVE is below 0.5 but the reliability exceeds 0.6, convergent validity could still be considered acceptable.59
For reliability analysis, a minimum value of 0.60 is generally considered acceptable for reliability, with higher values indicating greater reliability.60 A Cronbach’s alpha threshold of ≥ 0.60 was considered acceptable in the context of early-stage scale development and multidimensional constructs, where slightly lower internal consistency may be expected.49 The test-retest reliability of the novel adherence scale was determined using bivariate correlation. For concurrent validity analysis, the total scale’s scores were correlated with VAS Adherence, MARS-5, and clinical objective measures. Given the non-normal distribution of the data, Spearman correlation coefficient was employed for all bivariate correlational analyses. For interpreting correlation coefficient values, these were typically categorized as follows: values above 0.70 indicated strong correlation; value between 0.40 and 0.69 indicated moderate correlation; and values below 0.40 indicated weak correlation.61 To assess the representativeness of group retest, baseline characteristics of respondents included in the test–retest analysis were compared with those of the remaining sample. Continuous variables were summarized as mean (standard deviation) and compared using independent-samples t-tests, while categorical variables were presented as frequencies and percentages and compared using chi-square tests. A p-value of <0.05 was considered statistically significant. All analyses were performed using JASP software (version 0.19.1).
Results
General Characteristics of Respondents
A total of 419 respondents were approached and all agreed to enrol in the study, resulting in a 100% response rate. A complete dataset was obtained from all respondents. The majority age group among respondents was 60–69 years old (38.7%), closely followed by those 70 years older (36.4%) (Appendix 3). Most respondents were female (79.7%). The majority (51.8%) had been diagnosed with chronic diseases for 5 to 10 years. Most respondents (31.3%) were prescribed 3–4 medications per day. Hypertension was the most prevalent condition, affecting 77.3% of the respondents. Additionally, 42% of the respondents had comorbidity. All respondents (100%) were exempt from prescription charges due to national health insurance coverage.
A total of 34 respondents completed the test–retest assessment and were compared with the remaining sample (n=385). Overall, the two groups showed similar baseline characteristics (Appendix 4). There were no statistically significant differences in sex distribution (79.4% vs. 79.7%, p=0.997), mean age (64.2 [7.2] vs. 65.4 [9.3] years, p=0.360), total number of medications taken (2.06 [1.88] vs. 2.62 [1.61], p=0.113), hypertension prevalence (76.5% vs. 77.4%, p=0.727), or duration of disease (7.44 [4.34] vs. 7.74 [6.55] years, p=0.723). These findings suggest that the test–retest subgroup was broadly comparable to the overall study population.
Scale Development and Psychometric Analysis
This section presents the results organized by the three stages of scale development and psychometric testing: (i) item development and generation (ii) content and face validity, and (iii) psychometric analysis.
Phase 1: Item Development and Generation
First, our systematic review identified common barriers experienced by patients with chronic disease, such as financial issues, use of traditional medicines, religious beliefs, lack of communication with healthcare providers, running out of medicine, and access to care, with detailed results reported elsewhere.30 Once the review was completed, in-depth interviews with healthcare professionals and patients provided qualitative data on perceived adherence barriers, which we categorized into 13 distinct categories (Appendix 5). The IMB model informed our approach by emphasizing that adherence is influenced by patient’s knowledge (Information), willingness (Motivation), and practical abilities (Behavioural Skills).33 The ABC taxonomy’s breakdown was used for guiding the structure of the novel adherence scale, ensuring coverage of different ways non-adherence can manifest throughout the treatment process.34 Drawing directly from the ABC taxonomy, our scale framework was systematically structured to exclusively focus on the implementation phase, specifically targeting barriers encountered while patients are actively taking medication as prescribed.
After having performed this groundwork, we drafted the initial domains and items. The items were grouped into problem domains that provided insights into the factors contributing to non-adherence among patients with chronic disease, covering four conceptual domains: (1) patient-related factors, (2) medication-related factors, (3) healthcare and system related factors, and (4) socioeconomic related factors (Appendix 6).
Phase 2: Content Validity and Face Validity
Content Validity
Firstly, we developed a 22-item scale. The content assessment utilized the I-CVI method, whereby items with an I-CVI score below 0.7 were deleted, while scores ranging between 0.79 and 0.70 indicate the need for modification (Appendix 7). The initial draft of the scale items utilized a frequency question format, beginning with “how often”. Following expert feedback suggesting the statement format was preferable, all items were revised accordingly for the second content validity assessment.
Based on the I-CVI values from this stage, item number 8 had an I-CVI score of 0.67, meaning it had to be deleted. The original item was, “How often do you take medicine belonging to someone else?” Items 16 and 22 had I-CVI scores of 0.75, indicating that modification was necessary. Item 16, originally phrased as “How often do you miss your medication schedule because you dislike the service flow in the healthcare system?”, was revised into a statement reflecting the new format, “I feel the service flow is too complicated, leading me to delay getting the medicine, which causes me to miss my medication schedule.” Similarly, item number 22, originally “How often do you miss your medication schedule because you are bored?”, was revised to, “I miss my medication schedule because I am bored.” Additionally, the experts suggested the addition of new items for the second content validity assessment. So, in the first round of the content validity assessment, it was found that one item needed to be removed, two items required modifications, and an additional 29 items were added, resulting in a total of 50 items in the second version of the scale.
In the second round, content validity was conducted by three experts, including one pharmacist and two psychometric experts (Figure 1). The content assessment utilized the I-CVI method, whereby items with an I-CVI score below 0.7 were deleted, while scores ranging between 0.79 and 0.70 indicated the need for modification. The results of this I-CVI assessment resulted in the removal of 15 items (Appendix 7).
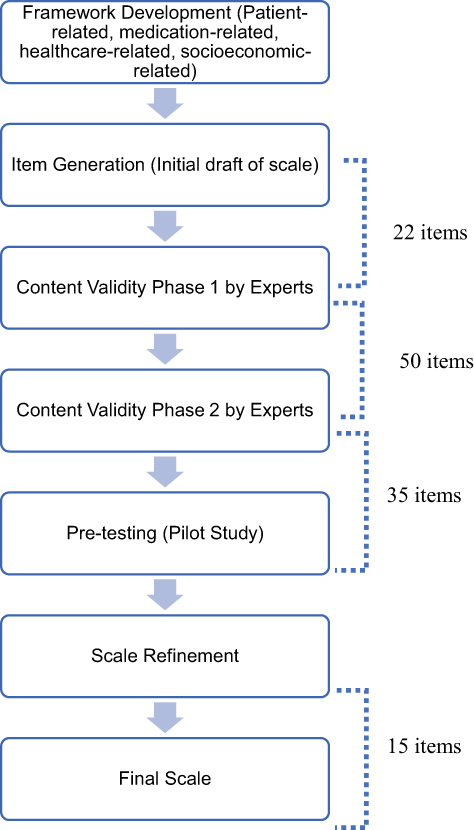 |
Figure 1 Flowchart of Development Medication Adherence Scale. |
Face Validity
In the next draft scale version, 35 question items underwent preliminary item evaluation by cognitive interviews with patients. This scale employed a 5-point Likert scale, with response options ranging from 0 (never) to 4 (always) to measure the level of adherence. The results of the cognitive interviews provided valuable insights into survey language refinement, as well as the identification of potential ambiguities, misunderstandings, and biases that could compromise data quality (Appendix 8). Following the cognitive interviews, modifications were made to several sentences to improve clarity.
Phase 3: Psychometric Analysis
A total of 20 items were removed from the analysis due to insufficient factor loadings (below the established threshold of 0.3) (Figure 2). However, an exception was made for item SC4, related to religious belief, and item SC7, related to financial constraints within the socioeconomic domain. Despite their factor loadings of only 0.287 and 0.236, respectively, these items were chosen to be retained in the adherence scale given their LMICs specific relevance. However, these items were retained due to their strong theoretical and contextual relevance to medication adherence, particularly in relation to sociocultural and financial determinants in the study setting. As a result, the final scale included 15 items (Appendix 9). Each of the 15 items can be scored with 0 (never) to 4 (always). As such, the newly developed scale total score ranges from 0 (no adherence barriers at all) to 60 (all adherence barriers reported).
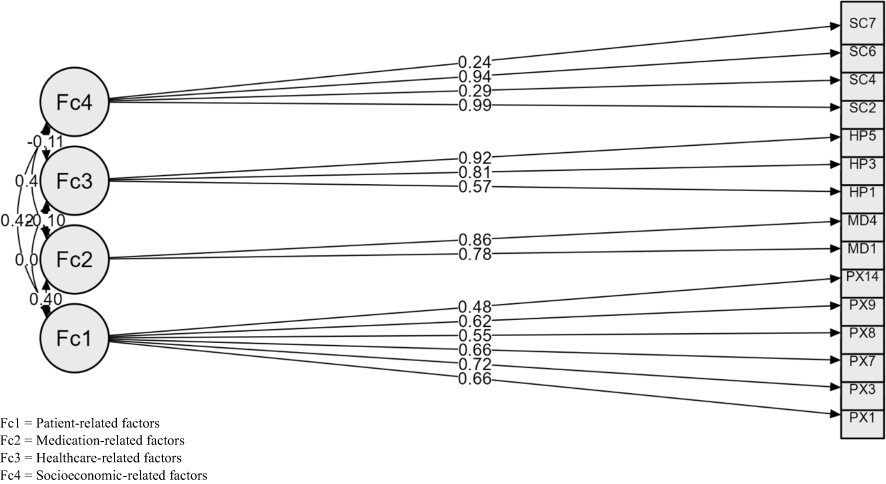 |
Figure 2 Confirmatory Factor Analysis. |
Validity and Reliability
The AVE values for the medication-related (AVE = 0.670) and healthcare-related (AVE = 0.630) factors demonstrated adequate convergent validity. In contrast, the patient-related (AVE = 0.404) and socioeconomic-related (AVE = 0.350) factors showed AVE values below the conventional 0.50 threshold. However, both domains exhibited composite reliability values were high (eg., 0.812 and 0.805, respectively), and their Cronbach’s Alphas were also strong (eg., 0.727 and 0.710, respectively) (Table 1). The goodness-of-fit indices of the final model were satisfactory, as indicated by χ2 = 179.477, GFI = 0.947, TLI = 0.951, CFI = 0.961, RMSEA = 0.052, and SRMR = 0.048 (Table 2).
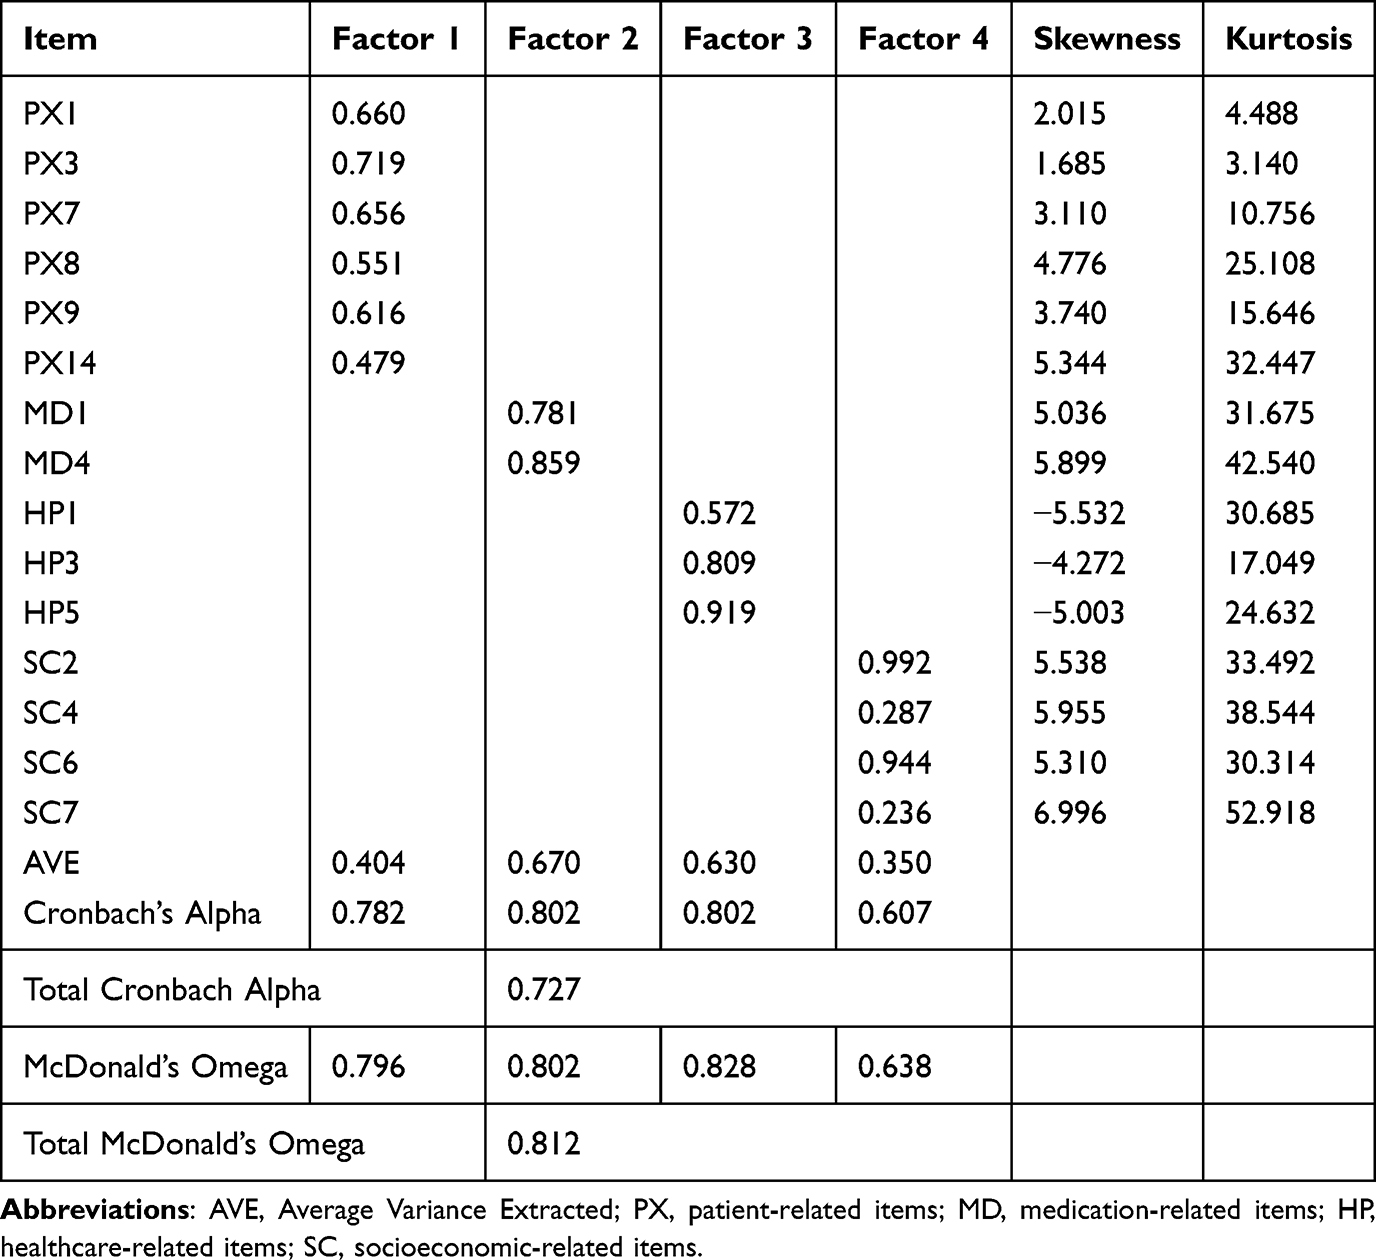 |
Table 1 Factor Loadings and Internal Consistency of the Medication Adherence Barrier Scale (N = 419) |
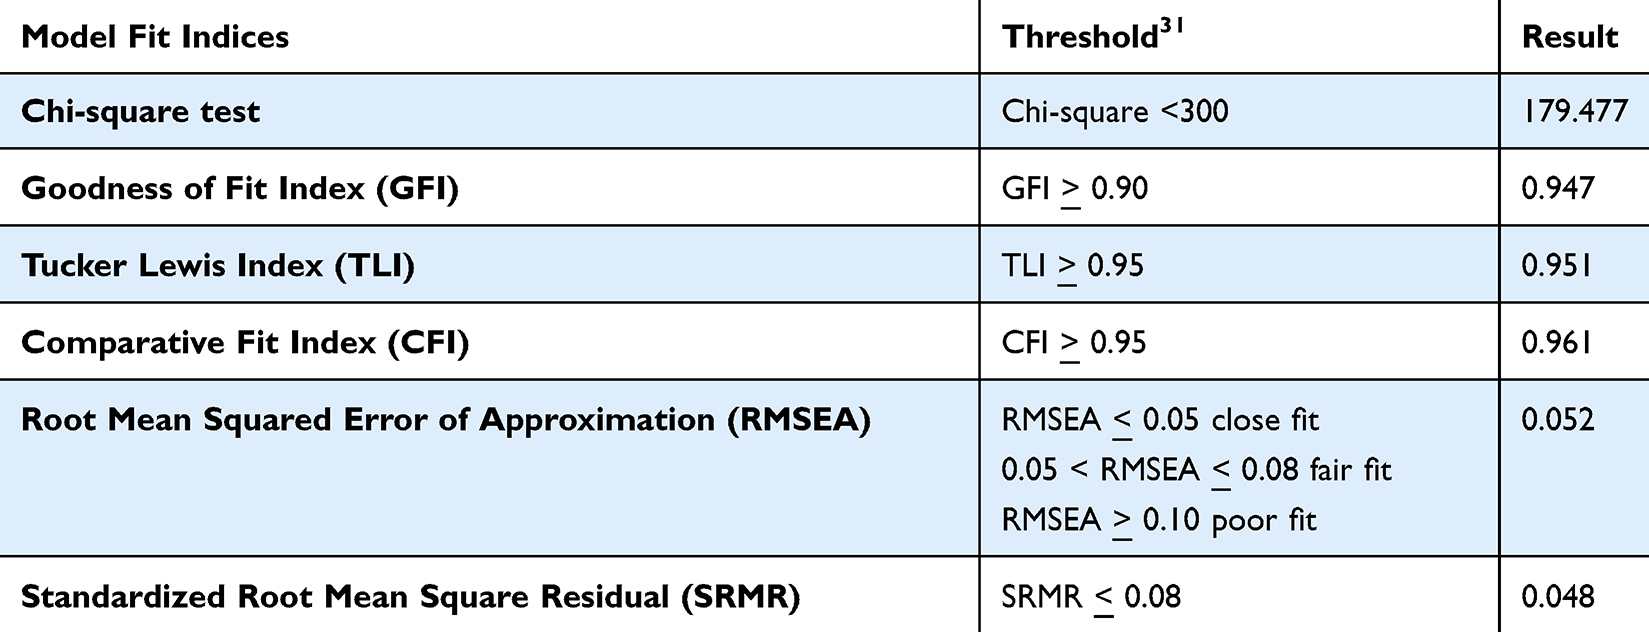 |
Table 2 Model Fit Indices for the Confirmatory Factor Analysis of the Scale |
Correlation with Existing Scales
The new adherence scale showed a strong negative correlation with the MARS-5 (r = −0.707, p < 0.001) and with VAS Adherence (r = −0.725, p < 0.001). A moderate negative correlation was also found between the new scale and clinical measurements (r = −0.632, p < 0.001). Furthermore, test-retest reliability was demonstrated by a strong positive correlation of 0.802 (p < 0.001) between scores obtained from initial and retest administrations, with a one-week interval (Table 3).
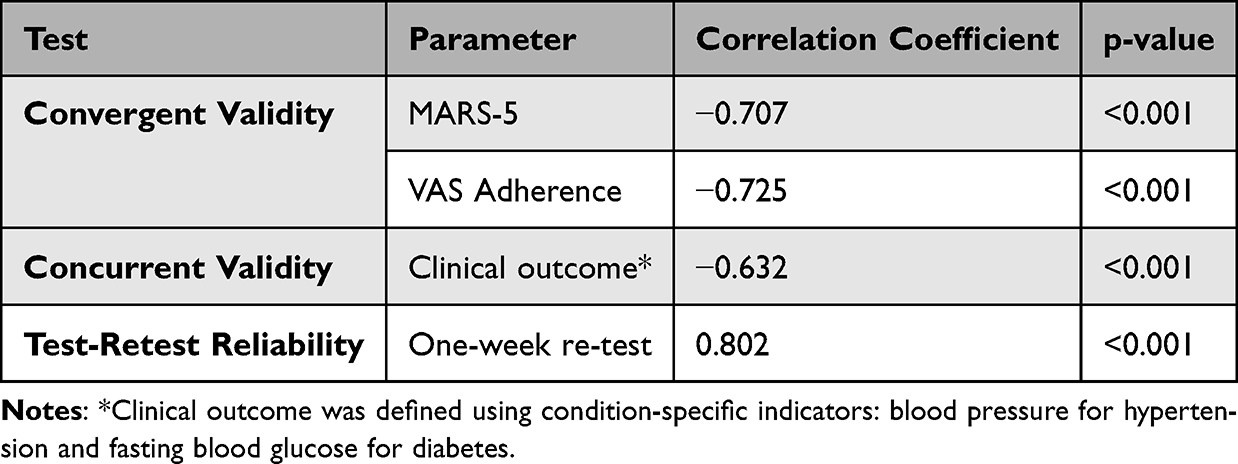 |
Table 3 Concurrent Validity, Convergent Validity, and Test-Retest Reliability |
Cut-off Score
The AUC for the newly developed scale was 0.921 (95% CI 0.889–0.953, p < 0.001) (Table 4). This indicates excellent discrimination of the scale in distinguishing adherence status. The ROC curve visually representing this discrimination is presented in Appendix 10. Based on the ROC analysis, an optimal cut-off score of 15 was identified for the adherence scale. This cut-off score was determined by maximizing Youden’s Index (J), which yielded the best balance between sensitivity and specificity. At this cut-off score, the scale demonstrated a sensitivity of 96.2% and a specificity of 71.4%. This means that when using a score of 15 or lower as an indicator of adherence, the scale correctly identified 96.2% of truly adherent individuals and 71.4% of truly non-adherent individuals.
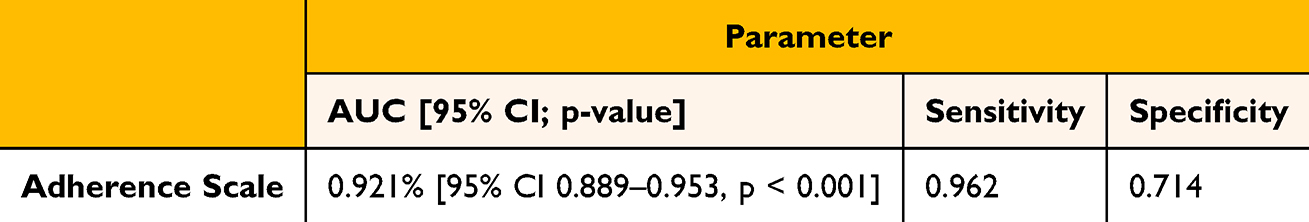 |
Table 4 ROC Analysis |
Discussion
The primary finding of this study is the development and psychometric evaluation of a novel LMICs-relevant 15-item medication adherence scale, informed by theoretical perspectives and empirical data, designed to assess barriers to adherence among patients with chronic diseases. The negative correlations observed between the developed scale and MARS-5 and VAS adherence scores are consistent with the scoring direction, as higher barrier scores reflect lower adherence. This finding is theoretically expected, as higher barrier scores reflect greater challenges to consistent medication-taking behavior. The consistency reinforces the conceptual alignment of the new scale with established adherence constructs.31
Although a strong association between medication adherence and clinical outcomes would be theoretically expected, the observed correlation between the scale scores and objective clinical indicators was moderate. This discrepancy is likely attributable to methodological and contextual factors rather than limitations of the scale itself. While contextual and methodological factors may partly explain this finding, it is also important to consider the nature of the construct being measured. The scale captures self-reported perceived barriers to medication adherence rather than adherence behavior itself.
Clinical outcomes such as blood pressure and fasting blood glucose represent single time-point physiological measurements and are influenced by temporal variability, measurement conditions, and non-pharmacological factors that may not be captured concurrently with self-reported adherence data.62 It is important to note that these clinical indicators represent disease control outcomes rather than direct measures of adherence behavior and may therefore only indirectly reflect adherence behavior. In addition, adherence barriers reflect cumulative behavioral patterns, whereas clinical indicators may respond with delay or fluctuate independently of short-term adherence behavior.15 The use of a combined clinical outcome variable represents a pragmatic approach to capturing overall disease control across a heterogeneous population. However, this approach introduces conceptual heterogeneity, as blood pressure and fasting blood glucose reflect distinct physiological systems with different temporal dynamics and responsiveness to medication adherence. This may have contributed to the moderate strength of the observed associations. Perceived barriers may not always translate directly into objective non-adherence, as patients may employ compensatory strategies or receive social support that mitigates the impact of identified barriers. As such, the relationship between barrier burden and clinical outcomes is likely indirect and influenced by multiple intervening factors, which may explain the moderate strength of the observed associations. Importantly, despite these constraints, the observed association remains substantial and clinically meaningful, indicating that higher barrier burden is consistently related to poorer clinical control. This finding supports the validity of the scale while highlighting the inherent challenges of linking behavioral measures to cross-sectional clinical outcomes in routine healthcare settings.
The socioeconomic domain demonstrated the weakest measurement properties among the four factors, with an AVE of 0.350 (below the conventional 0.50 threshold) and borderline internal consistency. While composite reliability exceeded the acceptable threshold, these findings suggest that the socioeconomic construct is measured with less precision than the other domains. This may reflect the conceptual heterogeneity of socioeconomic barriers in LMICs primary care settings, encompassing financial constraints, religious practices, and cultural beliefs, dimensions that may not cohere strongly within a single latent factor. These findings highlight a potential trade-off between statistical cohesion and conceptual completeness.
Implications
This newly developed medication adherence scale has important implications for health services research and routine clinical practice, particularly in lLMICs settings. By systematically capturing patient-, medication-, healthcare system-, and socioeconomic-related barriers, the scale provides actionable information that can support service-level decision-making beyond the measurement of adherence alone. In primary care settings, such as community health centers, the scale may be used as a screening tool to identify patients at higher risk of non-adherence and to stratify patients based on dominant barrier profiles, enabling more targeted and efficient use of limited healthcare resources. From a health services perspective, aggregated scale results can inform quality improvement initiatives, workforce planning, and the design of tailored adherence support interventions that address system-level bottlenecks, such as service flow complexity, medication access, or patient–provider communication. Furthermore, the scale offers a practical means to generate context-specific data that can be integrated into routine service evaluations, monitoring frameworks, and implementation research, supporting the development of more responsive, equitable, and patient-centered healthcare services in LMICs.
Our newly developed scale distinguishes itself significantly from existing self-reported adherence instruments in several important ways. First, it was explicitly developed to address contextual barriers relevant to LMIC settings, which are often underrepresented in commonly used adherence questionnaires. Commonly used instruments, such as the MMAS-822 and the MARS-518 that were developed primarily in HICs contexts, capture individual-level adherence behaviors, such as forgetfulness or intentional non-adherence, without addressing broader sociocultural, financial, or health system-related determinants. Similarly, while the ARMS was developed with resource-limited context in mind, its focus remains primarily on medication refill and dosing behavior, offering limited coverage of healthcare system-level or socioeconomic barriers.23 The present scale explicitly incorporates these multidimensional barriers, which are particularly significant in LMICs primary care contexts. Second, unlike many previously developed instruments from LMICs,30 the scale was developed and evaluated using established methodological standards, including rigorous psychometric testing in line with COSMIN recommendations, ensuring its validity and reliability. Additionally, while instruments such as the MMAS-8 are widely used, their application may be constrained by licensing requirements,22 which can limit accessibility in resource-constrained research and clinical settings, the present scale was developed as an open and contextually grounded alternative. Finally, the scale integrates the assessment of medication adherence with the identification of specific, actionable barriers, allowing it to move beyond quantifying adherence behavior alone. By capturing both the extent of adherence difficulties and the underlying reasons for non-adherence, the scale provides context-specific information that is directly relevant for designing targeted and effective adherence support strategies in routine clinical practice.
While the scale demonstrates robust psychometric properties and could technically be applied across different healthcare settings, its primary design and validation were conducted within an LMICs context. As such, use of the scale in high-income country settings would require further contextual evaluation to ensure relevance and construct validity. Beyond its measurement function, the scale offers practical value by supporting the identification of specific adherence barriers that can inform targeted intervention development and service-level decision-making in routine clinical practice.63,64
Strengths, Limitations, and Future Directions
One of the main strengths of this study lies in its psychometric development and evaluation, conducted in accordance with established methodological standards, ensuring the reliability and validity of the newly developed medication adherence scale. In addition, the scale was specifically designed to capture a broad range of contextually relevant adherence barriers within an LMICs setting, providing information that extends beyond adherence quantification and supports practical application in routine healthcare services.
However, the study also has several limitations that need to be acknowledged. First, our sample for scale development was primarily drawn from healthcare facilities in the Bandung area of Indonesia. As such, the findings may not fully represent the diversity of healthcare systems, sociocultural contexts, and patient populations across other regions or LMICs settings. Therefore, caution is warranted when generalizing these results beyond the study context. This study also did not collect data on respondents’ years of professional practice, which may serve as an important proxy for clinical experience and expertise. The absence of this information limits our ability to assess potential variations in responses based on level of practice and may affect the interpretability and reproducibility of the findings. Second, validation relied primarily on self-reported adherence measures and cross-sectional clinical indicators, without the inclusion of objective adherence data such as pharmacy refill records or electronic monitoring. Third, all respondents were covered by national health insurance, suggesting that caution is required when interpreting these results to contexts with financial barrier to medication adherence. Fourth, the study did not distinguish between analyses of old and new patients, nor did it account for the complication levels of patients, which may have led to the results being either underestimated or overestimated. Fifth, certain factors relevant to medication adherence, such as the duration of medication use, and severity of the disease, the specific phase of adherence (eg., initiation, continuous, persistence) were not explicitly accounted for or analyzed in detail during the psychometric validation of the scale. Sixth, this study did not examine inter-item and item-to-total correlations, which may provide additional information on item-level performance. Seventh, two items with relatively low factor loadings were retained based on theoretical and contextual considerations. While this approach supports content and ecological validity, it may weaken the statistical strength of the construct and should be interpreted with caution. Eighth, the use of overlapping respondents in the first content validity stage may introduce bias. Ninth, the use of VAS as the reference standard in ROC analysis represents a limitation, as it is a self-reported measure and may be subject to recall and social desirability bias. Consequently, the diagnostic performance of the proposed cut-off score should be interpreted as relative rather than definitive. Tenth, the socioeconomic domain demonstrated relatively weaker measurement properties, which may limit the precision of this construct and should be interpreted with caution. Finally, the scale was validated among patients with selected chronic conditions, and its applicability to other disease groups or healthcare settings requires further evaluation through external validation studies.
Future research should prioritize external validation of this scale in diverse populations and healthcare settings beyond the Bandung context, including other regions within Indonesia and broader LMICs settings, to assess its generalizability and cross-cultural applicability. In addition, validation against objective adherence measures, such as pharmacy refill records, pill counts, or electronic monitoring devices, is essential to strengthen criterion validity and support the scale’s application in clinical and health services research. Longitudinal studies are also needed to evaluate the predictive validity of the scale in relation to long-term clinical outcomes, including disease control and healthcare utilization. Further research may explore scale performance across patient subgroups defined by disease severity, duration of medication use, and adherence phase (initiation, implementation, and persistence), as well as refine items with weaker psychometric properties, particularly within the socioeconomic domain, and assess whether certain sub-dimensions warrant separate factor representation.
Conclusion
This research has developed and psychometrically validated a 15-item scale to assess medication adherence barriers among people with chronic disease, providing a reliable and contextually relevant tool for LMICs primary care settings. The scale demonstrated acceptable reliability and validity, supporting its use in capturing multidimensional adherence barriers. This tool can help healthcare providers in obtaining relevant and context-specific information to inform targeted intervention strategies. As such, it may contribute to more tailored and effective adherence support in routine clinical practice.
Data Sharing Statement
All data supporting the findings of this study are available within the paper and its Supplementary Information.
Ethical Approval and Consent to Participate
This study was approved by the Institutional Review Board of Universitas Padjadjaran (Approval No. 870/UN6.KEP/EC/2022) and conducted in accordance with the Declaration of Helsinki. Ethical approval covered all study components, including individual interviews, expert opinion, and psychometric evaluation. Permission was obtained from participating community health centres (CHCs) and the hospital prior to data collection. All respondents were fully informed about the study objectives and procedures, and written informed consent was obtained from all respondents. Anonymity and confidentiality of respondent data were strictly maintained throughout the study. The respondents’ informed consent explicitly covered the publication of anonymized responses and direct quotes derived from the study.
Consent for Publication
Not applicable. This study does not contain any individual person’s data in any form, including identifiable images or personal details.
Acknowledgments
The authors would like to acknowledge MIF, SN, and PA for their assistance in data collection. We also extend our gratitude to the experts (RT, IF, DL, RS, SR, DH, GT, AD, WL, TM, RJ, HSW, IMP, SN, HS) for their valuable contributions to the content validity process.
Author Contributions
All authors made a significant contribution to the work reported, whether that is in the conception, study design, execution, acquisition of data, analysis and interpretation, or in all these areas; took part in drafting, revising or critically reviewing the article; gave final approval of the version to be published; have agreed on the journal to which the article has been submitted; and agree to be accountable for all aspects of the work.
Funding
QAK is supported by a postgraduate scholarship (PMDSU Scholarship) from the Indonesian Ministry of Education, Culture, Research, and Technology (No. 0267/E5/AK.04/2022).
Disclosure
The authors have no competing interests to declare that are relevant to the content of this article.
References
1. WHO. Noncommunicable diseases factsheet 2023. Available from: https://www.who.int/news-room/fact-sheets/detail/noncommunicable-diseases.
2. Piña IL, Di Palo KE, Brown MT, et al. Medication adherence: importance, issues and policy: a policy statement from the American Heart Association. Progress Cardiovascul Dis. 2021;64:111–17. doi:10.1016/j.pcad.2020.08.003
3. WHO. Adherence to Long-Term Therapies: Evidence for Action. World Health Organization; 2003.
4. Lee EKP, Poon P, Yip BHK, et al. Global burden, regional differences, trends, and health consequences of medication nonadherence for hypertension during 2010 to 2020: a meta-analysis involving 27 million patients. J. Am. Heart Assoc. 2022;11(17). doi:10.1161/JAHA.122.026582
5. Khoiry QA, Alfian SD, Abdulah R. Modifiable and non- modifiable factors associated with low awareness of hypertension treatment in Indonesia: a based national survey. Glob. Heart. 2022;17:56. doi:10.5334/gh.1143
6. Khoiry QA, Alfian SD, Abdulah R. Sociodemographic and behavioural risk factors associated with low awareness of diabetes mellitus medication in Indonesia: findings from the Indonesian Family Life Survey (IFLS-5). Front. Public Health. 2023;11:1072085. doi:10.3389/fpubh.2023.1072085
7. Pradipta IS, Aprilio K, Ningsih YF, et al. Treatment nonadherence among multimorbid chronic disease patients: evidence from 3515 subjects in Indonesia. Medicina. 2024;60:634. doi:10.3390/medicina60040634
8. Alfian SD, Sukandar H, Lestari K, Abdulah R. Medication adherence contributes to an improved quality of life in type 2 diabetesmellitus patients: a cross-sectional study. Diabetes Ther. 2016;7:755–764. doi:10.1007/s13300-016-0203-x
9. Cutler RL, Fernandez-Llimos F, Frommer M, Benrimoj C, Garcia-Cardenas V. Economic impact of medication non-adherence by disease groups: a systematic review. BMJ Open. 2018;8(1):e016982. doi:10.1136/bmjopen-2017-016982
10. Desai R, Nayak R. Effects of medication nonadherence and comorbidity on health resource utilization in schizophrenia. J. Manag. Care Spec. Pharm. 2019;25:37–44A. doi:10.18553/jmcp.2019.25.1.037
11. Kardas P. From non-adherence to adherence: can innovative solutions resolve a longstanding problem? European Journal of Internal Medicine. 2024;119:6–12. doi:10.1016/j.ejim.2023.10.012
12. Ferdinand KC, Senatore FF, Clayton-Jeter H, et al. Improving medication adherence in cardiometabolic disease. J. Am. Coll. Cardiol. 2017;69(4):437–451. doi:10.1016/j.jacc.2016.11.034
13. Lehmann A, Aslani P, Ahmed R, et al. Assessing medication adherence: options to consider. Int J Clin Pharm. 2014;36(1):55–69. doi:10.1007/s11096-013-9865-x
14. Kronish IM, Thorpe CT, Voils CI. Measuring the multiple domains of medication nonadherence: findings from a Delphi survey of adherence experts. Transl Behav Med. 2021;11:104–113. doi:10.1093/tbm/ibz133
15. Stirratt MJ, Dunbar-Jacob J, Crane HM, et al. Self-report measures of medication adherence behavior: recommendations on optimal use. Transl Behav Med. 2015;5(4):470–482. doi:10.1007/s13142-015-0315-2
16. Nguyen TMU, Caze AL, Cottrell N. What are validated self-report adherence scales really measuring?: a systematic review. Br. J. Clin. Pharmacol. 2014;77:427–445. doi:10.1111/bcp.12194
17. Moon SJ, Lee WY, Hwang JS, Hong YP, Morisky DE. Accuracy of a screening tool for medication adherence: a systematic review and meta-analysis of the morisky medication adherence scale-8. PLoS One. 2017;12(11):e0187139. doi:10.1371/journal.pone.0187139
18. Chan AHY, Horne R, Hankins M, Chisari C. The medication adherence report scale: a measurement tool for eliciting patients’ reports of nonadherence. Br J Clin Pharmacol. 2020;86:1281–1288. doi:10.1111/bcp.14193
19. Garfield S, Clifford S, Eliasson L, Barber N, Willson A. Suitability of measures of self-reported medication adherence for routine clinical use: a systematic review. BMC Med Res Methodol. 2011;11. doi:10.1186/1471-2288-11-149
20. Hatah E, Rahim N, Makmor-Bakry M, et al. Development and validation of Malaysia Medication Adherence Assessment Tool (MyMAAT) for diabetic patients. PLoS One. 2020;15(11):1–17. doi:10.1371/journal.pone.0241909
21. Tesfaye W, Peterson G. Self-reported medication adherence measurement tools: some options to avoid a legal minefield. J Clin Pharm Ther. 2021;1–6. doi:10.1111/jcpt.13515
22. Morisky DE, Ang A, Krousel-Wood M, Ward HJ. Predictive validity of a medication adherence measure in an outpatient setting. J Clin Hypertens. 2008;10:348–354. doi:10.1111/j.1751-7176.2008.07572.x
23. Kripalani S, Risser J, Gatti ME, Jacobson TA. Development and evaluation of the Adherence to Refills and Medications Scale (ARMS)among low-literacy patients with chronic disease. Value Health. 2009;12:118–123. doi:10.1111/j.1524-4733.2008.00400.x
24. Ndomba TS, Maluka SO. Barriers to health services access among indigent and vulnerable populations in Tanzania: perspectives of health service providers. Disc Health Syst. 2025;4:106. doi:10.1007/s44250-025-00290-y
25. Msoka EF, Orina F, Sanga ES, et al. Qualitative assessment of the impact of socioeconomic and cultural barriers on uptake and utilisation of tuberculosis diagnostic and treatment tools in East Africa: a cross-sectional study. BMJ Open. 2021;11:e050911. doi:10.1136/bmjopen-2021-050911
26. Magura J, Nhari SR, Nzimakwe TI. Barriers to ART adherence in sub-Saharan Africa: a scoping review toward achieving UNAIDS 95-95-95 targets. Front. Public Health. 2025;13. doi:10.3389/fpubh.2025.1609743
27. Kretchy IA, Owusu-Daaku F, Danquah S. Patterns and determinants of the use of complementary and alternative medicine: a cross-sectional study of hypertensive patients in Ghana. BMC Compl Altern Med. 2014;14:44. doi:10.1186/1472-6882-14-44
28. Saqlain M, Riaz A, Malik MN, et al. Medication adherence and its association with health literacy and performance in activities of daily livings among elderly hypertensive patients in Islamabad, Pakistan. Medicina. 2019;55:163. doi:10.3390/medicina55050163
29. Spencer J, Bahuguna M, Ramani S, et al. What constitutes ‘poor’ adherence to medical advice for chronic diseases? Insights from a qualitative study among hypertension and diabetes patients in urban informal settlements, Mumbai Metropolitan Region. PLoS One. 2025;20:e0324765. doi:10.1371/journal.pone.0324765
30. Khoiry QA, Alfian SD, Van Boven JFM, Abdulah R. Self-reported medication adherence instruments and their applicability in low-middle income countries: a scoping review. Front Public Health. 2023. 11. doi:10.3389/fpubh.2023.1104510
31. Boateng GO, Neilands TB, Frongillo EA, Melgar-Quiñonez HR, Young SL. Best practices for developing and validating scales for health, social, and behavioral research: a primer. Front Public Health. 2018. 6. doi:10.3389/fpubh.2018.00149
32. Gagnier JJ, Lai J, Mokkink LB, Terwee CB. COSMIN reporting guideline for studies on measurement properties of patient-reported outcome measures. Quality Life Res. 2021;30:2197–2218. doi:10.1007/s11136-021-02822-4
33. Fisher JD, Fisher WA. Changing AIDS-Risk behavior. Psychological Bulletin. 1992;111:455.
34. Vrijens B, De Geest S, Hughes DA, et al. A new taxonomy for describing and defining adherence to medications. Br. J. Clin. Pharmacol. 2012;73(5):691–705. doi:10.1111/j.1365-2125.2012.04167.x
35. Saunders B, Sim J, Kingstone T, et al. Saturation in qualitative research: exploring its conceptualization and operationalization. Qual Quant. 2018;52(4):1893–1907. doi:10.1007/s11135-017-0574-8
36. Zamanzadeh V, Ghahramanian A, Rassouli M, et al. Design and implementation content validity study: development of an instrument for measuring patient-centered communication. J Caring Sci. 2015;4(2):165–178. doi:10.15171/jcs.2015.017
37. Lynn MR. Determination and quantification of content validity. Nurs Res. 1986;35:382–385. doi:10.1097/00006199-198611000-00017
38. Lawshe CH. A quantitative approach to content validity. Pers Psychol. 1975;28:563–575. doi:10.1111/j.1744-6570.1975.tb01393.x
39. Gupta S, Grover S, Menon V, et al. Item generation and establishing face and content validity of a rating scale: a primer. Indian J Psychiatry. 2025;67(8):816–822. doi:10.4103/indianjpsychiatry_750_25
40. Polit DF, Beck CT, Owen SV. Is the CVI an acceptable indicator of content validity? Appraisal and recommendations. Res Nurs Health. 2007;30:459–467. doi:10.1002/nur.20199
41. Elo S, Kääriäinen M, Kanste O, et al. Qualitative content analysis. Sage Open. 2014;4(1):215824401452263. doi:10.1177/2158244014522633
42. Lewis BR, Templeton GF, Byrd TA. A methodology for construct development in MIS research. Eur J Informat Syst. 2005;14:388–400. doi:10.1057/palgrave.ejis.3000552
43. McColl E. Cognitive Interviewing. A tool for improving questionnaire design. Quality Life Res. 2006;15:571–573. doi:10.1007/s11136-005-5263-8
44. Beatty PC, Willis GB. Research synthesis: the practice of cognitive interviewing. Public Opinion Quarterly. 2007;71:287–311. doi:10.1093/poq/nfm006
45. Bowden A. Methods for pre-testing and piloting survey questions: illustrations from the KENQOL survey of health-related quality of life. Health Policy Plan. 2002;17:322–330. doi:10.1093/heapol/17.3.322
46. Hilton CE. The importance of pretesting questionnaires: a field research example of cognitive pretesting the Exercise referral Quality of Life Scale (ER-QLS). Int J Soc Res Methodol. 2017;20:21–34. doi:10.1080/13645579.2015.1091640
47. Tinsley HEA, Tinsley DJ. Uses of factor analysis in counseling psychology research. J. Couns. Psychol. 1987;34:414–424. doi:10.1037/0022-0167.34.4.414
48. Anthoine E, Moret L, Regnault A, Sbille V, Hardouin JB. Sample size used to validate a scale: a review of publications on newly-developed patient reported outcomes measures. Health Qual Life Outcomes. 2014;12:1–10. doi:10.1186/s12955-014-0176-2
49. Hair JF Jr, Black WC, Babin BJ, Anderson RE. Multivariate data analysis. Multivariate Data Analysis. 2010;785.
50. Li CH. Confirmatory factor analysis with ordinal data: comparing robust maximum likelihood and diagonally weighted least squares. Behav Res Methods. 2016;48:936–949. doi:10.3758/s13428-015-0619-7
51. Tavakol M, Wetzel A. Factor Analysis: a means for theory and instrument development in support of construct validity. Int J Med Educ. 2020;11:245–247. doi:10.5116/ijme.5f96.0f4a
52. Terwee CB, Bot SDM, de Boer MR, et al. Quality criteria were proposed for measurement properties of health status questionnaires. J Clin Epidemiol. 2007;60(1):34–42. doi:10.1016/j.jclinepi.2006.03.012
53. Kalichman SC, Amaral CM, Swetzes C, et al. A simple single-item rating scale to measure medication adherence: further evidence for convergent validity. J Int Assoc Phys AIDS Care. 2009;8(6):367–374. doi:10.1177/1545109709352884
54. Finitsis DJ, Pellowski JA, Huedo-Medina TB, Fox MC, Kalichman SC. Visual analogue scale (VAS) measurement of antiretroviral adherence in people living with HIV (PLWH): a meta-analysis. J Behav Med. 2016;39:1043–1055. doi:10.1007/s10865-016-9770-6
55. Unger T, Borghi C, Charchar F, et al. 2020 International society of hypertension global hypertension practice guidelines. Hypertension. 2020;75:1334–1357. doi:10.1161/HYPERTENSIONAHA.120.15026
56. ADA. 2. Classification and diagnosis of diabetes: standards of medical care in diabetes-2021. Diabetes Care. 2021;44:S15–S33.
57. Çorbacıoğlu ŞK, Aksel G. Receiver operating characteristic curve analysis in diagnostic accuracy studies: a guide to interpreting the area under the curve value. Turkish J Emerg Med. 2023;23:195–198. doi:10.4103/tjem.tjem_182_23
58. Lim AJ-M, Cheung MW-L. Evaluating FIML and multiple imputation in joint ordinal-continuous measurements models with missing data. Behav Res Method. 2021;54:1063–1077. doi:10.3758/s13428-021-01582-w
59. Fornell C, Larcker DF. Evaluating structural equation models with unobservable variables and measurement error. J Marketing Res. 1981;18:39–50. doi:10.1177/002224378101800104
60. Taan S, Hajjar EL. Statistical analysis: internal-consistency reliability and construct validity. Int J Quantitat Qualitat Res Method. 2018;6:46–57.
61. Schober P, Schwarte LA, Schwarte LA. Correlation coefficients: appropriate use and interpretation. Anesth Analg. 2018;126(5):1763–1768. doi:10.1213/ANE.0000000000002864
62. Stone AA, Broderick JE, Kaell AT. Single momentary assessments are not reliable outcomes for clinical trials. Contemp Clin Trials. 2010;31:466–472. doi:10.1016/j.cct.2010.05.006
63. Baker R, Camosso-Stefinovic J, Gillies C, et al. Tailored interventions to address determinants of practice. Cochrane Database Syst Rev. 2015;2015(4). doi:10.1002/14651858.CD005470.pub3
64. Costa E, Pecorelli S, Giardini A, et al. Interventional tools to improve medication adherence: review of literature. Patient Prefer Adherence. 2015;9:1303–1314. doi:10.2147/PPA.S87551
 © 2026 The Author(s). This work is published and licensed by Dove Medical Press Limited. The
full terms of this license are available at https://www.dovepress.com/terms
and incorporate the Creative Commons Attribution
- Non Commercial (unported, 4.0) License.
By accessing the work you hereby accept the Terms. Non-commercial uses of the work are permitted
without any further permission from Dove Medical Press Limited, provided the work is properly
attributed. For permission for commercial use of this work, please see paragraphs 4.2 and 5 of our Terms.
© 2026 The Author(s). This work is published and licensed by Dove Medical Press Limited. The
full terms of this license are available at https://www.dovepress.com/terms
and incorporate the Creative Commons Attribution
- Non Commercial (unported, 4.0) License.
By accessing the work you hereby accept the Terms. Non-commercial uses of the work are permitted
without any further permission from Dove Medical Press Limited, provided the work is properly
attributed. For permission for commercial use of this work, please see paragraphs 4.2 and 5 of our Terms.
Recommended articles
Barriers Associated with Adherence to Cervical Cancer Screening Among Women Living with HIV in Nkhatabay District, Malawi: A Mixed-Methods Study
Baluwa PC, Moyo RC, Baluwa MA, Nyirenda L
International Journal of Women's Health 2024, 16:491-507
Published Date: 20 March 2024
Revolution or Empty Promise? A 6- and 12-Month Follow-Up to an RCT of the Online Exercise Program PERMANENTO in Older Adults
Machacova K, Polanska H, Steffl M, Bartova A, Novotna B, Holmerova I
Clinical Interventions in Aging 2025, 20:1519-1535
Published Date: 9 September 2025
Integrating Positive Outcomes into Healthcare: Validation of the Pleasurable Affect Levels Scale
Long P, Ritschl V, Stamm T
Patient Preference and Adherence 2026, 20:594759
Published Date: 8 June 2026