Back to Journals » Clinical Epidemiology » Volume 17
SEPLINE: Socioeconomic Position in Epidemiological Research—A National Guideline on Danish Registry Data
Authors Hjorth CF ![]() , Kjærulff TM, Thomsen MK
, Kjærulff TM, Thomsen MK ![]() , Cronin-Fenton D
, Cronin-Fenton D ![]() , Dalton SO
, Dalton SO ![]() , Olsen MH
, Olsen MH ![]()
Received 24 February 2025
Accepted for publication 28 May 2025
Published 4 July 2025 Volume 2025:17 Pages 593—624
DOI https://doi.org/10.2147/CLEP.S520772
Checked for plagiarism Yes
Review by Single anonymous peer review
Peer reviewer comments 3
Editor who approved publication: Dr Thomas Ahern
Cathrine F Hjorth,1 Thora M Kjærulff,2 Mette K Thomsen,1,3 Deirdre Cronin-Fenton,1 Susanne O Dalton,4– 6 Maja H Olsen,4 The SEPLINE Group includes:Anne Dahl Sørensen, Cathrine F. Hjorth, Danni Chen, Deirdre Cronin Fenton, Eeva-Liisa Røssell Johansen, Emma Neble Larsen, Frederik Nicolai Foldager, Gitte Valentin, Henrik Bøggild, Henrik Toft Sørensen, Henry Jensen, Ingelise Andersen, Jan Wohlfahrt, Jarl Christian Quitzau, Julie A. Schmidt, Kirubakaran Balasubramaniam, Lars Børty Nielsen, Lau Caspar Thygesen, Linda Ejlskov, Line Virgilsen, Maja Halgren Olsen, Marie Mørk Josiasen, Merete Osler, Mette Bender, Mette Kielsholm Thomsen, Michael Green, Nasrin Tayyari, Nynne Bech Utoft, Oleguer Plana-Ripoll, Peter Haastrup, Peter Vedsted, Pia Kjær Kristensen, Susanne Oksbjerg Dalton, Susanne Fogh Jørgensen, Søren Korsgaard Martiny, Thomas Maribo, Thomas Wolff Rosenqvist, Thora Majlund Kjærulff, Tinne Laurberg, Trine Allerslev Horsbøl, Ulla Arthur Hvidtfeldt, Ulrik Deding On behalf of the SEPLINE Group
PhD student, Research Unit for General Practice, Aarhus, Denmark, and Department of Public Health, Aarhus University, Denmark; Postdoc, Department of Clinical Epidemiology, Department of Clinical Medicine, Aarhus University and Aarhus University Hospital, Denmark; PhD Student, Department of Clinical Epidemiology, Department of Clinical Medicine, Aarhus University and Aarhus University Hospital, Denmark; Professor, Department of Clinical Epidemiology, Department of Clinical Medicine, Aarhus University and Aarhus University Hospital, Denmark; Postdoc, Department of Public Health, Aarhus University and Steno Diabetes Center Aarhus, Denmark; PhD Student, Cancer Survivorship, Danish Cancer Institute, Denmark; PhD Student, Department of Orthopedic Surgery, Aarhus University & Aarhus University Hospital, Denmark; Researcher, DEFACTUM, Central Denmark Region, Denmark; Associate Professor, Public Health and Epidemiology, Department of Health Science and Technology, Aalborg University, Gistrup, Denmark & Research Data and Biostatistics, Aalborg University Hospital, Denmark; Department of Clinical Epidemiology, Department of Clinical Medicine, Aarhus University and Aarhus University Hospital, Denmark; Epidemiologist, The Danish Healthcare Quality Institute (DHQI), Denmark; Associate Professor, Section of Social Medicine, Department of Public Health, University of Copenhagen, Denmark; Chief Epidemiologist, Cancer Epidemiology and Surveillance, Danish Cancer Institute & Department of Clinical Medicine, Aalborg University, Denmark; Chief Advisor, Statistics Denmark, Denmark; Postdoc, Department of Clinical Epidemiology, Department of Clinical Medicine, Aarhus University and Aarhus University Hospital, Denmark; Associate Professor, Research Unit of General Practice, University of Southern Denmark, Denmark; Assistant Professor, Center for Clinical Data Science, Aalborg University Hospital and Aalborg University, Denmark; Professor, National Institute of Public Health, University of Southern Denmark, Denmark; Assistant professor, Department of Clinical Epidemiology, Department of Clinical Medicine, Aarhus University and Aarhus University Hospital, Denmark; Senior Researcher, Research Unit for General Practice, Aarhus, Denmark; Postdoc, Cancer Survivorship, Danish Cancer Institute, Denmark; Department of Public Health, Aarhus University, Denmark; Professor, Center for Clinical Research and Prevention, Bispebjerg and Frederiksberg Hospitals and Section of Epidemiology, University of Copenhagen, Denmark; Assistant Professor, Section of Social Medicine, University of Copenhagen, Denmark; Postdoc, Department of Clinical Epidemiology, Department of Clinical Medicine, Aarhus University and Aarhus University Hospital & CASTLE – Cancer Survivorship and Treatment Late Effects, Department of Oncology, Copenhagen University Hospital, Rigshospitalet, Denmark; Department of Obstetrics and Gynecology, Duke University School of Medicine, US; Researcher and Assistant Professor, DEFACTUM, Central Denmark Region and Aalborg University, Denmark; PhD Student, Department of Clinical Epidemiology, Department of Clinical Medicine, Aarhus University and Aarhus University Hospital, Denmark; Professor, Department of Clinical Epidemiology, Department of Clinical Medicine, Aarhus University and Aarhus University Hospital, Denmark & National Centre for Register-based Research, Department of Public Health, Aarhus University, Denmark; Associate Professor, Research Unit of General Practice, University of Southern Denmark, Denmark; Professor, Research Unit for General Practice, Aarhus and Medical Diagnostic Center, University Clinic for Innovative Patient Pathways, Department of Clinical Medicine, Aarhus University, Denmark; Associate Professor, Department of Orthopedic Surgery, Aarhus University and Aarhus University Hospital, Denmark; Professor, Cancer Survivorship, Danish Cancer Institute & Danish Research Center for Equality in Cancer (COMPAS), Department of Clinical Oncology and Palliative Care, Zealand University Hospital & Institute of Clinical Medicine, Faculty of Health, Copenhagen University, Denmark; Assistant Professor, Research Unit for Screening and Epidemiology, Department of Biochemistry and Immunology, Lillebaelt Hospital and Department of Regional Health Research, University of Southern Denmark, Denmark; PhD Student, Department of Clinical Epidemiology, Department of Clinical Medicine, Aarhus University and Aarhus University Hospital, Denmark; Professor, Department of Public Health, Aarhus University and DEFACTUM, Central Denmark Region, Denmark; PhD student, Center for Clinical Research and Prevention, Bispebjerg and Frederiksberg, Denmark; Postdoc, National Institute of Public Health, University of Southern Denmark, Denmark; Associate Professor, Steno Diabetes Center Aarhus, Denmark; Associate Professor, National Institute of Public Health, University of Southern Denmark, Denmark; Senior Scientist, Work, Environment and Cancer, Danish Cancer Institute, Denmark; Postdoc, Epidemiologist, Department of Surgery, Odense University Hospital, & Department of Clinical Research, University of Southern Denmark, Denmark; 1Department of Clinical Epidemiology, Department of Clinical Medicine, Aarhus University and Aarhus University Hospital, Aarhus, Denmark; 2National Institute of Public Health, University of Southern Denmark, Odense, Denmark; 3CASTLE – Cancer Survivorship and Treatment Late Effects, Department of Oncology, Copenhagen University Hospital, Rigshospitalet, Copenhagen, Denmark; 4Cancer Survivorship, Danish Cancer Institute, Copenhagen, Denmark; 5Department of Clinical Oncology and Palliative Care, Zealand University Hospital, Næstved, Denmark; 6Institute of Clinical Medicine, Faculty of Health, Copenhagen University, Copenhagen, Denmark
Correspondence: Cathrine F Hjorth, Email [email protected] Maja H Olsen, Email [email protected]
Background: Socioeconomic differences in health have become an increasing public health concern and priority, leading to a growing number of studies investigating the relationship between socioeconomic position and health outcomes. However, variability in methodological practices hampers the comparability of findings and leads to inefficiencies, as researchers invest substantial resources in selecting appropriate variables and methods. To address these challenges, the SEPLINE initiative was established to develop a methodological guideline aimed at enhancing the comparability, quality, and feasibility of socioeconomic research using Danish registry data.
Methods: The guideline was developed through a consensus-driven approach involving an interdisciplinary group of stakeholders from Danish universities, research institutions, and data warehouses. The guideline addresses socioeconomic position as an exposure based on data from Danish registries, with the cancer continuum applied as a case outcome to illustrate its application. The development process included two collaborative workshops informed by a pre-workshop questionnaire. Workshop I (spring 2024) focused on socioeconomic indicators, data collection, and data management, featuring expert presentations and group discussions. Workshop II (fall 2024) addressed analytical methods, including causal inference challenges and income/wealth assessment methods. Insights from these workshops were integrated into iterative refinements of the guideline.
Conclusions and Implications: The guideline provides a structured framework for conducting socioeconomic epidemiological research using Danish registry data, offering specific information on data sources and recommendations about variable selection, measurement timing, and data handling. While tailored to Danish registry-based cancer research, the guideline’s methodological principles have broader applicability to other diseases and international contexts. By emphasizing transparency, theoretical grounding, and methodological rigor, SEPLINE aims to advance the study of social determinants of health. Researchers are encouraged to use the guideline as a relevant starting point and adapt it to their specific study populations and research questions, ensuring its relevance across diverse settings.
Keywords: socioeconomic position, social epidemiology, methodology, social determinants of health, socioeconomic inequality, disparity, guideline, registry-based research
Corrigendum for this paper has been published.
Introduction
Over the past decades, addressing socioeconomic differences in health has gained growing scientific, clinical, and political attention, increasing the demand for studies investigating the impact of socioeconomic position on health outcomes. The complexity of the field has led to the application of varying methods for data collection, data management, categorization, and analyses of socioeconomic indicators, which limits the comparability of results. The choice of method is often determined by local traditions and data accessibility but is also guided by the specific research question. As information about these processes is often inadequately reported in scientific papers, the reproducibility of findings is compromised. New researchers, in particular, may spend considerable time identifying suitable variables and how to apply them in observational studies.
To improve the comparability, quality, and feasibility of socioeconomic epidemiological research, the SEPLINE initiative was launched in 2024 as a collaborative effort among subject-matter experts from Danish universities and institutions. The primary outcome of this collaboration is the development of this guideline, which offers methodological recommendations and practical guidance for selecting and analyzing socioeconomic indicators from Danish population-based registries. Focusing on socioeconomic position as an exposure, the guideline is tailored to research involving the adult population. While cancer is used as a case example to illustrate key points, the methodological considerations are broadly applicable to research in other diseases and contexts. Developed through a consensus-driven process and grounded in existing evidence, the guideline aims to serve as a starting point for socioeconomic research. As the guideline does not encompass all aspects of this complex research field, researchers should carefully assess whether the suggestions provided are appropriate for their specific research question and study population.
Methods
The guideline is based on data from Danish national registries available at Statistics Denmark as of October 2024.
The Danish Welfare State
Denmark is a welfare state with universal access to education and healthcare for all residents, alongside a comprehensive social security system. The educational system is state-funded and offers free tuition at all levels from primary school to university.1 Education is mandatory for 10 years for children aged about 6–15 years, corresponding to primary and lower secondary education. To further support students, the Danish government provides financial aid through the State Educational Grant and Loan Scheme to cover basic living expenses. Despite these provisions, a strong correlation persists between parental socioeconomic factors and the highest educational level attained, indicating ongoing barriers regarding social mobility.2 The Danish social security system seeks to reduce poverty and improve economic equality through income redistribution and social benefit programs, including unemployment benefits, child allowances, housing subsidies, sick leave compensations, and pensions. Though income inequality, as measured by the GINI coefficient, has increased in Denmark since the late 1980s, Denmark is among the Organisation for Economic Co-operation and Development (OECD) countries with the lowest level of income inequality and poverty.3 Most healthcare services are provided with no out-of-pocket payments, including general practitioner visits, hospital care, certain vaccinations, cancer screening programs, and rehabilitation. Other services are only partially subsidized and require co-payment, eg, adult dental care, prescription medication, eye exams, physiotherapy, chiropractors, and psychologists. While the public healthcare system remains the dominant provider, the use and provision of private health services and private health insurance have expanded.1 Despite addressing inequality in health having been a key public health priority for decades, considerable socioeconomic differences in health outcomes and life expectancies persist in Denmark and other nations.4–6
Danish Registry Data
The Danish public system has a long tradition of comprehensive data collection and a unique ability to link data across systems, using a universal personal identification number, called the CPR number.7 Since 1968, all Danish residents have been given a CPR number at birth or residence permit. Information on many life events—including date of birth, immigration, educational attainment, employment and income, marriages and households, retirement, emigration, and death—is systematically registered in national administrative registers. Moreover, medical information is collected in national registers covering healthcare contacts, diagnoses, therapies, drug prescriptions etc.1 All these registries are linkable by the CPR number. The data are primarily collected for administrative purposes; however, Danish research institutions can be permitted to use the data for research under certain conditions. Statistics Denmark is the data holder of national registries that include socioeconomic information, and data extracts for research are accessed in a pseudo-anonymized form on the secure servers of Statistics Denmark. Through their website, Statistics Denmark offers a documentation system describing each variable including data breaches and validity.8 Researchers are encouraged to explore the website along with the information provided in this guideline. A list of the registers referred to in this guideline can be found in Table S1.
Guideline Development
This guideline was developed during two collaborative full-day workshops using a consensus driven approach with broad representation across institutions, geographical regions, seniority levels, and subject-matter expertise. Invitations were sent to research group leaders within the field as well as data-holder consultants from Danish universities and institutions, encouraging representation ranging from junior researchers to senior professors and chief consultants. Open invitations were also distributed via social media and the Danish Comprehensive Cancer Center's website. Participants spanned epidemiologists, sociologists, data consultants, clinicians, data managers, and statisticians. Participation was free of charge and open to researchers and other professionals with an interest in the topic.
Upon registration, participants received a questionnaire on their applied methodological practices, including variable selection, categorization, and data management. The responses revealed substantial variation in the choice of variables, time of measurement, handling of missing values, and categorizations. These findings formed the foundation for a preliminary guideline serving as the focal point for Workshop I. Workshop I, held in spring of 2024, focused on the choice of socioeconomic indicators, data collection, and data management. The workshop included two lectures. Chief Adviser Jarl Christian Quitzau from Statistics Denmark presented an overview of registry-based data sources for socioeconomic indicators and pitfalls in their use. Assistant Professor Linda Ejlskov from Aarhus University presented findings of a study emphasizing the analytical impact of different income measures.9 Building on the preliminary guideline, participants engaged in group discussions to draft concrete recommendations for single indicators. Where multiple—and potentially conflicting—recommendations emerged, all options were documented and systematically compared. The group recommendations were presented and discussed in a plenary session. After the workshop, group notes and plenary feedback were summarized in a revised version of the guideline. This version also included a proposed theoretical model and a new chapter on analytical methods. The updated guideline was circulated to all participants for review ahead of Workshop II. Workshop II, held in fall of 2024, focused on analytical methods. Epidemiologist Michael Green from Duke University gave a lecture on causal inference issues when working with multiple indicators of socioeconomic position. PhD student Søren Korsgaard Martiny from Aarhus University presented methodological considerations on rank-based income and wealth assessments. Participants then worked in groups to refine the theoretical model and continued building upon the work initiated in Workshop I. Outcomes from group discussions were again presented in plenum, with the aim of reaching consensus. In cases where consensus could not be reached—particularly when methodological choices were context-dependent—alternative approaches were included in the guideline, with their respective advantages and disadvantages clearly described. Before publication, the revised guideline was circulated for several rounds of review, ensuring that all SEPLINE group members endorsed the final content.
Socioeconomic Determinants of Health
Several public health theories describe how health is shaped by the social and structural conditions in which individuals are born, live, grow, work, and age. During the 19th century, with the foundation of social medicine, the lack of education, poverty, housing and working conditions were argued to be key determinants of health.10–12 Since then research has demonstrated a systematic socioeconomic gradient in health, with lower socioeconomic position being associated with poorer health outcomes at every level of this gradient. Concurrently, frameworks on the social determinants of health evolved to encompass distal and upstream societal mechanisms and emphasize the dynamic interplay between structural, contextual, and individual-level factors.10–17
In line with many current social epidemiological theories, the theoretical approach used in this guideline employs a life course perspective. This approach asserts that societal, contextual, and individual factors interact throughout life and shape different socioeconomic conditions (Figure 1). These conditions encompass both resource-based stratifying mechanisms in a society, such as material and social resources, and prestige-based mechanisms, such as occupational prestige. Socioeconomic position is a conceptualization of these conditions and refers to an individual’s or group’s social and economic position within the structure of society.10
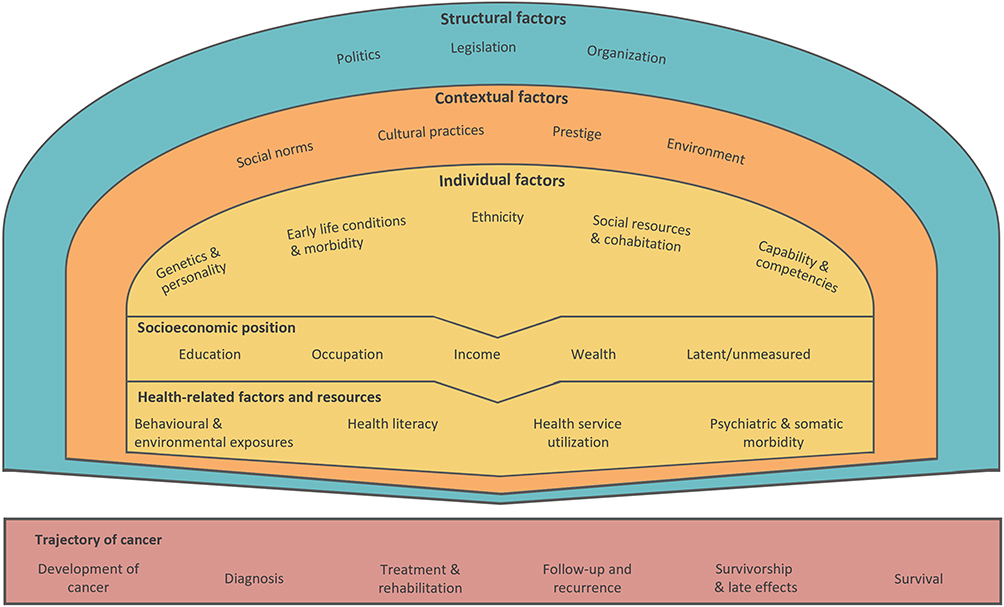 |
Figure 1 Theoretical model of the relationship between structural, contextual, and individual factors and the trajectory of cancer. Adapted from Olsen MH, Kjær TK, Dalton SO, Danish Cancer Society Research Center. Social Inequality in Cancer in Denmark: White Paper. Danish Cancer Society; 2023.18 |
- Structural factors include politics, legislation, and organization such as health policies, redistributive policies, housing policies, and structures of the educational system and healthcare system.
- Contextual factors encompass social norms, cultural practices and prestige, as well as the broader social, economic, and physical environment of our neighborhoods. These factors include—but are not limited to—access to and quality of education and healthcare.
- Individual factors include genetics and personality, early life conditions and morbidity, ethnicity, social support and resources, and capability and competencies, such as familial socioeconomic circumstances, social networks, and cognitive skills.
As illustrated in Figure 1, structural, contextual, and individual factors shape an individual’s socioeconomic position and influence different health-related factors and resources to navigate the society and healthcare system. It is through the combined interaction of these factors that the socioeconomic differences in, for example, cancer outcomes, are believed to arise.18,19 For instance, the design of healthcare initiatives, such as national screening programs, cancer treatments, or follow-up care, may interact with an individuals’ socioeconomic position or health resources, contributing to socioeconomic differences in timely diagnosis, treatment adherence, and ultimately cancer survival.18
Measures of Socioeconomic Position
Socioeconomic position is a latent and multifaceted construct that cannot be measured by a single indicator. Instead, it is approximated through various indicators that serve as proxies for overlapping, yet distinct dimensions of socioeconomic position. This guideline encompasses educational level, labor market affiliation or occupation, income, and wealth, alongside closely related sociodemographic factors such as marital or cohabitation status, ethnicity, and area-level characteristics. Though these indicators are correlated, each captures unique aspects of an individual’s socioeconomic position at different stages of life and potentially has differential effects on health.15,20 Figure 2 illustrates some of these multi-dimensionalities, which can develop over the life course. The non-overlapping areas of the circles illustrate the unique contributions of each indicator, while the overlapping areas represent shared effects and a core dimension of socioeconomic position.20 For example, as educational level is correlated with later income level, observed health effects from income may be influenced by and share effects with education. Yet, the educational level may to a larger degree reflect knowledge and cultural resources, whereas income and wealth are more directly associated with the availability of economic resources.
 |
Figure 2 The multidimensionality of indicators of socioeconomic position. Adapted from Green MJ, Popham F. Interpreting mutual adjustment for multiple indicators of socioeconomic position without committing mutual adjustment fallacies. BMC Public Health. 2019;19(1):19. Creative Commons.20 |
Given the unique aspects of each indicator, they are not interchangeable proxies for socioeconomic position. The choice of specific indicators should, therefore, be carefully aligned with the research question. Moreover, investigating different socioeconomic indicators and their interactions may elucidate the complex, multidimensional nature of socioeconomic position, and its influence on health outcomes. Such an approach may provide valuable insights to guide public health strategies and interventions. This guideline covers information about the selected individual socioeconomic indicators. For some settings, it may be meaningful to combine these individual indicators into a composite measure or socioeconomic index to reflect the multidimensionality of socioeconomic position, however, such approaches are not addressed in this guideline. Note that for all socioeconomic indicators, individuals with missing values may constitute a vulnerable group. Hence, it is recommended to explore this subpopulation separately in relation to the outcome.
Education
Educational attainment is considered a comprehensive indicator of socioeconomic position, which may encompass both individual-level factors and reflect the familial, contextual, and structural conditions in which one is raised. Individual-level factors include early cognitive development and abilities, physical and mental health status, intellectual capacity, motivation to learn, and personal interests and values. Familial conditions include the educational level, economic resources, living standard, and parental health or household, as well as the level of cognitive stimuli and support in early life and adolescence. Contextual and structural conditions include the quality and availability of learning environments, accessibility and structure of secondary and higher educational institutions, as well as social norms, expectations, and prestige.15,21 In regard to studies of health, the educational attainment and the abilities learned under education, are related to the level of health literacy, which encompasses the ability to understand, evaluate, and act upon health information, communicate and actively engage with healthcare professionals, and navigate in the healthcare system.22,23 Education is often defined as the highest attained (ie, completed) level of education. Although an individual’s educational level is typically attained in early adulthood, the educational level may influence future job opportunities and income level, and, therefore, also reflect aspects of these factors, such as available economic resources.15,21
Data Source and Variables
Different data sources are available to determine educational attainment, including registers on completed education programs and a longitudinal registry of ongoing activities (Table 1). The age at index date can help determine the most appropriate data sources and variables. As eg, a higher proportion of individuals below the age of 30 are still under education, it may be more appropriate for these age groups to use information from the student registry covering ongoing education (Figure S1), ie the KOTRE registry or the parental educational level.
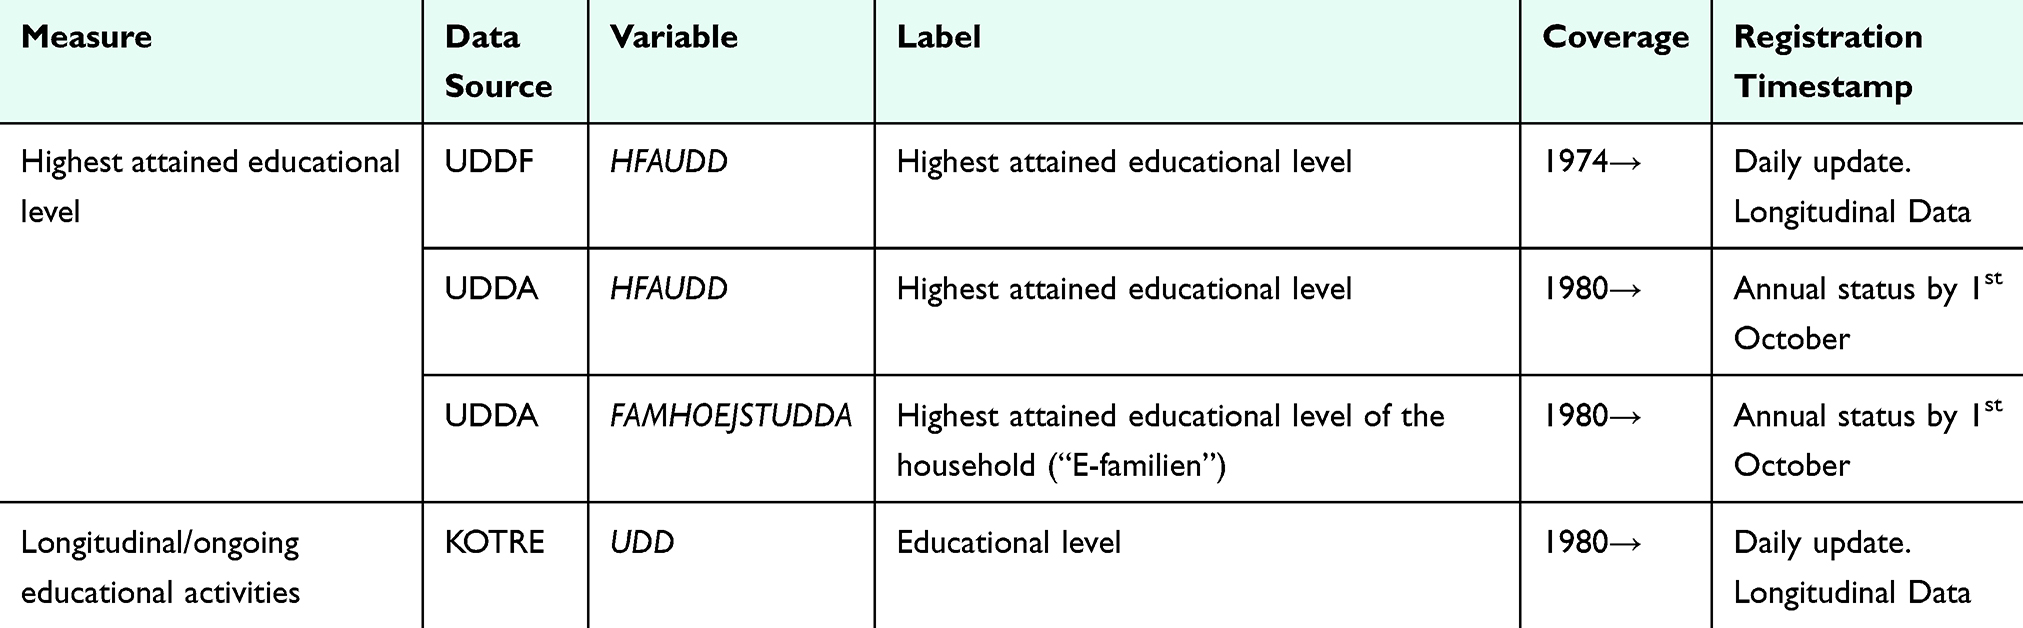 |
Table 1 Data Sources for Educational Level in the Danish Registries |
In Denmark, information on education has been systematically registered in student authorization registries since 1974 and maintained by Statistics Denmark.24 For some individuals, the educational data comes from other sources, as indicated by the variable HF_KILDE. Information on education attained prior to 1974 derives from the qualification registry and from a census conducted in 1970 based on self-reported information (HF_KILDE= 2). For immigrants, the available information on education can be self-reported from surveys (HF_KILDE= 3, 17) or imputed by Statistics Denmark (HF_KILDE= 9, 10, 18). Before 2018, the information came from surveys conducted in 1999, 2006, and 2016. Since 2018, information on education completed outside Denmark by individuals who have immigrated within the past year has been collected through The Immigrant Survey annually. This data is obtained from Danish language courses and the Danish Agency for Labor Market and Recruitment. However, since these sources do not cover all immigrants, Statistics Denmark supplements the data by sending a questionnaire each December via digital post to those for whom information is unavailable. For non-respondents, educational attainment is imputed. This imputation is based on population data from the past four years of surveys. Background variables from other registries are incorporated, and observations with unknown educational levels are imputed using a random forest algorithm. Therefore, the imputed data should be used with caution. Its limitations and uncertainties are more pronounced at the individual level, whereas aggregated data is generally reliable because errors in the imputed data are likely to be balanced out at the group average. Therefore, when analyzing the educational level across larger population groups—such as comparing entire municipalities or individuals in and out of the labor market—the imputed data remains useful. However, analyses involving individual-level education data are less reliable. In such cases, it may be advisable to exclude the imputed data altogether or analyze them separately (Table 2). Detailed information about the education imputation models is available in Table S2.
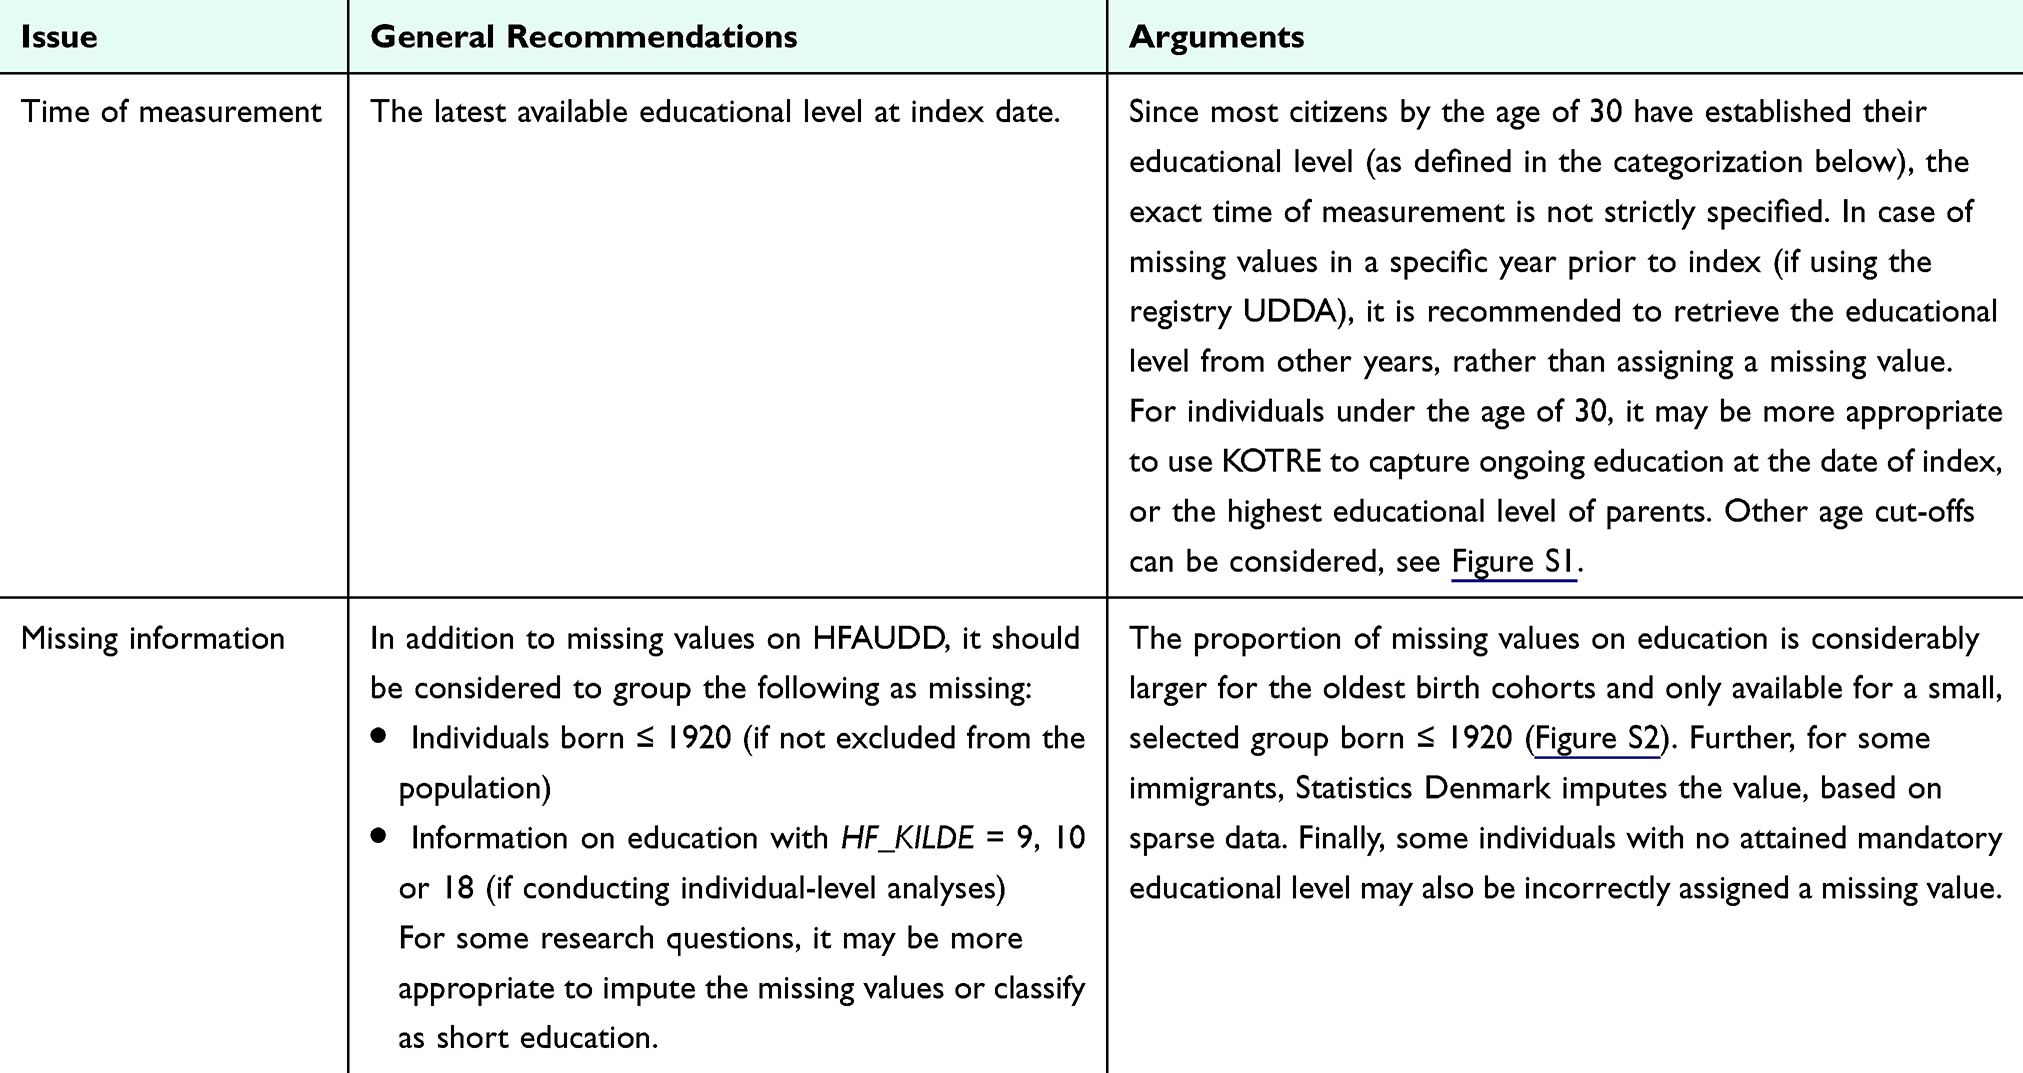 |
Table 2 Data Management of Educational Data |
The highest attained educational level (HFAUDD) variable can be formatted by using formats available in the secure servers of Statistics Denmark. Each year, the format is updated with codes for new educational programs and corrections, eg, if a specific education program has changed level. There are large differences in categorization depending on which format you choose. The format most suitable for the Danish population is provided in Table 3.
Categorization
The categorization suggested in Table 3 is aligned with international classifications from the International Standard Classification of Education (ISCED) and OECD, enabling global comparisons.25 Depending on the study’s statistical power, it may be informative to treat missing values as a separate category, as this group could provide valuable insights. If the statistical power is insufficient, a complete-case analysis can be applied instead. The choice of categorization may consider that the length of education has different meanings for different birth cohorts. In 1972, compulsory education was extended from 7 to 9 years for students in 7th grade in 1971/72 and onwards, typically those born ≥1958. However, students born before 1958 increasingly attended voluntary 8th to 10th grades. In 1975, a unified school system was introduced, and a selective type of middle school (In Danish: “Realskolen”) was abolished. This educational program covered grades 6th to 10th for students who met specific grade requirements and prepared the students for careers or higher secondary education. Depending on the study population and research question, researchers may consider assigning these individuals a medium instead of short education. The last group completed the program (In Danish: “Realeksamen”) in the summer of 1978.
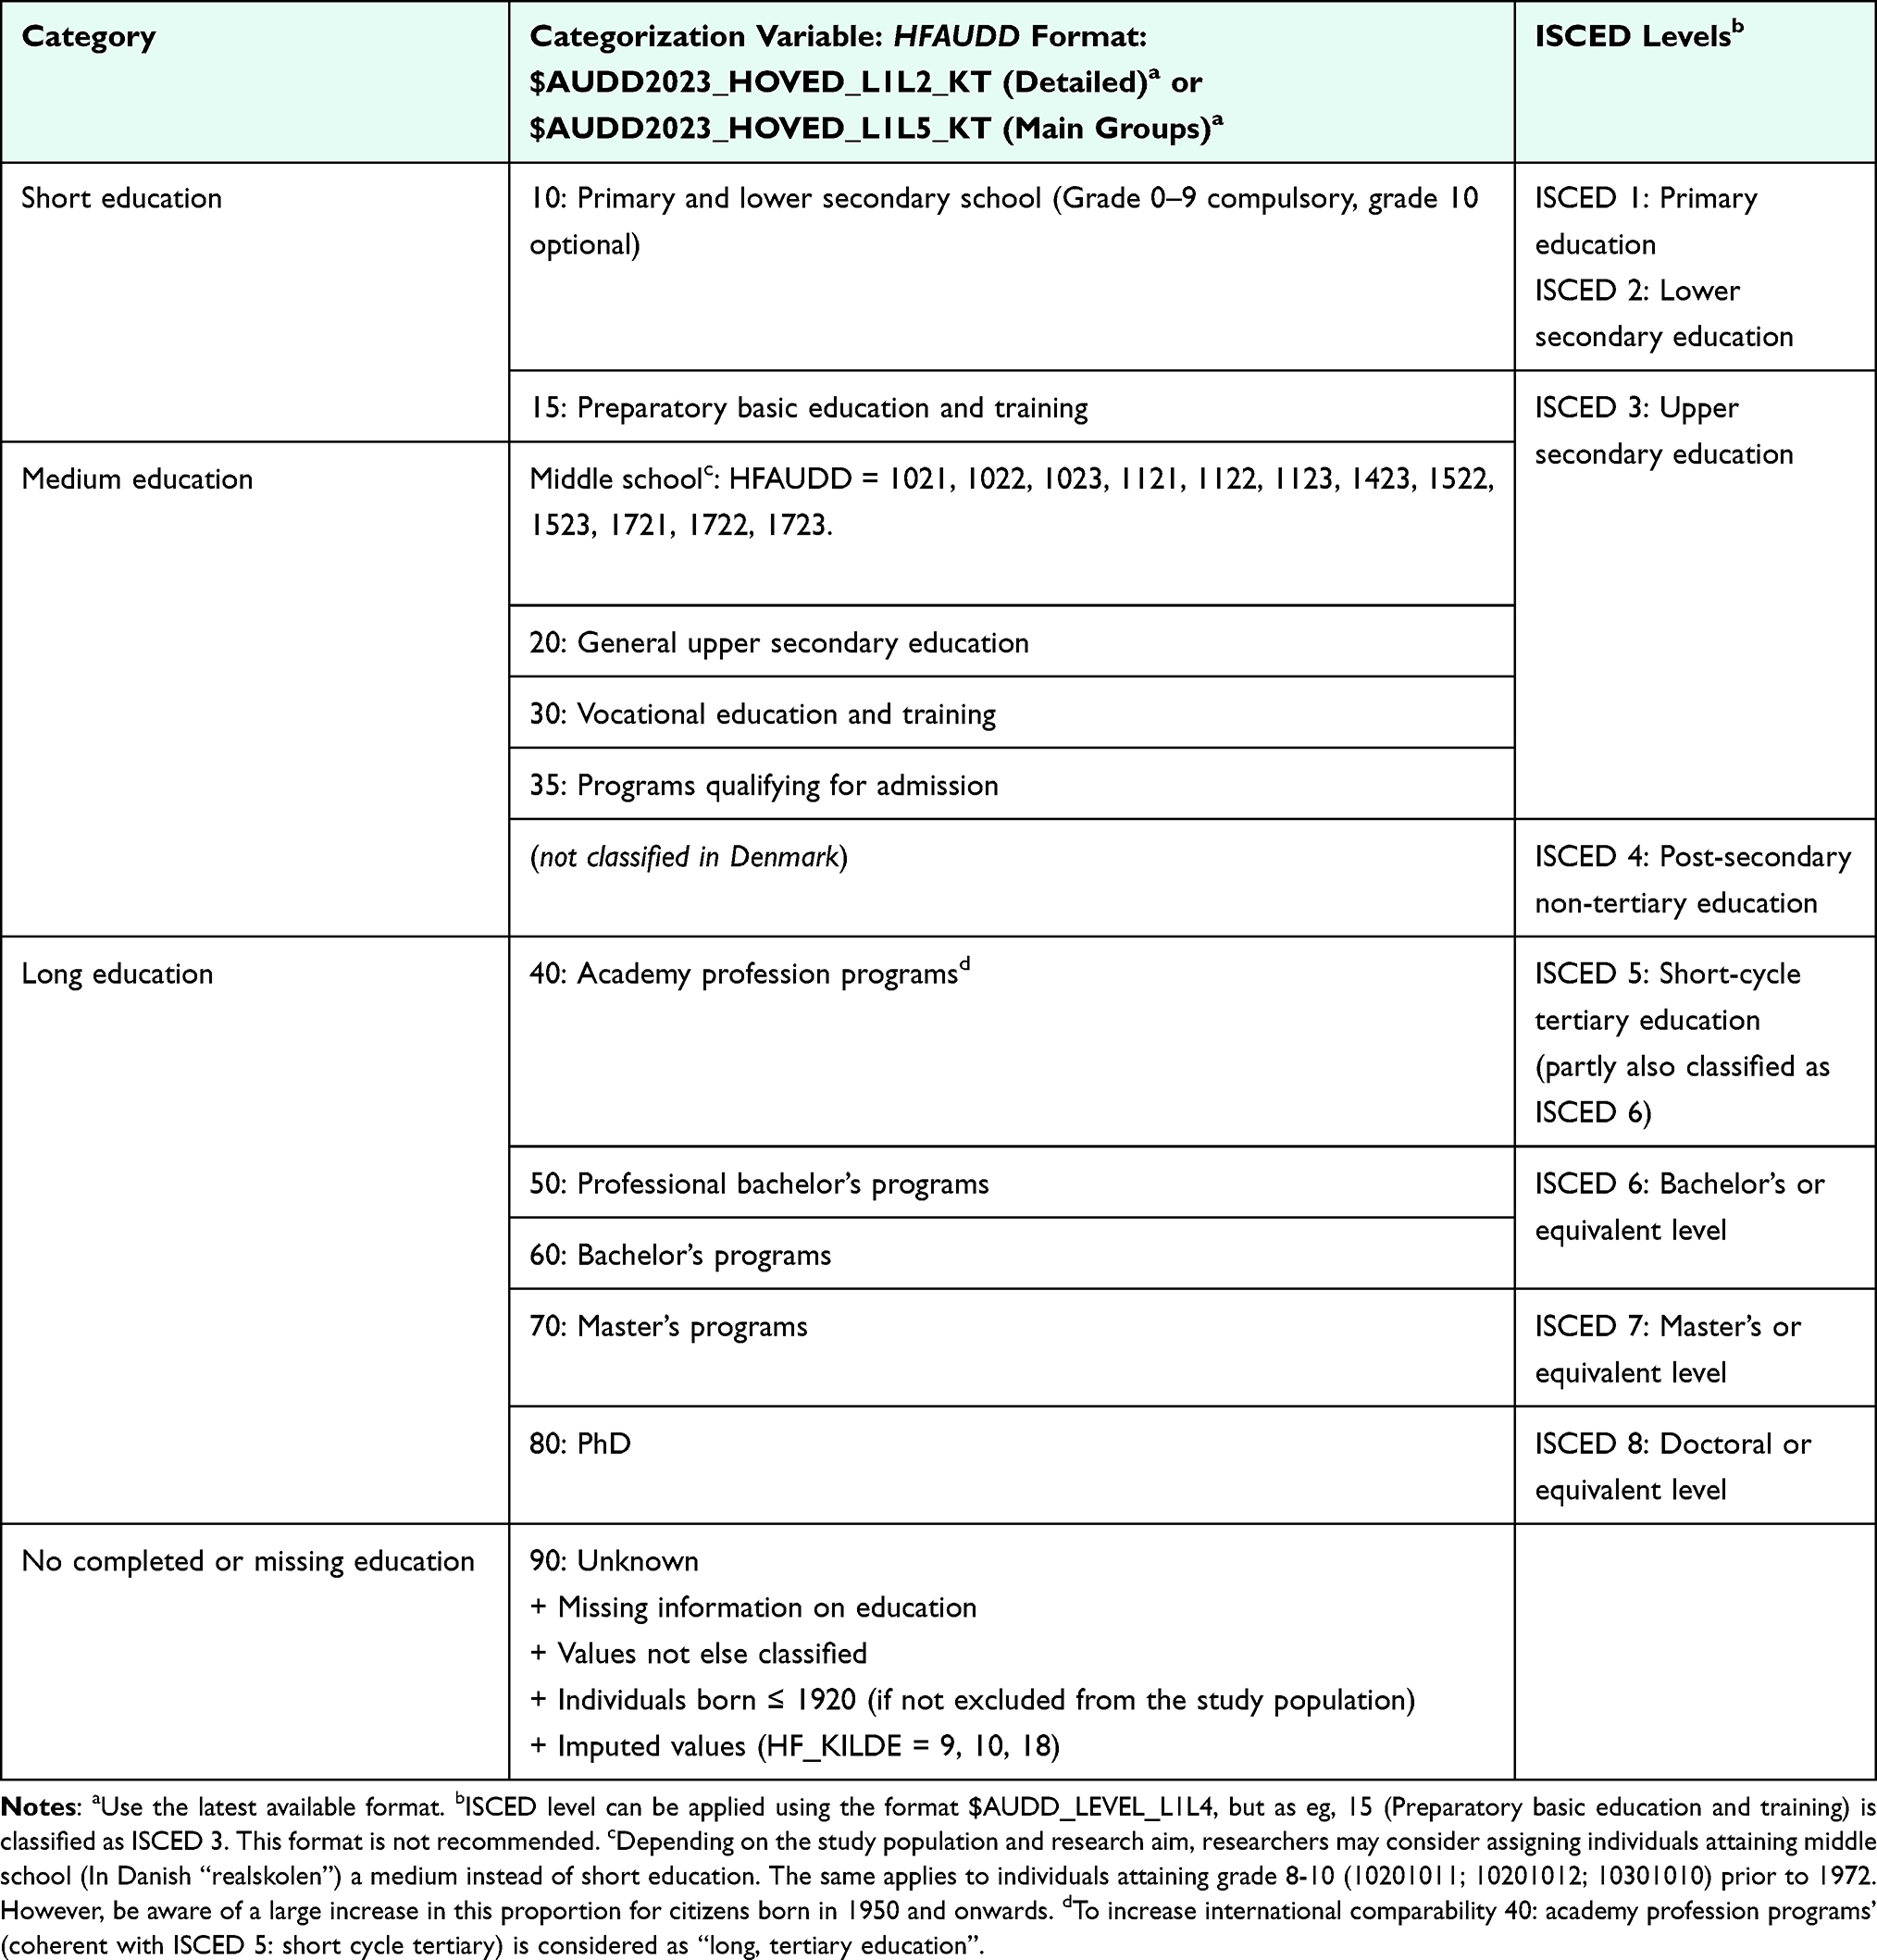 |
Table 3 Categorization of Educational Level Using Danish Registry Data |
Attention Points
Causality Issues
- Educational level can be influenced by early life health, sex, ethnicity, parental socioeconomic position, and possibly cohabitation/parenthood status. As such, researchers should be aware of both unmeasured confounding, and reverse causality.
Missing Information
- The information on education from the census in 1970 was discarded for individuals aged 50 years and above in 1970 due to poor quality. Education is, therefore, missing for most people born in or before 1920 or available for a highly selected group only (Figure S2).
- In 2018, 51% of the adult population with missing information on education were immigrants. Be aware of the source of which the information is collected and consider whether imputed values should be excluded.
- There is a data gap with missing information on education attained between 1970 (census information) and 1974 (start of student authorization registries) (Figure S2).
Inaccuracy and Misclassification
- By 31st December 2018, available information on the highest attained educational level was self-reported for 22% of the adult population (18% from the census in 1970 and 3.8% from surveys among immigrants). The proportion increases by decreasing birth year.26 Compared to information obtained from registries, the self-reported information may be less precise.24
- Education attained outside Denmark is not systematically registered.
- The educational level is not necessarily proportional to income levels, eg, some blue-collar workers have a higher income than certain groups of academics (Figure S3).
- Besides primary education, most educations either qualify for further schooling or prepare for a specific profession. However, some educations, eg, some introductory courses, do not provide qualifications. Information about the attained qualifying level for each educational level can be found in the variable KOMP, as 1=qualifying general education, 3=vocational education and 7=higher education. Non-qualifying education and eg, privately paid education courses are not registered.
Birth Cohort/Life Course Aspects
- The educational level in the population has increased notably over time, and the length of education may have different meanings for different birth cohorts (Figure S4).
- For some education programs, their level has changed over time. For example, the educational level for nurses has changed from short further education (category 40) to medium further education (category 50). For this reason, it is recommended to use the latest accessible format at Statistics Denmark.
- For younger cohorts, it might be appropriate to differentiate between the non-qualifying and qualifying educations. General upper secondary education (category 20) often requires further education to qualify for employment, while vocational education and training programs (category 30) are designed to directly prepare students for the labor market.
Labor Market Affiliation and Occupation
This chapter offers guidance on measuring labor market affiliation and occupation type, helping researchers assess the relevance of each indicator to their specific research questions. Labor market affiliation provides insights into an individual’s social and economic standing, reflecting income and job stability, access to resources, and social networks. It reflects the dynamic interplay between work, economic resources, and social structures, making it a crucial factor in understanding social determinants of health, social mobility, and policy impacts.
Compared to education, labor market affiliation is more sensitive to economic cycles, making it particularly useful for identifying vulnerable socioeconomic groups. Labor market affiliation indicates one’s engagement with income-generating activities, including employment status and job stability. However, depending on the categorization used, it may not capture socioeconomic differences among the large group of employed individuals. In contrast, occupation type conveys information on education, skill levels, social prestige, and insight into roles and responsibilities, but this is not accurately reflected in registry data, leading to potential misclassification. Additionally, shifts in industry demands may alter the socioeconomic implications of certain occupations over time, and cultural or regional differences in occupational prestige further complicate cross-context comparisons.15,27
Data Sources and Variables
Three main data sources for labor market affiliation are summarized in Table 4.
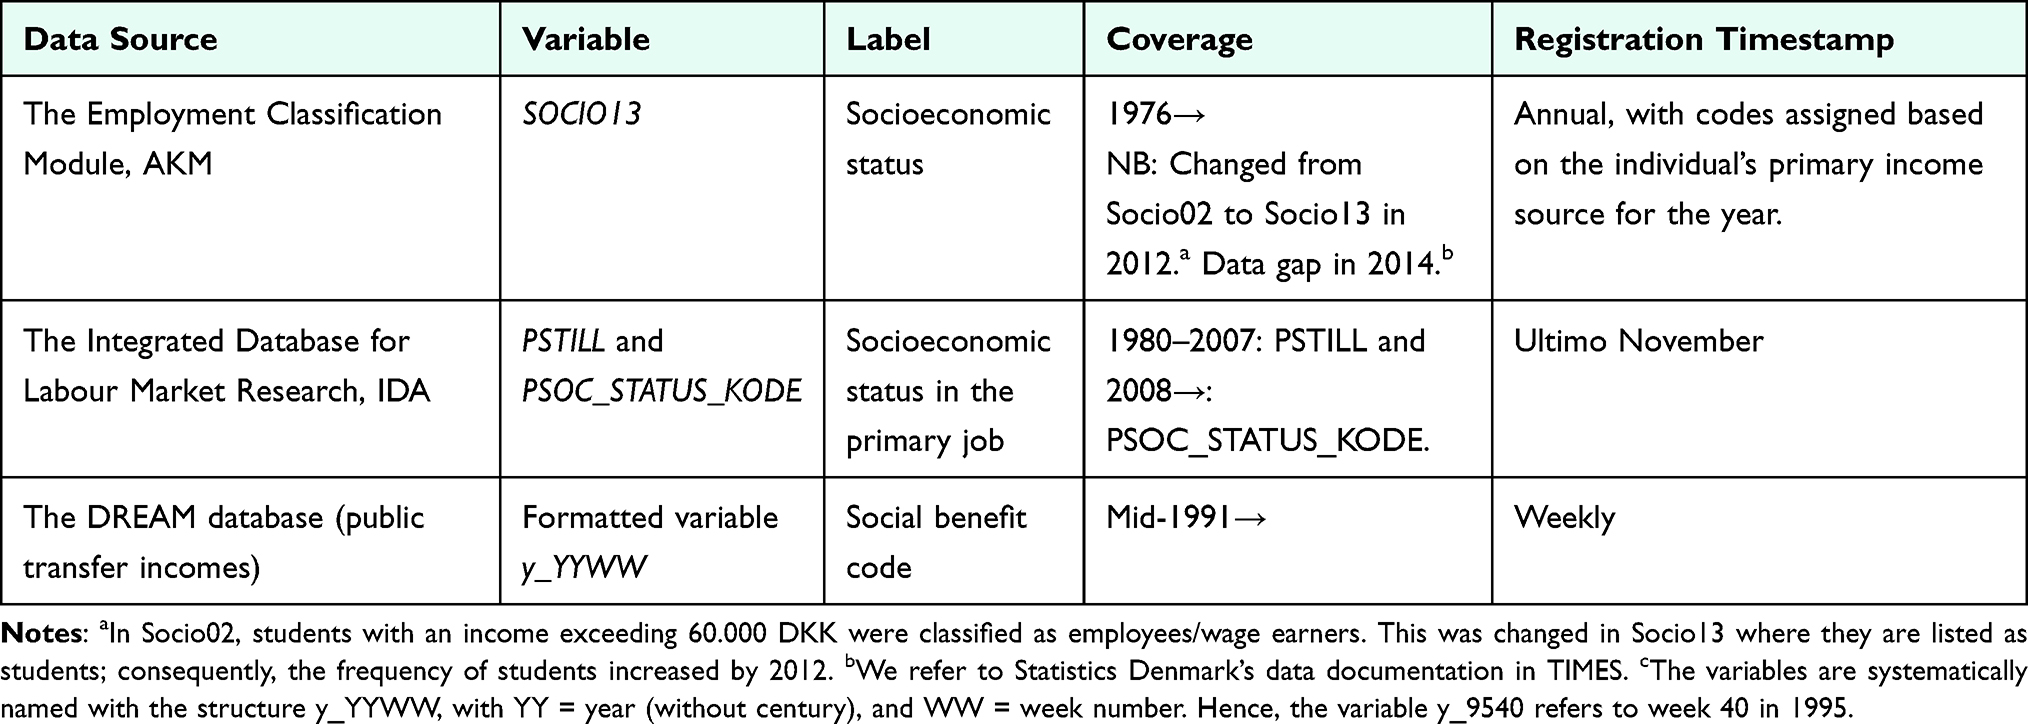 |
Table 4 Data Sources for Labor Market Affiliation and Occupation in the Danish Registries |
The Employment Classification Module (AKM)
In AKM, employed individuals are registered based on their main occupation during a given year, based on the activity that generated the largest amount of income.28 The registry comprises an annual primary activity status (variable: BESKST), occupation type (variable: SOCIO13), and a Danish version of the International Standard Classification of Occupations for the economically active (DISCO). The registry goes back to 1976, with several changes over time, including new criteria for classifying students with part-time jobs as well as adjustments made to how self-employed individuals are categorized. These changes have been applied to historical data, with older classifications phased out from 2014.
The Integrated Database for Labour Market Research (IDA)
IDA registers the labor market affiliation of all Danish residents on 30th November each year, among those residing in Denmark on 1st January the following year. Due to changes in the coding system, two variables may be needed to assess labor market affiliation in the IDA database. Before 2008, the information is collected in the variable PSTILL, which refers to the primary affiliation during the given year. Until 1995 employed individuals are subclassified according to their profession code. From 1996, employed individuals are classified based on their work function in accordance with recommendations from the International Labour Organization and DISCO.28 Since 2008, the information has been collected in the variable PSOC_STATUS_KODE, with different subcategories referring to employment types, unemployment, social assistance groups, etc. Therefore, the variables are not directly comparable.
The Danish Registry for Evaluation of Marginalization (DREAM)
DREAM encompasses all individuals who have received social benefits or other public transfer income, though not benefits related to the Social Services Act.29 From 2008, DREAM also includes monthly employment information, hence also including all employed. The database is longitudinal, with one new variable added per week, with a code indicating the type of benefit received (variable: y_YYMM, where Y=year without century and M=month). The codes can, for instance, indicate if an individual has been unemployed, on leave, in early retirement, on sick leave, on social assistance, enrolled in eligible student education, or in job activation. DREAM also monitors transitions to receiving a state retirement pension, emigration from Denmark, and deaths occurring before reaching the state retirement pension age. If the variable is empty for a given week, it indicates that the individual neither received any benefits during that time nor matched any other specified codes (referred to as “empty”). This will in the following be used to indicate that the individual was working or self-supporting. Be aware that this assumption may lead to misclassification, particularly for young individuals who are supported by their parents or are not entitled to unemployment benefits. To address this issue, linking salary or income data can help verify employment status. Starting in 2008, the variable Branche_YYYY_MM can be used to verify whether weeks with no recorded code (“empty”) are due to employment.
Weekly benefit information is generated whenever an individual has received a benefit for at least one day. However, only one type of weekly benefit can be recorded, necessitating automatic prioritization in cases of overlapping data. For example, unemployment benefits take precedence over social assistance, while sick leave benefits take precedence over unemployment benefits.
The choice of data source offers different options for time of measurement (Table 5). Due to the annual nature of AKM and IDA, it is recommended to collect data in the year prior to index, whereas DREAM gives the opportunity to measure labor market affiliation closer to index, eg the week before index. However, this should be done with caution as labor market affiliation may change in the time leading up to index and cause reverse causality issues. Also, DREAM data are sensitive to weekly changes, why some previous studies have categorized according to main status in the 3–12 months leading up to diagnosis.30,31
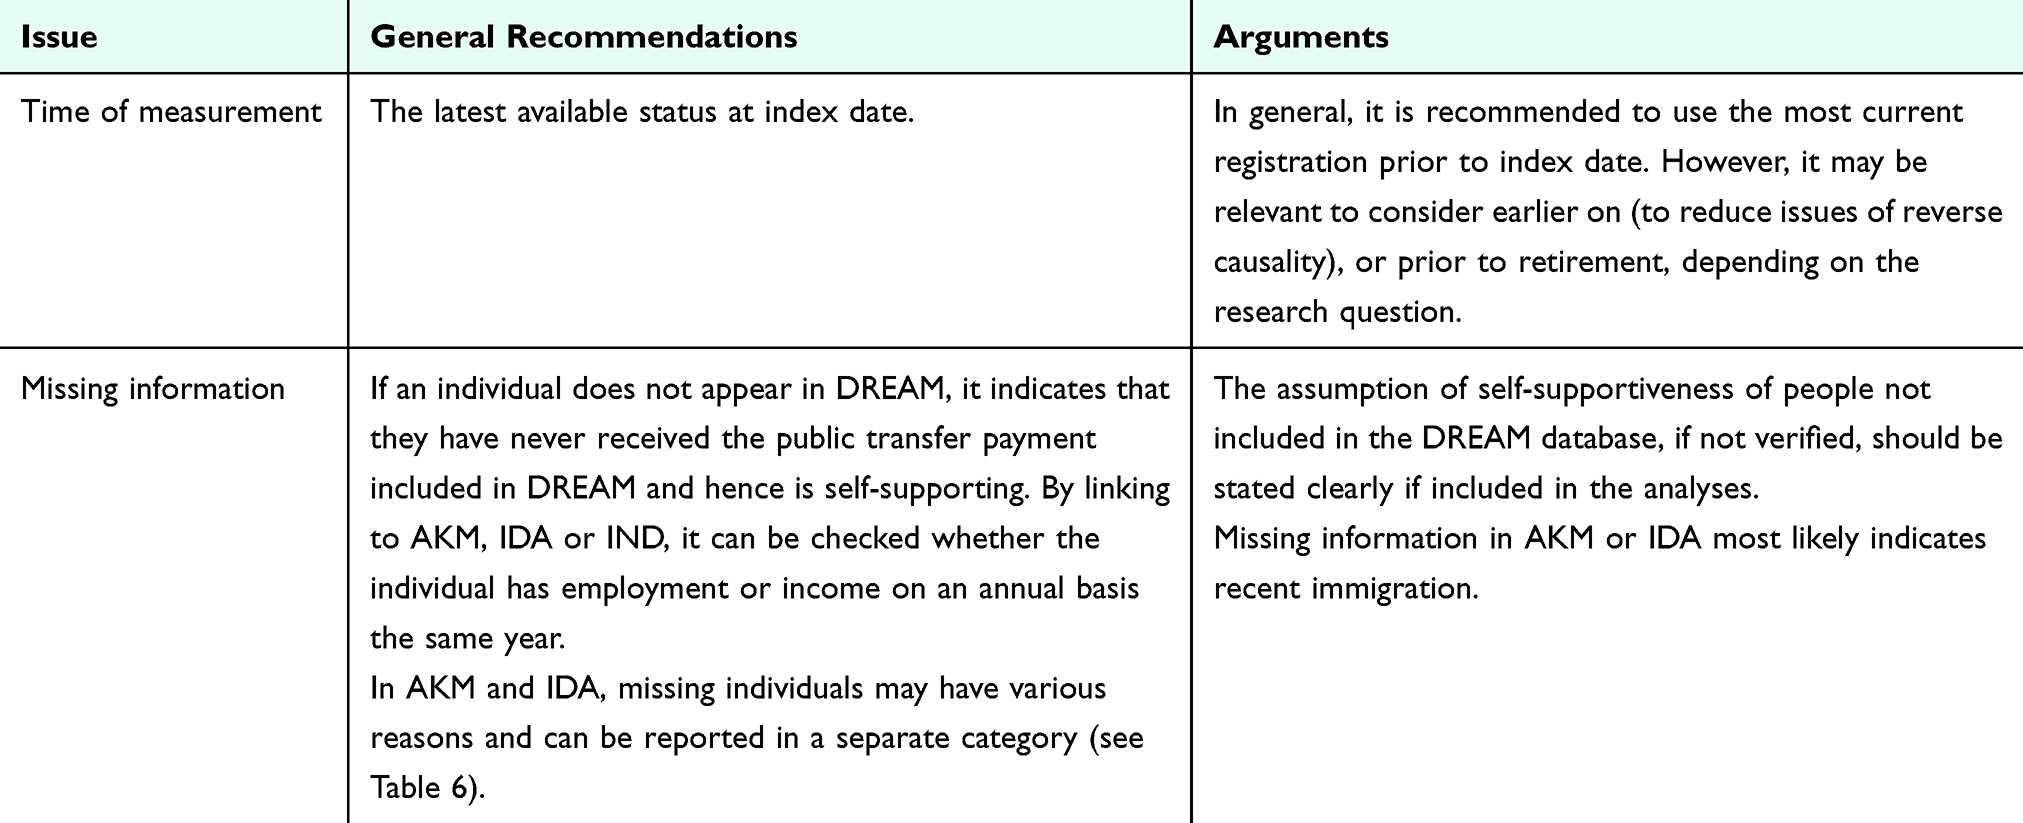 |
Table 5 Data Management of Labor Market Affiliation and Occupation Data |
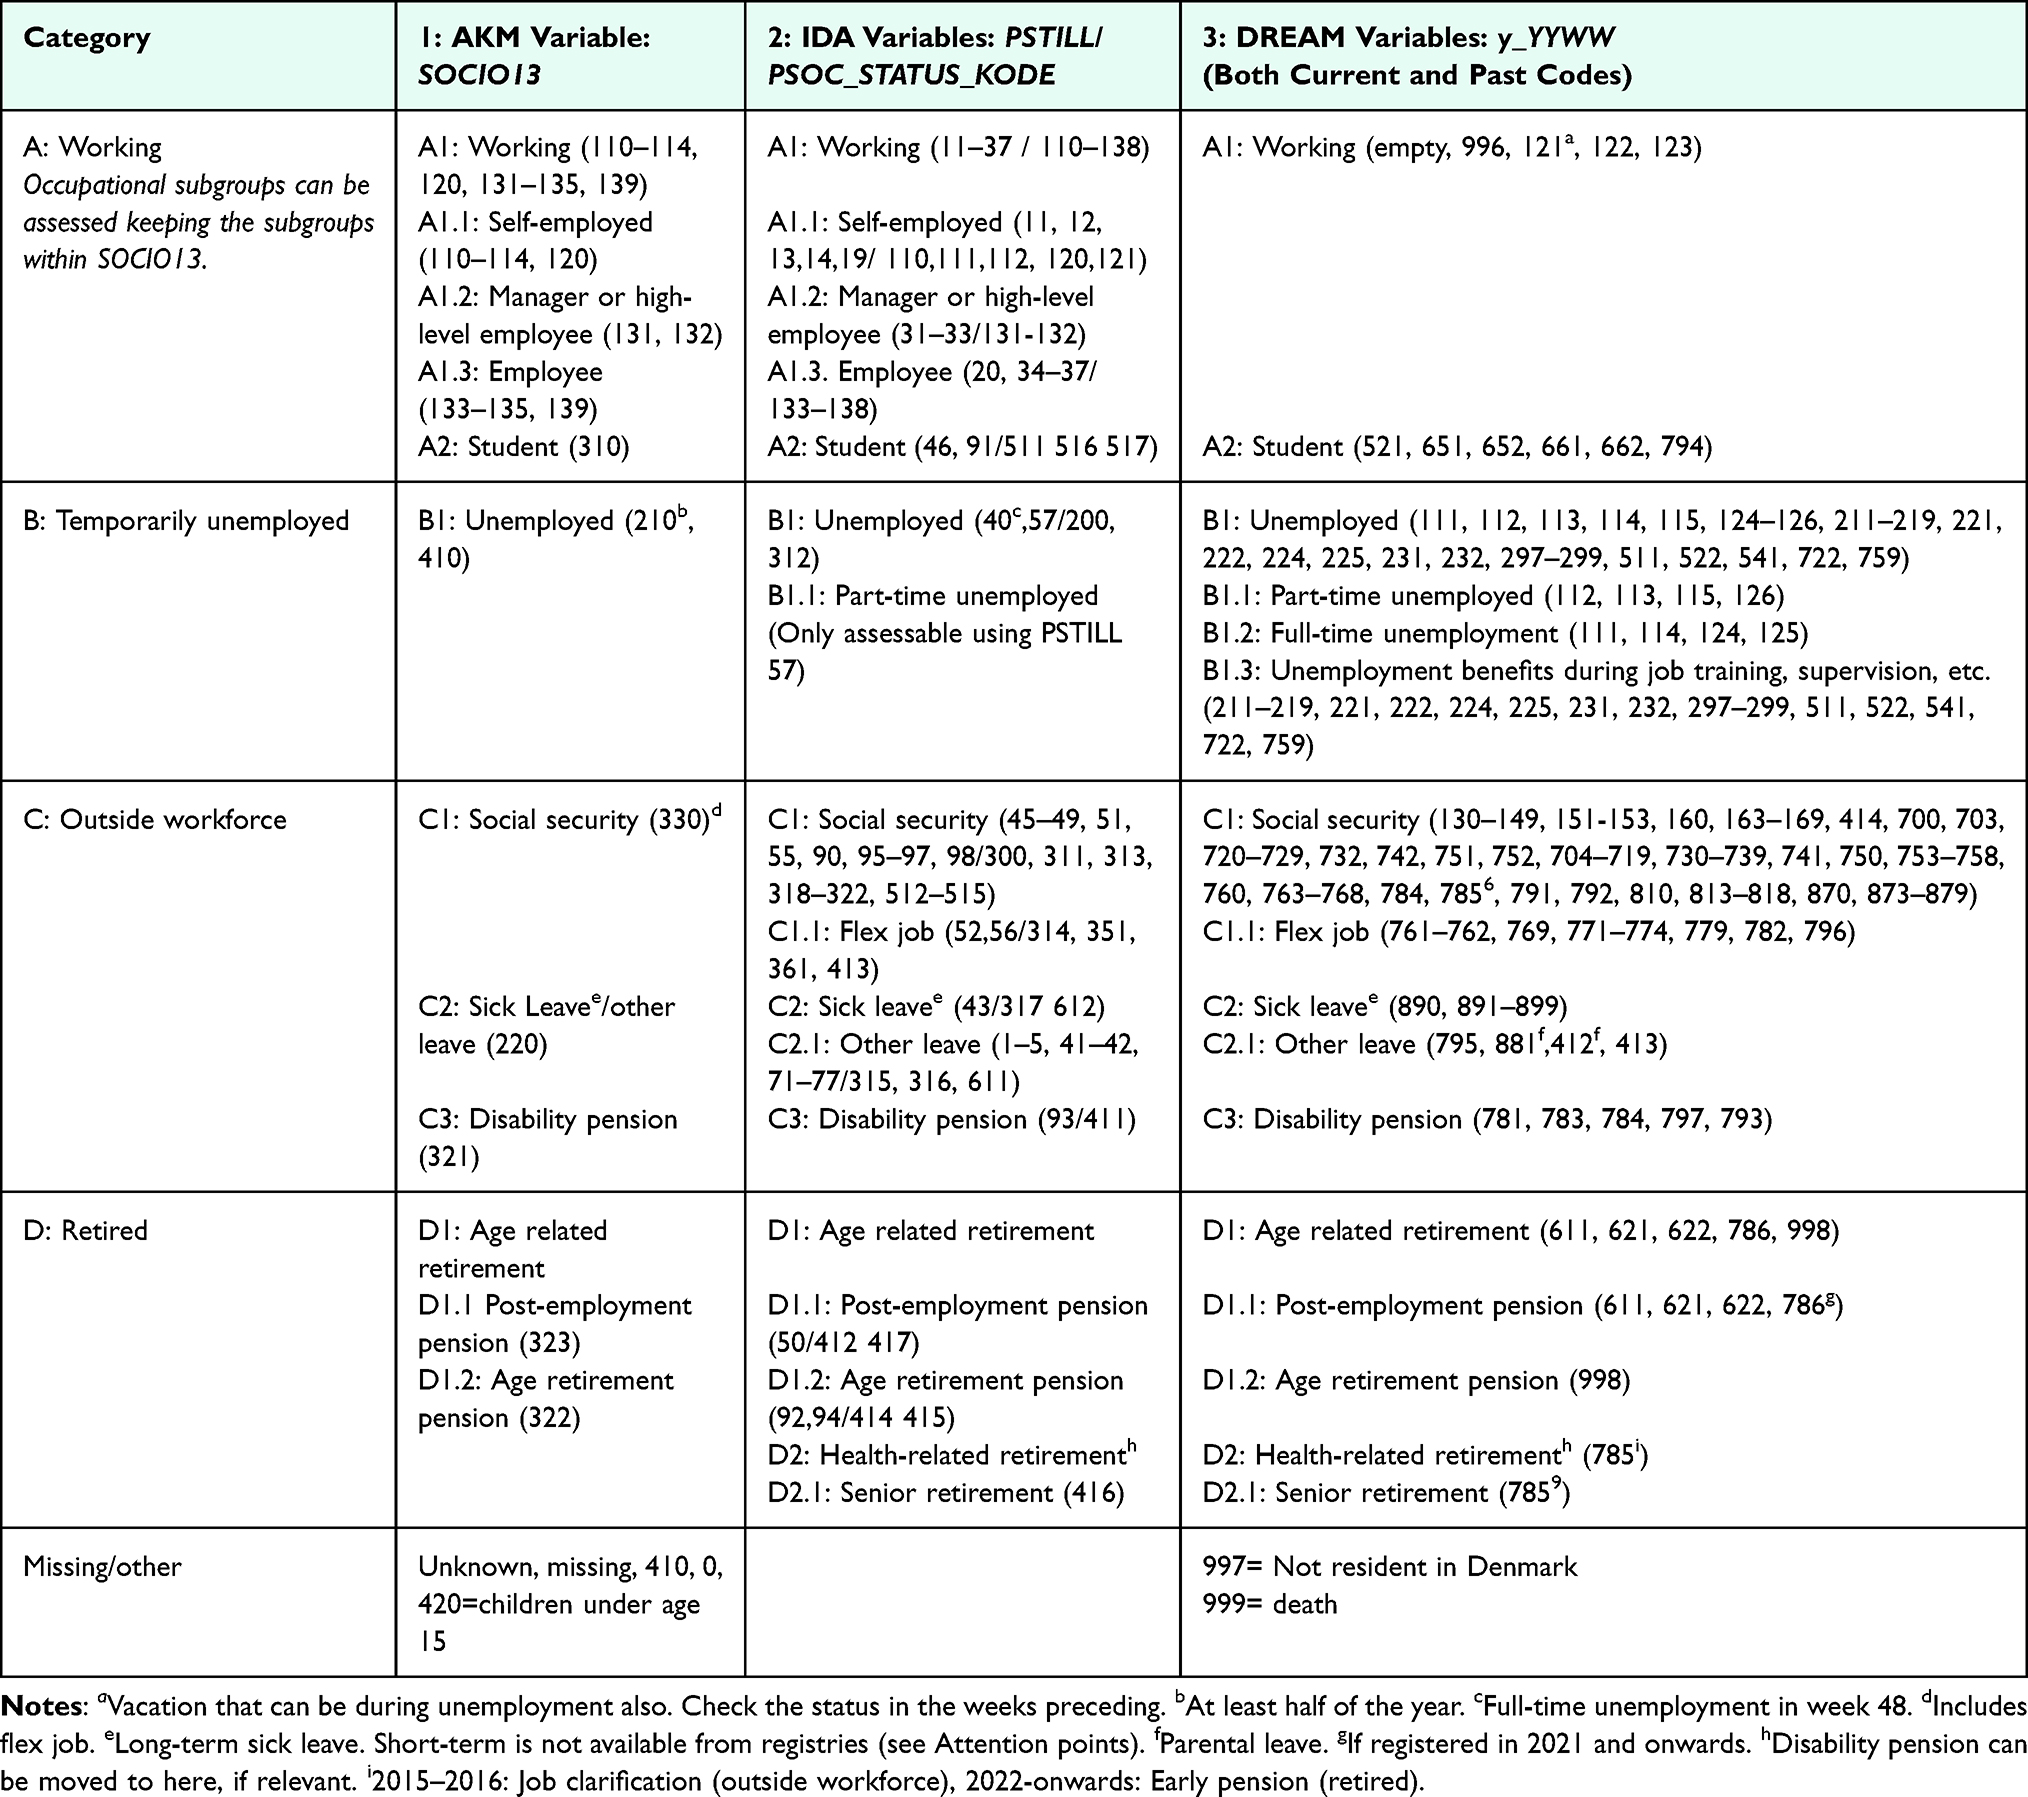 |
Table 6 Categorization of Labor Market Affiliation Using Danish Registry Data |
Categorization
Codes from the data sources are broadly classified into four major labor market affiliation groups, which can be further divided into occupational statuses when using AKM or IDA (Table 6). Note that the validity of the occupation subcodes remains unknown. If interested in more granular groups of occupation within thematic categories (eg, agriculture, health etc.), 1st or 2nd level of the variable DISCO from Statistics Denmark can be used. The labor market affiliation groups provided may not be directly comparable across data sources; eg, in SOCIO13, flex jobs are combined with other social security programs. In contrast, IDA and DREAM classify flex jobs separately, making it possible to categorize them as “working” or “working under special conditions” if relevant for the specific research question. The main groups can be merged into being able-bodied (Category A+B) or not (Category C) among people of working age. However, this may cause some misclassification, as the reasons for labor market detachment are unknown. Other distinctions include participating in the labor market vs not and being self-supporting or on social support. The terminology used in the literature regarding Danish retirement and labor market schemes varies considerably in the literature. The terminology used in the guideline appears from Table S3.
Attention Points
Causality Issues
- Health and diseases may impact the ability to work, leading to potential issues of reverse causality when socioeconomic position is the exposure of interest. This reverse causality will largely depend on the disease, time from onset to diagnosis and treatment, and screening.
Missing Information
- People with missing information in DREAM are likely employed or in other ways self-supported (unless recently immigrated). Some may also be without any income, eg, young people transitioning from school to the labor market.
Inaccuracy and Misclassification
- Labor market affiliation can change frequently, making it difficult to establish a stable measure of socioeconomic position.
- Standard measures of labor market affiliation may poorly capture within-group differences.
- Be aware that short-term (in 2025: <31 days) sick leave is not included in DREAM, as this is covered by the employer. The period of employer-paid sick leave (the period before the employer can receive reimbursement from the municipality) has changed several times, which will influence assessments over time. The periods can be found in Figure S5. When people exceed the employer-paid sick leave period (~ long-term sick leave), DREAM adds the number of weeks corresponding to the employer-paid sick leave, approximating their first day of sick leave.
Birth Cohort/Life Course Aspects
- Labor market conditions can vary widely with shifts in economic cycles (Figure S6), affecting job availability and stability. In this connection, when examining long-term data (decades and longer), it is important to recognize the fact that economic downturns disproportionately impact the most socially vulnerable groups compared to others.32
- The relevance of labor market affiliation may vary significantly at different stages of life, such as early career vs retirement.
- For some research questions, it may be relevant to investigate patterns and the potential multiple shifts in labor market affiliation over a longer period of time, eg, by using sequence analyses.33
Income and Wealth
Income level is a widely used indicator of socioeconomic position, providing insights into the health effects of a broad spectrum of factors related to economic prestige and resources. Differences in accessibility of healthcare services and quality of care have been observed across Danish income groups.34–36 Resource-based factors include housing conditions, exposure to environmental factors, and access to more nutritious food, leisure activities, and private healthcare services.15 Various components of wealth, such as the value of properties, shares, cars, savings, or loans, also impact an individual’s available economic resources and experience of financial stability, which enables the management of unexpected expenses and economic stress. For pensioners, income may not be suitable for capturing economic prestige and resources, and, therefore, wealth may be a more relevant indicator in cohorts of older people.
Data Sources and Variables
For tax registration purposes, income levels are well-documented in Danish registries (Table 7). Various components of total income are accessible, including primary income, public transfer, private pensions, and capital income. In addition, information on taxes, interest expenses, and alimonies are also available for the calculation of net income. Furthermore, to allow for comparisons of disposable income between owners and renters, as well as between households of different sizes, the imputed value of rent for owner-occupied homes and information on the size and income of the household is also available. Finally, real estate, deposits in banks, shares, pensions, and loans are available as indicators of wealth or financial stability. Both personal and household income are assessed on an annual basis and available in Danish Kroner in the Income Statistics Registry. These income values can be converted from Danish Kroner to other currencies, as needed.37
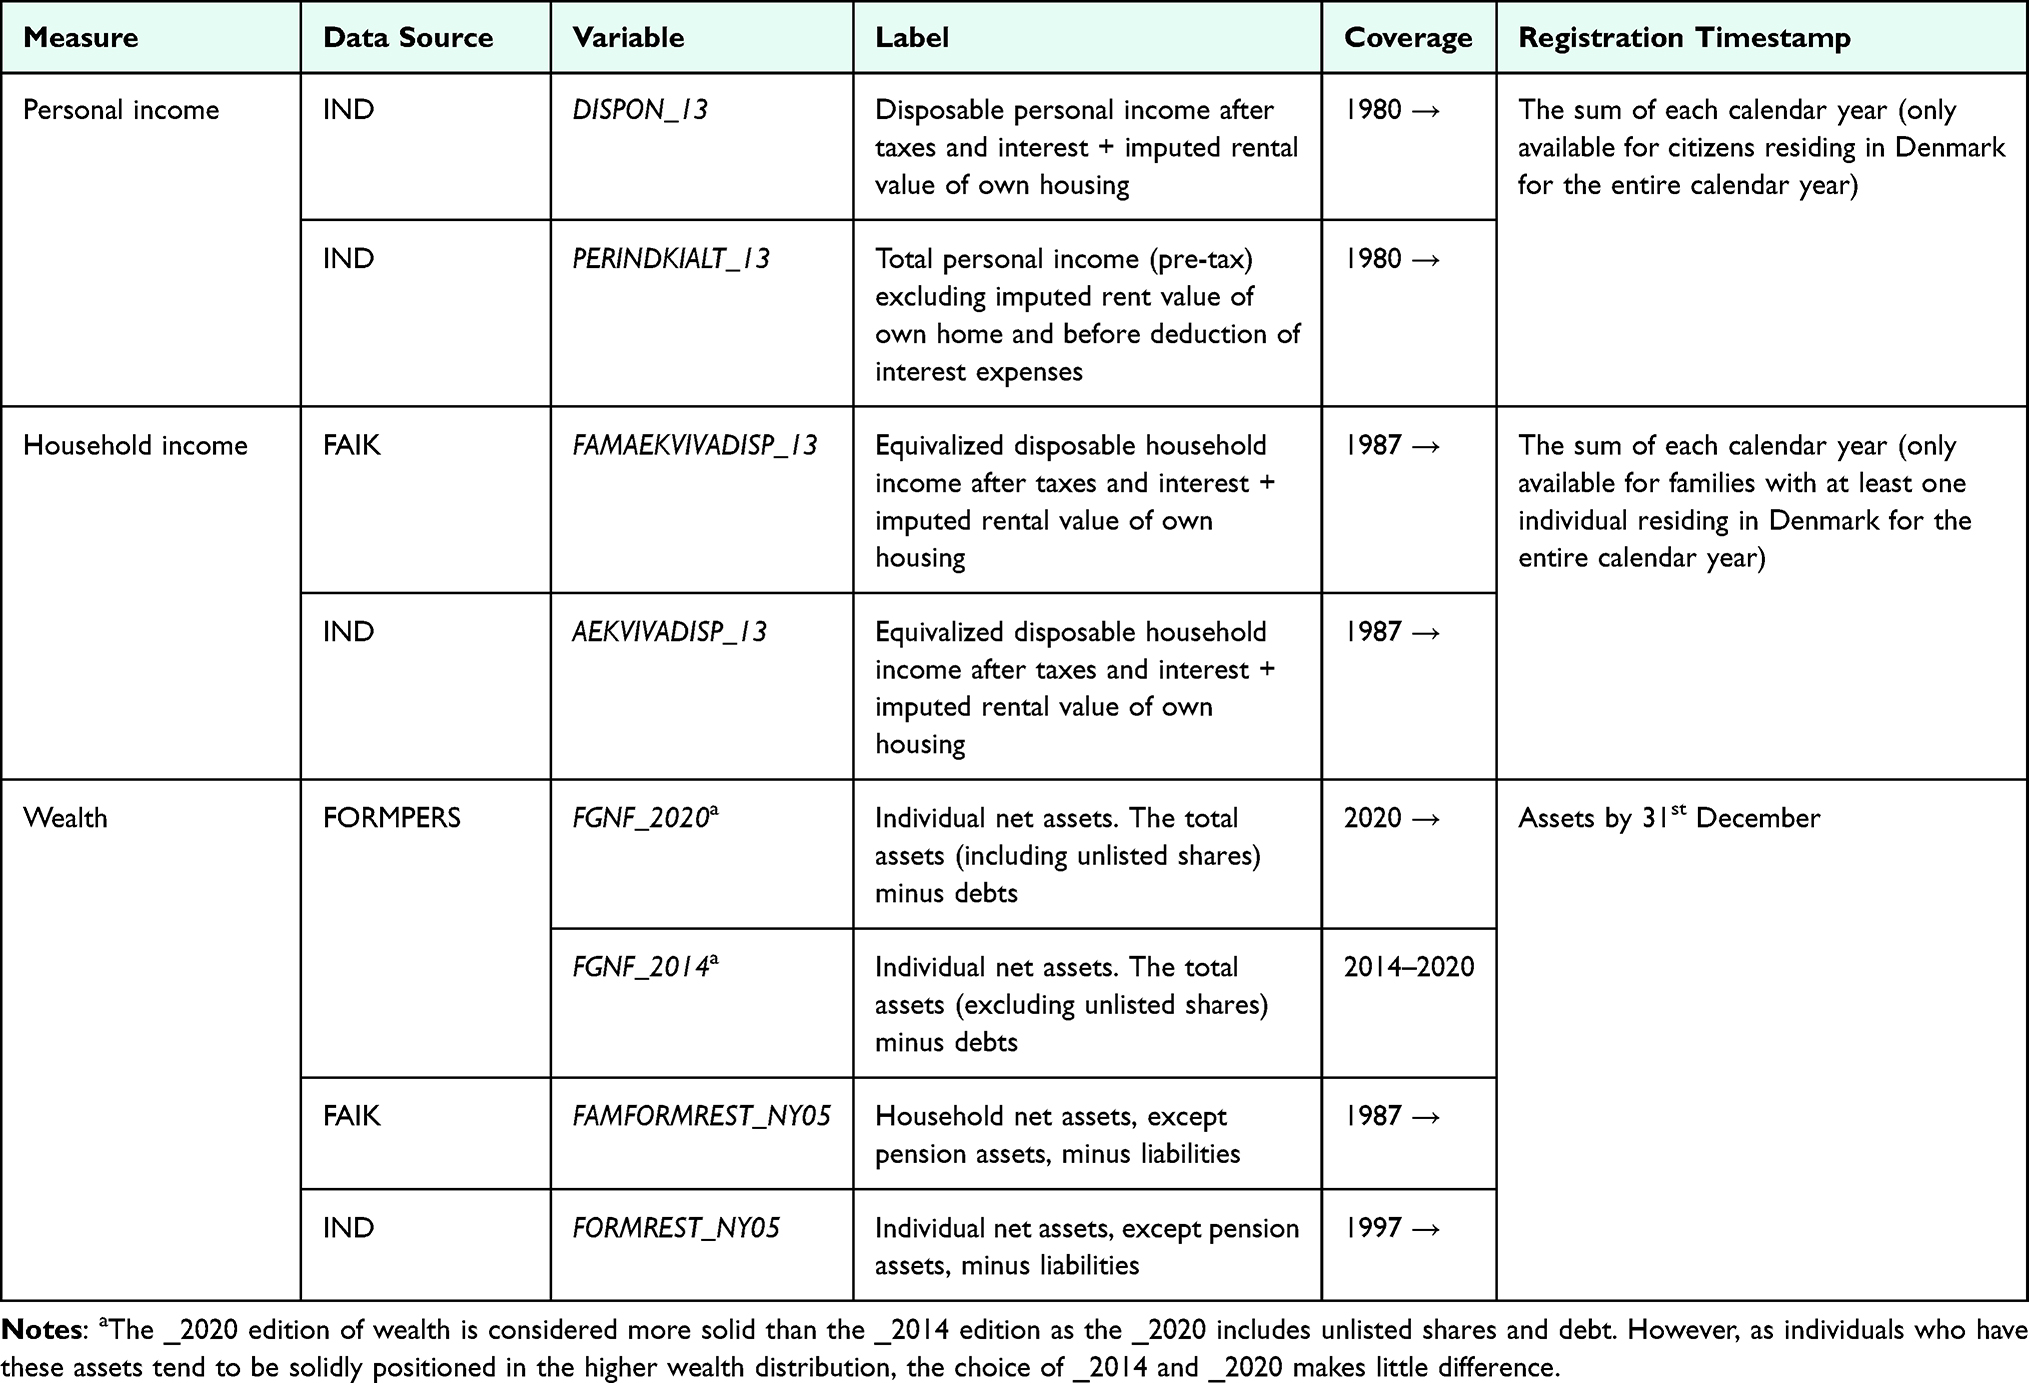 |
Table 7 Data Sources for Income and Wealth in the Danish Registries |
Income
Income is both assessed as individual and household income, as well as total income, and disposable income (income with subtraction of taxes, paid interest and paid alimonies). Further, an equivalized disposable income is provided, for which Statistics Denmark uses the OECD-modified equivalence scale to divide the total household income by its weighted size. The first adult in a household is assigned a weight of one, a second adult a weight of 0.5, and each child a weight of 0.3.38
As default, it is recommended to use equivalized disposable household income (FAMAEKVIVADISP_13 or AEKVIVADISP_13) unless disposable personal income better accommodates the research question. Ejlskov et al9 found a high correlation between individual and household income (both total and disposable income) in males, but not in females. As such, especially in populations including females, household income may be a better indicator of overall accessible financial resources.15 The study also found that disposable and total income were highly correlated (r=0.95).
Total pre-tax personal income may be useful in relation to questionnaire-based research. It is common for researchers to ask respondents about their pre-tax income level. The variable PERINDKIALT_13 (personal income in total) can be used to benchmark against the entire population or specific sub-populations when analyzing the representativeness of a survey population.
Wealth
As an indicator of wealth, using the variables for net assets FAMFORMREST_NY05 (household-level) or FORMREST_NY05 (individual-level) may be considered per default. These measures account for total liquid assets minus liabilities. If the household-level measure is used alongside the equivalized household-level income measure (FAMAEKVIVADISP_13), one should note that the wealth is not yet provided in equalized form in the registers. Therefore, consider manually equalizing the household-level wealth using the modified OECD-modified equivalence scale mentioned above or per adults in the household. If the study period allows the wealth variable FGNF_2020 from the FORMPERS registry should be used, as this variable is less sensitive to problems with public property assessments in the 2010s and 2020s.
In some cases, it may be relevant to look at selected financial assets rather than the net assets. For young people, for example, it may make sense to exclude pension savings because these are often not disposable. This can be done by subtracting pension assets, or by using variables not including pension, see Table S4 for variables.
Some individuals have low income, but high wealth. Therefore, considering both income and wealth may be more appropriate for determining an individual’s economic resources. A combined indicator may potentially be useful and additionally aids in classifying individuals with negative or near-negative income values who possess high wealth. However, the literature currently lacks examples on ways to most appropriately combine income and wealth in epidemiology, but inspiration can be found within mathematical sciences.39 The suggested data management practices for engaging with Danish income and wealth data are included in Table 8.
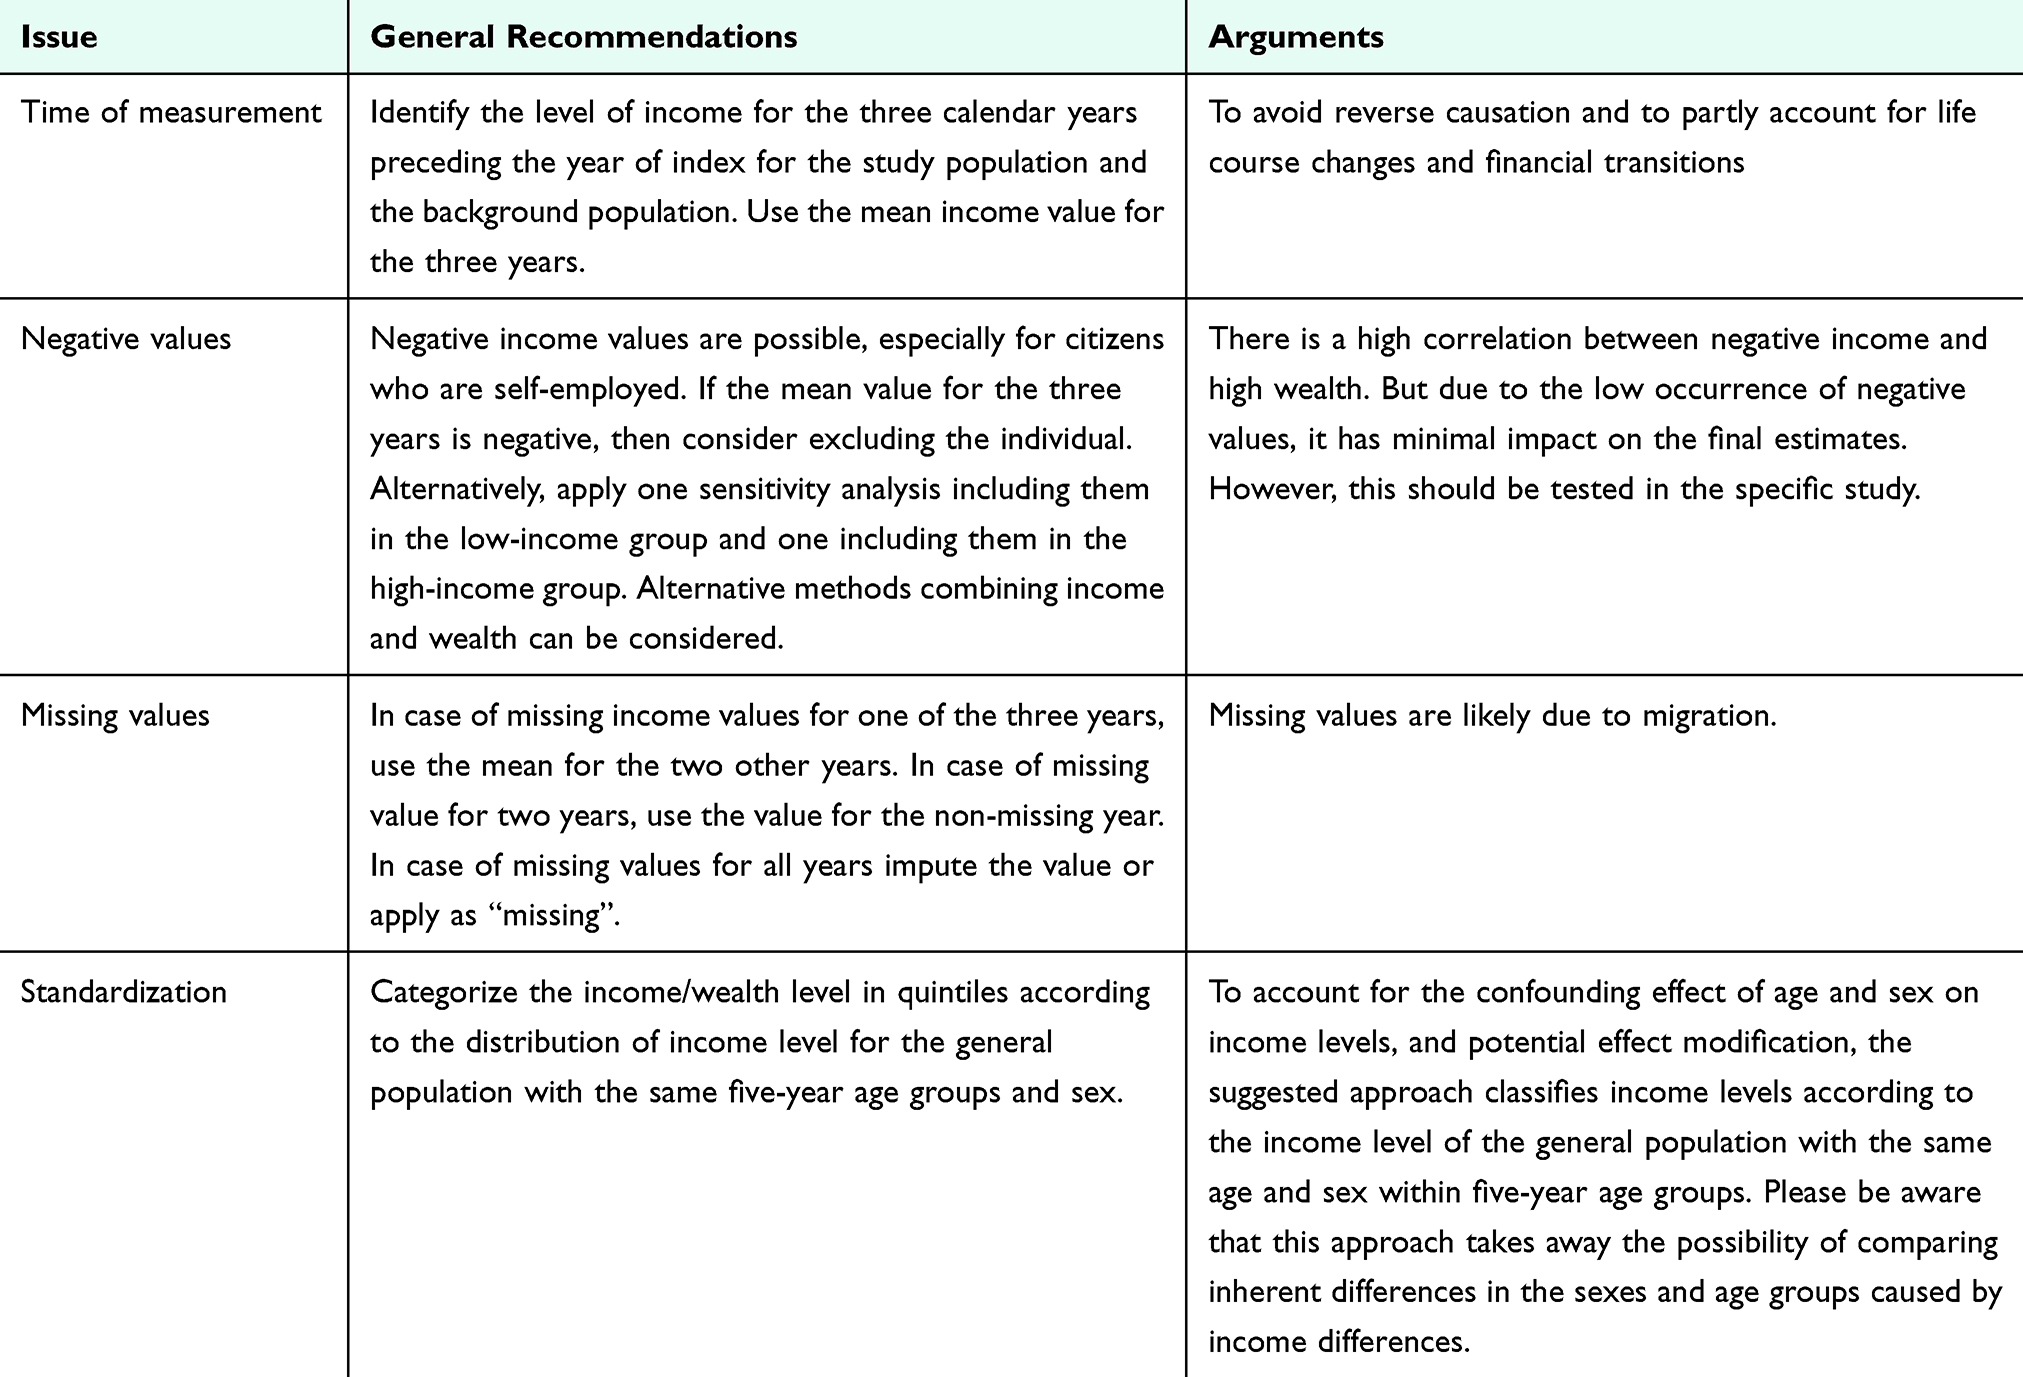 |
Table 8 Data Management of Income and Wealth |
Categorization
As suggested by Ejlskov et al,9 an initial step in categorizing income is to examine its functional form by plotting across deciles, quintiles and quartiles. This analysis helps determine the right categorization. While dividing income into three groups based on the grouping of quintiles is often preferred to ensure adequate cell counts, as suggested in Table 9, some studies may benefit from using more categories. For research focusing on poverty, the relative poverty threshold defined as <50% of the median income can be applied.40
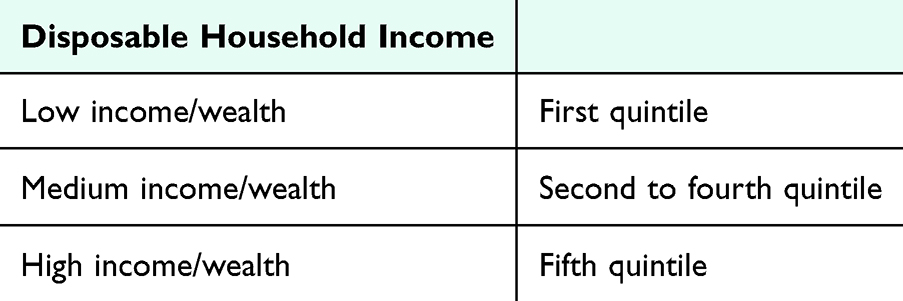 |
Table 9 Categorization of Income and Wealth Using Danish Registry Data |
Continuous Variable
For some studies, modeling income as a continuous variable may be appealing. However, recent findings indicate that modeling income continuously is highly susceptible to downward bias, particularly due to the likely misclassification of wealthier individuals at the lower end of the tax-reported income spectrum.9 Moreover, the functional relationship between income and health does not follow a linear pattern but rather shows diminishing returns for higher income levels. Modelling income continuously tends to underestimate the health association for lower incomes while overestimating it for higher incomes. If including income as a continuous variable, we suggest using splines or fractional polynomials, if possible, to more accurately capture the complex relationship between income and health. These approaches allow for a more flexible representation of the underlying functional form.
Attention Points
Causality Issues
- Illness and diseases, accidents, or family situations may for shorter or longer periods impact the ability to work and thus income.15 The time of which income is measured should, therefore, be chosen in a way that minimize reverse causality between health and income.
Missing Information
- Most income variables available at Statistics Denmark are based on individuals residing in Denmark for the entire calendar year in question.
Inaccuracy and Misclassification
- In 2022, 0.3% of the population had a negative income. This proportion varies across age groups and calendar year. The main causes of negative income are interest expenses (45%), losses from self-employment (27%), losses on investments (19%), delayed tax payments (5%), and alimonies (4%). Ejlskov et al9 found a high correlation between negative income and high wealth. As such, those with a negative income might belong to a wealthy population and can be misclassified if negative income is not handled. This may also apply to small positive incomes, which for the same reasons may be downward adjusted.
- Some individuals may in shorter or longer periods have low income due to unemployment, education, maternity leave, or because they work reduced hours.
Birth Cohort/Life Course Aspects
- Income levels vary substantially over the life course and are highly sensitive to life events. Young people in education and training usually have lower incomes, which gradually increase as they complete their studies and gain more work experience. Likewise, the income level decreases again upon reaching retirement age, while wealth may accumulate with age.
- To account for societal salary developments over time, income values should be re-calculated according to inflation levels during the study period. Please refer to the suggested data management, for which income is calculated in income quintiles by calendar year and accounting for inflation. Another approach is to use a costumer price index (eg, from Statistics Denmark). The income can be adjusted to current currency values using the country-specific GDP deflator, which is available on the World Bank’s website.
Cohabitation and Marital Status
Cohabitation status indicates whether an individual lives alone or with a partner, whereas marital status refers to the legal marriage status. Cohabiting or married individuals often exhibit better health outcomes and lower mortality compared to their counterparts.41 This phenomenon is likely attributed to differences in health behavior and emotional support, financial stability, and encouragement to seek medical care and adhere to treatment regimens. Additionally, cohabiting/married individuals may experience less psychological stress and better mental health, which can positively impact their overall health and ability to recover from serious illnesses like cancer. Though not a traditional indicator of socioeconomic position, incorporating cohabitation and marital status allows for a more comprehensive understanding of how social factors impact health outcomes and the identification of vulnerable groups. In Denmark, many families/couples live together without being married. By default, it is, therefore, suggested to use cohabitation status. Internationally, marital status is, however, a more common approach and can be included in supplementary analyses.
Data Sources and Variables
Marital status and address (used to define cohabitation status at Statistics Denmark) have since 1968 been systematically registered in the Danish Civil Registration System and are also available at Statistics Denmark in the population table BEF (Table 10). In the algorithm for cohabitation, Statistics Denmark defines couples as 1) Married individuals, 2) Individuals in a registered partnership, and 3) Cohabitating individuals, either defined as 3.1) living on the exact same address and ≥1 cohabitating common children, or 3.2) as living on the exact same address, and no cohabitating common children (except stepchildren), and opposite biological sex, and age difference of <15 years, and not closely related based on identifiers for children and parents, and no other adults living at the same address.
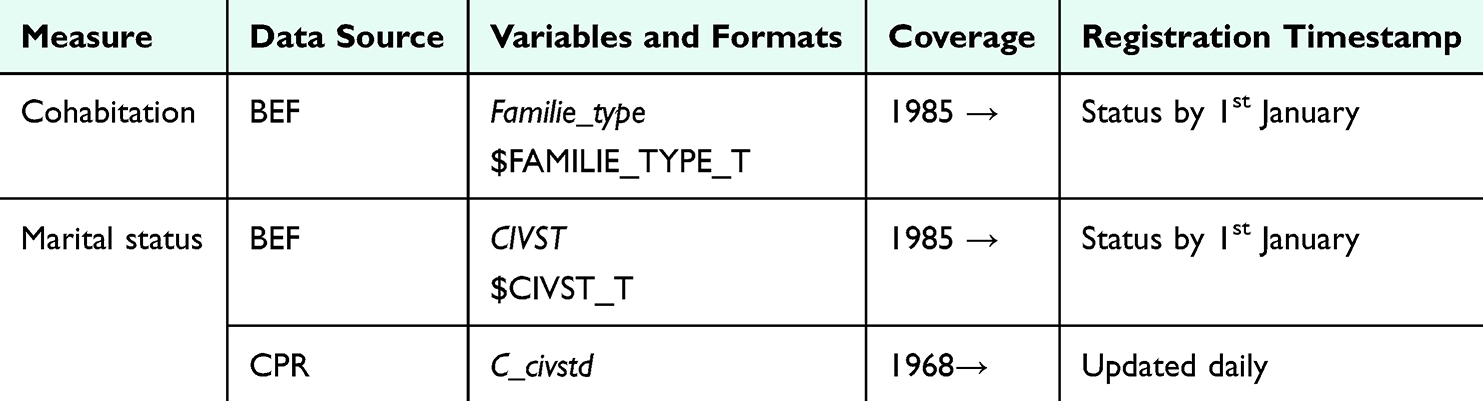 |
Table 10 Data Sources for Cohabitation and Marital Status and in the Danish Registries |
To avoid reverse causation, it is recommended to measure cohabitation status at the year preceding the index data and marital status at index (Table 11).
 |
Table 11 Data Management of Cohabitation and Marital Status |
Categorization
The suggested categorization provided in Table 12 can be used independently of the measure used, offering the opportunity to apply more granular groups of “B: not married” if using the CIVST variable (marital status).
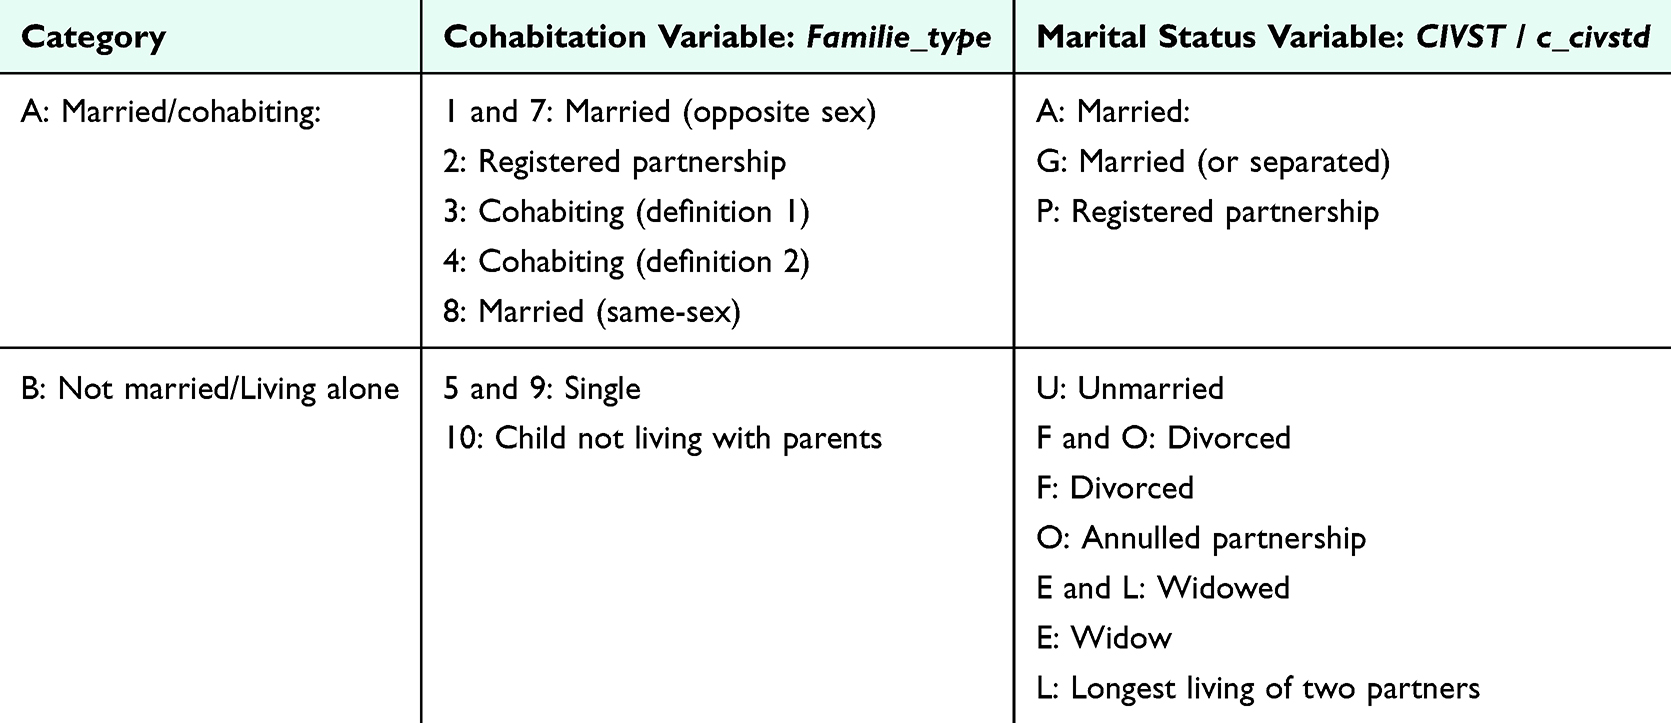 |
Table 12 Categorization of Cohabitation and Marital Status Using Danish Registry Data |
Attention Points
Causality Issues
- Cohabitation/marital status is associated with later health outcomes.41 However, illness may also lead to a change in cohabitation/marital status. Thus, it is important to consider a potential causal association in both directions.
Missing Information
- Information on marital status is available at Statistics Denmark for individuals residing in Denmark for the calendar year in question. Individuals with missing values will often be recently immigrated.
Inaccuracy and Misclassification
- The algorithm for cohabitation misclassifies non-hetero unmarried cohabiting couples as living alone. Moreover, cohabiting individuals not living in a romantic relationship, eg, roommates of the opposite sex, will figure as cohabiting, though not having a partner.
- Marital status is a valid indicator on its own, but using marital status as eg, a proxy for partnership is linked with misclassification, assuming that unmarried individuals are single.
Birth Cohort/Life Course Aspects
- Measuring the duration of cohabitation or marital status may provide valuable additional information, both as an exposure and as a potential effect modifier in relation to relevant health outcomes.
- Younger cohorts may be more likely to be cohabiting and unmarried, than older cohorts.
Ethnicity
Ethnicity is a complex and multifaceted concept, which is widely recognized as a social construct. It encompasses aspects such as shared culture, social structures, religion, traditions, language, and shared geographical origin. As a dynamic construct, ethnicity can evolve and shift depending on the surrounding context. Considering these factors, an individual’s ethnicity refers to the group to which an individual identifies, belongs, or is perceived to belong.42–44
The term “ethnic minority group” commonly identifies population groups distinct from the predominant population in a country. While “minority” has a numerical implication, it can also signify a less empowered position within societal hierarchies.44 In this chapter, the terms “ethnic minority group” or “ethnic minority background” are used when referring to populations numerically smaller than the majority of the country. SEPLINE does not assume any specific positions of power and does not take a stance on it. Migration can also be a determinant of health. There is no internationally accepted definition of the term “migrant” but it is commonly used as an umbrella term referring to individuals who relocate from their usual place of residence. This movement can occur within a country or across international borders, and be temporary or permanent.45
Migrants and individuals with ethnic minority backgrounds often face difficulties when accessing healthcare services, eg, due to language barriers, financial barriers, or structural barriers. When combined with varying levels of health literacy, these barriers can contribute to poorer health outcomes for these populations.46 Furthermore, many migrants and individuals with ethnic minority backgrounds occupy lower socioeconomic positions, with limited access to education, employment opportunities, and adequate income. These socioeconomic disadvantages are associated with poorer health outcomes and further challenged by cultural differences, systemic inequities, and the enduring effects of discrimination and marginalization.47–49
In epidemiological research, measurement of ethnicity is often simplified and limited to indicators such as country of origin or immigration status, which likely fail to capture the complex nuances of ethnicity. This highlights the importance of developing more nuanced and comprehensive approaches to studying ethnicity or variables related to ethnicity and clearly conceptualizing and defining the variables.
Data Sources and Variables
While the Danish registers do not contain direct measures of ethnicity, they offer several related indicators, including migration status, country of origin, residency data and length of residency in Denmark (Table 13). Researchers should select the variables that best align with the focus of their study and the information they seek to uncover. Since 1968, country of origin and immigration status have been systematically registered in the Danish Civil Registration System and are available at Statistics Denmark in the population table BEF from 1985 and onwards. These variables are derived from information on citizenship and the parents’ country of birth. An individual’s country of origin is defined as “Denmark” if at least one parent was born in Denmark and holds Danish citizenship, regardless of the individual’s own country of birth. For immigrants and descendants, the country of origin is determined by the mother’s country of birth or citizenship. If the mother’s information is unavailable, the father’s country of birth or citizenship is used. If information from both parents is unavailable, the individual’s own country of birth or citizenship is used. Detailed information regarding “country of origin” and “immigration status” and how they overlap can be found in Table S5 and Table S6.
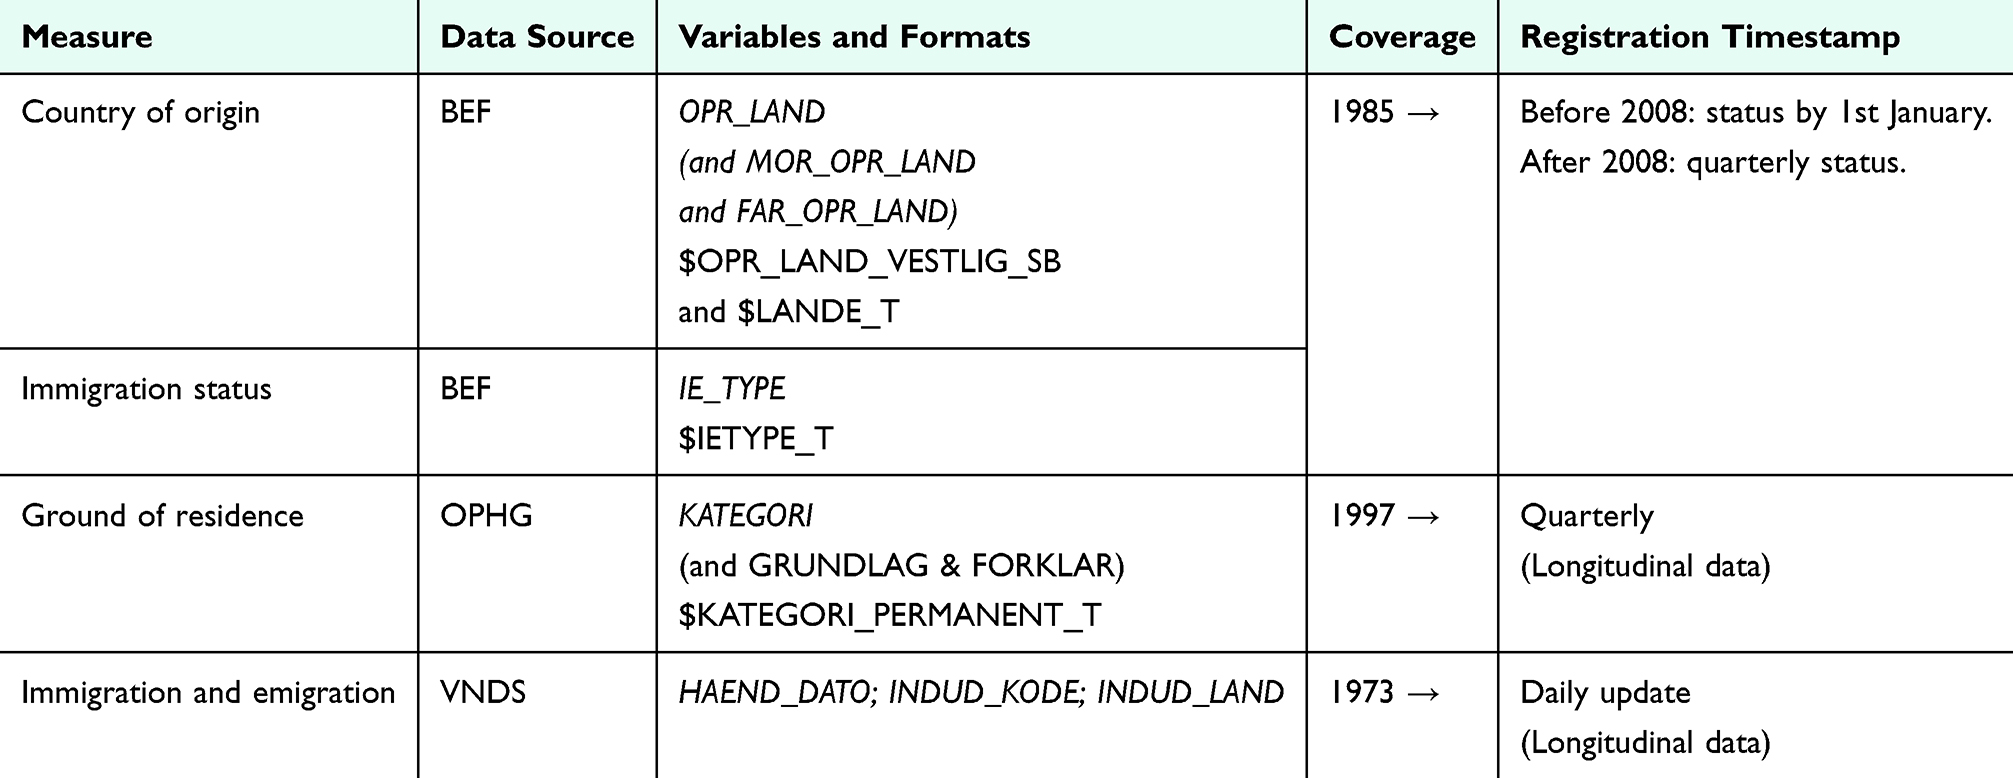 |
Table 13 Data Sources for Ethnicity in the Danish Registries |
Information regarding the grounds of residence and types of residence permits has been registered in the OPHG table since 1997. This can, for example, be used to identify refugees. Linkable data from before 1997 is also available in the D101200.PSD_OPHOLDSGRUND_FOER1997_SURVEY registry at Statistics Denmark. However, this registry primarily contains imputed data, supplemented with information from a survey conducted by Statistics Denmark in 2019 and non-published residence permits from 1993 to 1996. Due to these limitations, the data is not recommended for analyses of small study populations but can be considered for research on larger populations.50 In addition, studies have used country of origin to approximate refugee status by coding individuals from largest refugee-sending countries between 1986 and 1992.51 Immigration and emigration dates have been systematically documented in the VNDS table since 1973, enabling the calculation of the duration of stay in Denmark. Additionally, this information has been available in the BEF table since 2004 through the variables FOERSTE_INDVANDRING, SENESTE_INDVANDRING, OPHOLDMD_DK.
Categorization
The context-dependent nature of ethnicity requires a flexible and sensitive approach to its categorization, tailored to specific circumstances, which is difficult to capture in the available registry data. Hence, Table 14 serves solely as an example of categorizations and combinations of two variables available at Statistics Denmark that are frequently used as indicators of ethnicity in registry-based studies. These can be used to subgroup immigrants or descendants into Western and non-Western countries of origin. However, this should be regarded as an attempt to approximate ethnic minority status rather than ethnicity itself. It does not capture the complex, multifaceted nature of ethnicity and should not be interpreted as such. Possible categorizations other than Western/non-Western provided by Statistics Denmark are World Regions or EU and EEA countries/countries outside of EU and EEA (LANDE_PSD_V1_2021 classification). For alternative methods of categorizing global regions, resources such as Our World in Data provide additional perspectives.52 It is generally recommended to use as granular reporting of ethnicity as possible.43,53
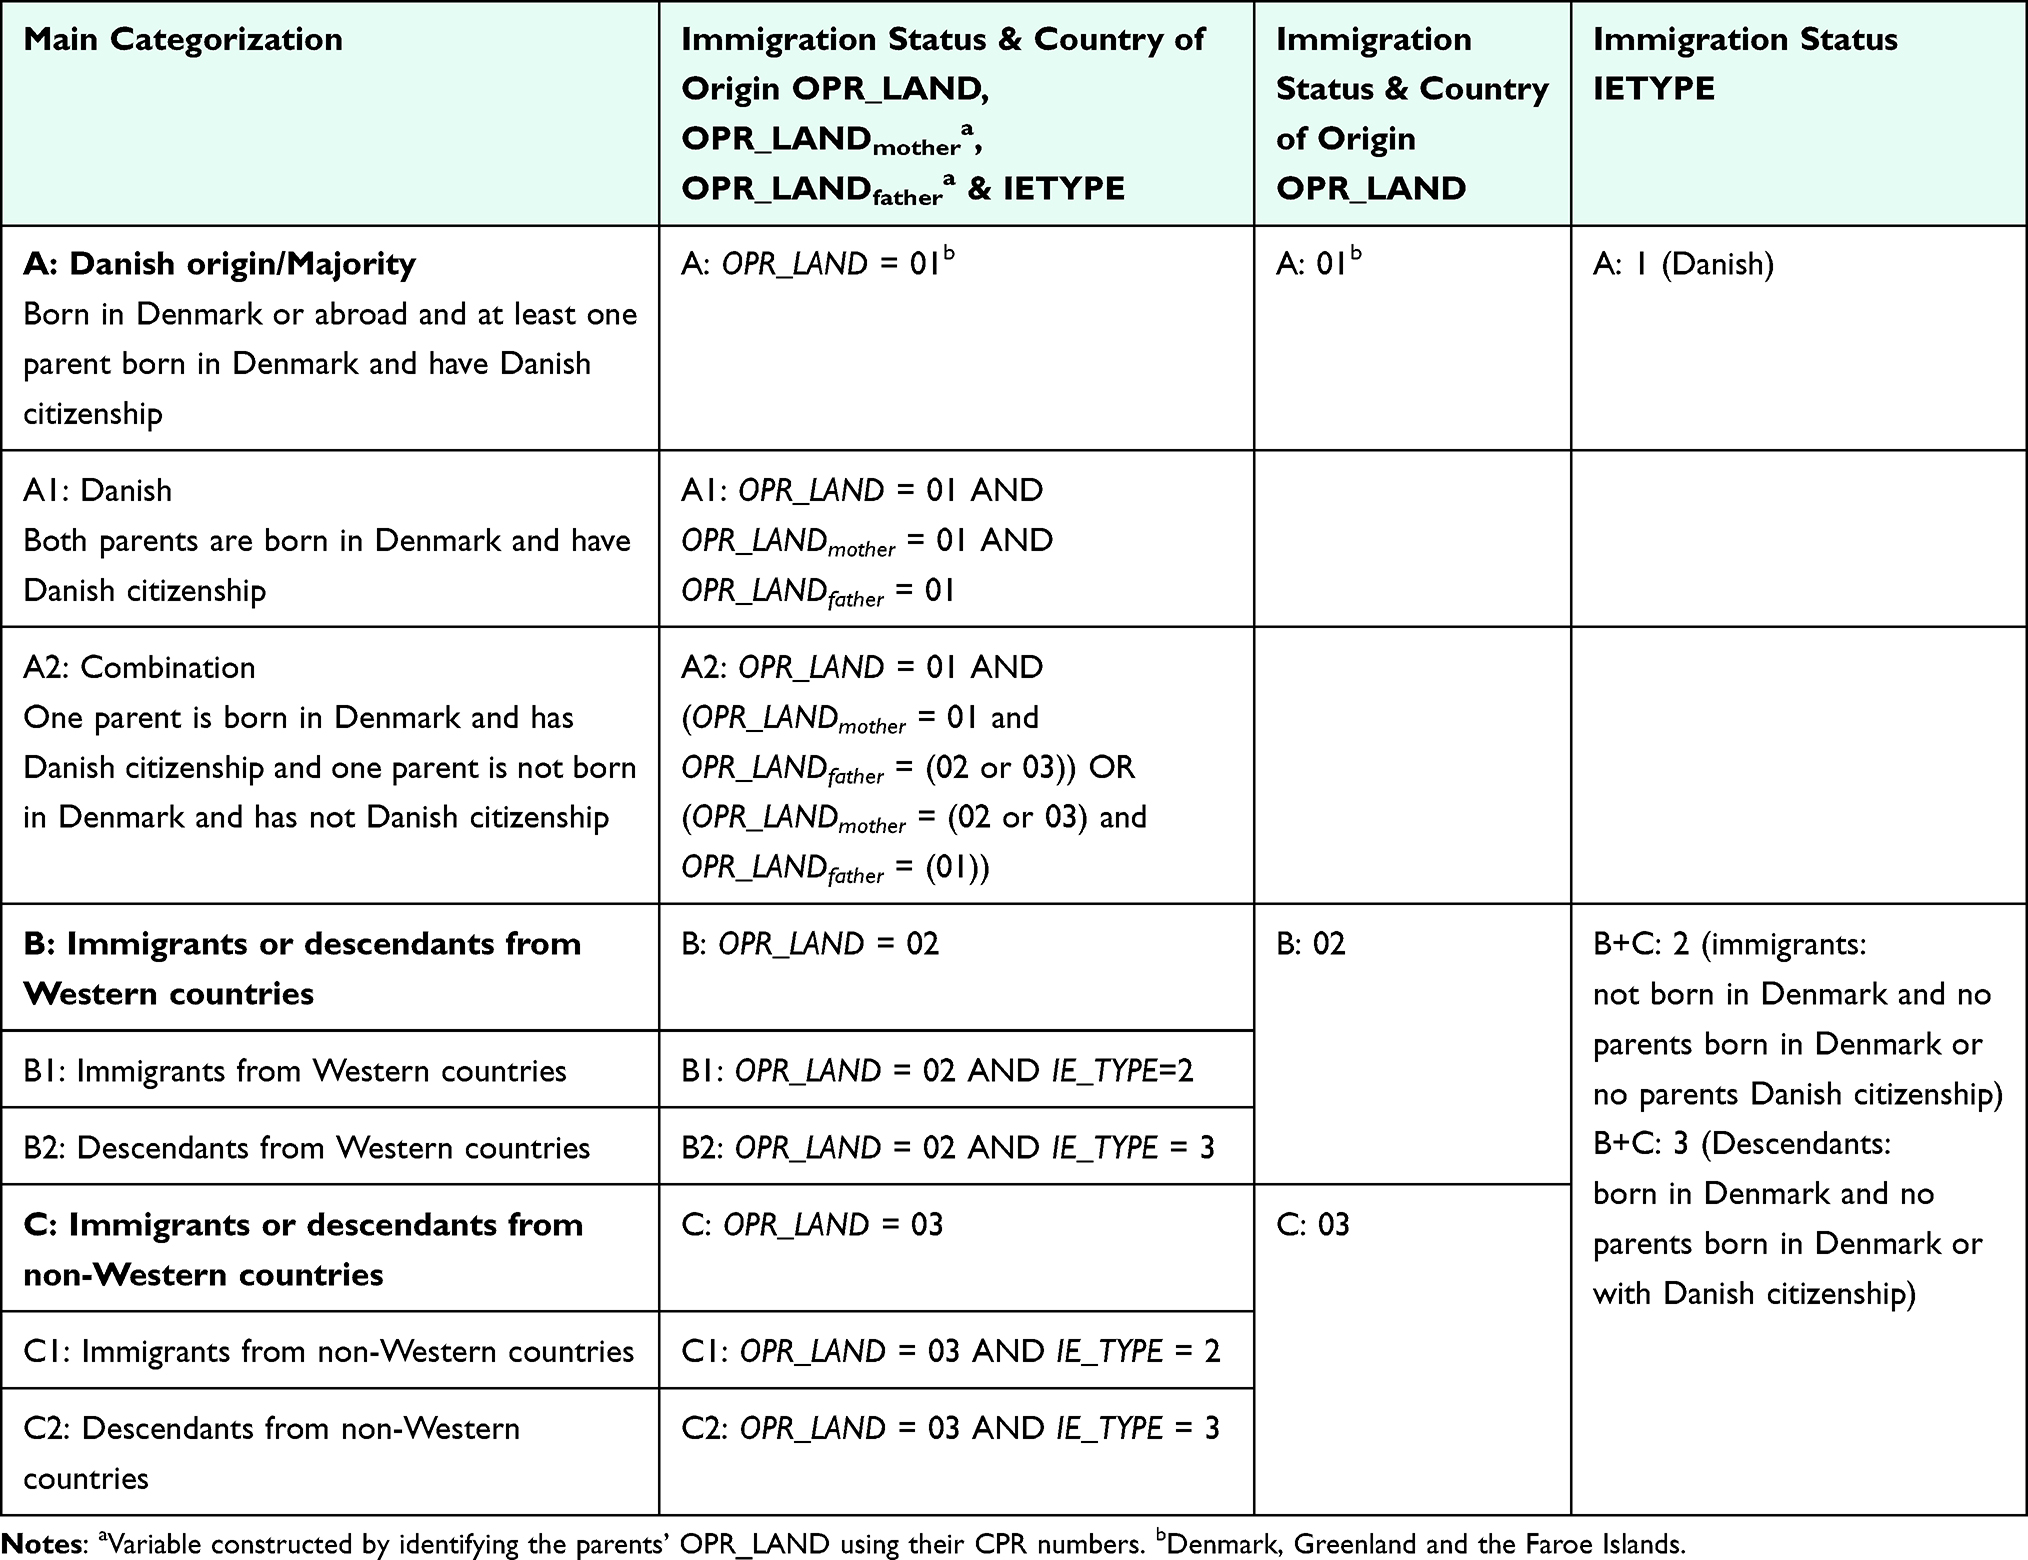 |
Table 14 Example on Categorization of Ethnicity Using Danish Registry Data |
Attention Points
Causality Issues
- When interpreting any proxy of ethnicity or ethnic minority status, it is essential to recognize that it simultaneously proxy many other factors concerning the lives of individuals within ethnic minority groups. Observed advantages or disadvantages across ethnic groups do not explain them, and researchers should think broadly about the relevant factors behind such patterns. For the analyses, it should be acknowledged that these factors often should be considered as mediators and not confounders.
- Potential health-related effects according to country of origin, basis for residence, length of time in Denmark, and number of re-immigrations may vary greatly. To gain deeper insight into these differences, consider including information on more than one of these.
Missing Information
- For data prior to 2008, information on country of origin (OPR_LAND) and immigration status (IE_TYPE) is only available at Statistics Denmark for individuals who had resided in Denmark for the entire calendar year. As a result, information is missing for newly registered residents and individuals without a residence permit or a Danish CPR number, such as asylum seekers—a group that may experience distinct health problems. If data for a specific index year is missing, consider retrieving information from nearby years or from other relevant data sources. After 2008, the information is available quarterly.
- Information on basis for residence is retrieved from the Danish Immigration Service through CPR linkage. This is not always possible, which is why Statistics Denmark in these cases impute basis for residence. The source used for imputation (eg, a survey) can be found in the variable IMPUTATION in the OPHG table
Inaccuracy and Risk of Misclassification
- Statistics Denmark’s definition of country of origin does not account for cases where one of the parents is not born in Denmark, which may be related to discrimination or distinct health outcomes. The combination category (A2 in Table 14) can be used to capture these nuances.
- As the definition of IE_TYPE and OPR_LAND differs, it is important to notice that individuals registered as being of Danish origin (IE_TYPE) will always have Denmark as country of origin (OPR_LAND).
- The definition of immigration status (IE_TYPE) and country of origin (OPR_LAND) depends on the parents’ country of birth and citizenship. If citizenship is later changed for a parent born in Denmark, the individuals’ immigration status and country of origin will change.
- The OPHG data change over time with ongoing immigrations and emigrations, eg, if individuals emigrate for studies, return to Denmark, emigrates again for work, and later re-immigrates.
Birth cohort/life course aspects
- The composition of ethnic minority groups evolves considerably over time in response to global migration patterns and national immigration legislation. The data available in administrative registers often fail to capture these dynamic patterns, which may have differential impact on health-related factors.
Area-Level Characteristics
In social epidemiology, area-level characteristics of the neighborhood where people live have been investigated to identify upstream and structural factors related to socioeconomic differences in health.54–57 Several social epidemiological theories describe the complex way in which neighborhood can affect the health and well-being of a population.56,58,59 These theories emphasize the need to look beyond individual-level factors to understand the underlying drivers of socioeconomic differences in health.
The impact of neighborhood on health and well-being is proposed to be mediated by both the physical, social, and health service environment.56,58 This includes features such as air pollution, drinking water quality, noise pollution, walkability, neighborhood deprivation, violence, segregation, as well as the availability and distance to healthcare services in the neighborhood.56,60–62 These features are likely interrelated and may work through different mechanisms and vary in strength and importance across individuals and socioeconomic groups. Theorizing the pathway linking the area of residence to the specific outcomes is essential, as well as defining which neighborhood feature to measure and the appropriate data sources. This section focuses on the social environment and how area-level sociodemographic characteristics (including area-level socioeconomic position) are linked to health outcomes. The description of how the physical and health service environments affect health and socioeconomic differences in health is beyond the scope of this guideline.
The impact of the neighborhood socioeconomic environment on health is proposed to be driven by factors beyond the sum of the characteristics of the individuals living in the neighborhood. However, the sociodemographic characteristics of a neighborhood are partly shaped by the characteristics of its residents, as well as the migration of individuals into and out of the area, eg, due to lower housing costs attracting individuals and families on transfer-incomes, partly explaining the high morbidity of an area.63–65 Hence, when studying the effect of area-level characteristics on health, it is crucial to account for the sociodemographic characteristics of individuals living in the area and the migration patterns over time.58,66 Multilevel epidemiological models adjust for this clustering and account for the fact that people in the same neighborhood may share similar environmental influences. These models have been applied to increase our understanding of how individual and neighborhood factors jointly impact health.67,68 However, methodological problems with causal inference related to cross-sectional multi-level models have been discussed.69–71 Alternative study designs, such as cluster randomized controlled trials and quasi-experimental study designs, have been suggested for strengthening the ability to study causal effects of neighborhood socioeconomic characteristics on health.72 Examples from Denmark include quasi-experimental studies of the effect of neighborhood disadvantage on the risk of psychiatric disorders and cardiovascular disease among refugees immigrating to Denmark who were randomly distributed among neighborhoods with different sociodemographic profiles.73,74
Data and Variables
The geographical area may either be defined by existing administrative units (eg, region, municipality, or parish), by national grids, or by researcher-defined units. Further, some environmental features of the area are accessible at the address level, eg, population density.
Administrative Units
Information on the region, municipality or parish, corresponding to the place of residence of each citizen, is available at Statistics Denmark in the BEF table (variables KOM and REG) and SOGN/BYSTRB/DAR tables (variables SOGN/SOGNNR/SOGNKODE) (Table 15). These are commonly used in research, but the variables endured substantial changes over time and are consequently heterogeneous, eg, regarding the number of residents. The larger municipalities Aarhus and Copenhagen have each developed smaller districts and units and related area-level variables. In Copenhagen, “roder” are historical division of taxation areas usable as small-area units (399 roder). Data is accessible for free on the municipalities’ homepages. These variables are linkable with BEF using the OPGIKOM and KOM variables as key variables for merging data. Note that administrative units might not reflect the relevant spatial context.
 |
Table 15 Data Sources for Area-Level Characteristics in the Danish Registries |
National Grids
Statistics Denmark and the Danish Geodata Agency have developed the Danish national grid, which divides Denmark into thousands of cells that can be aggregated as desired and could be provided as small as 100×100 meters, if the privacy requirements of Statistics Denmark are met. Statistics Denmark has constructed a range of variables aggregated at the grid-level, including household income, age, educational level, car ownership, and socioeconomic position.
Researcher-Defined Units
Neighborhood can be defined by the researcher who constructs the relevant area for the research question under study, based on data from the publicly available Danish Address Registry. Yet, an alternative to administrative units as a measure of neighborhood has been developed based on the Danish national grid unit and physical barriers (eg, roads, streams, railways).75 Recently, a longitudinally consistent geographical unit with a mean population of approximately 2500 individuals has been introduced as another alternative to the changing parish units.76
Measuring Area-Level Characteristics
Identifying the relevant area-level measures is highly dependent on the research question. To avoid reverse causation, it is recommended to use the latest available information prior to index date (Table 16).
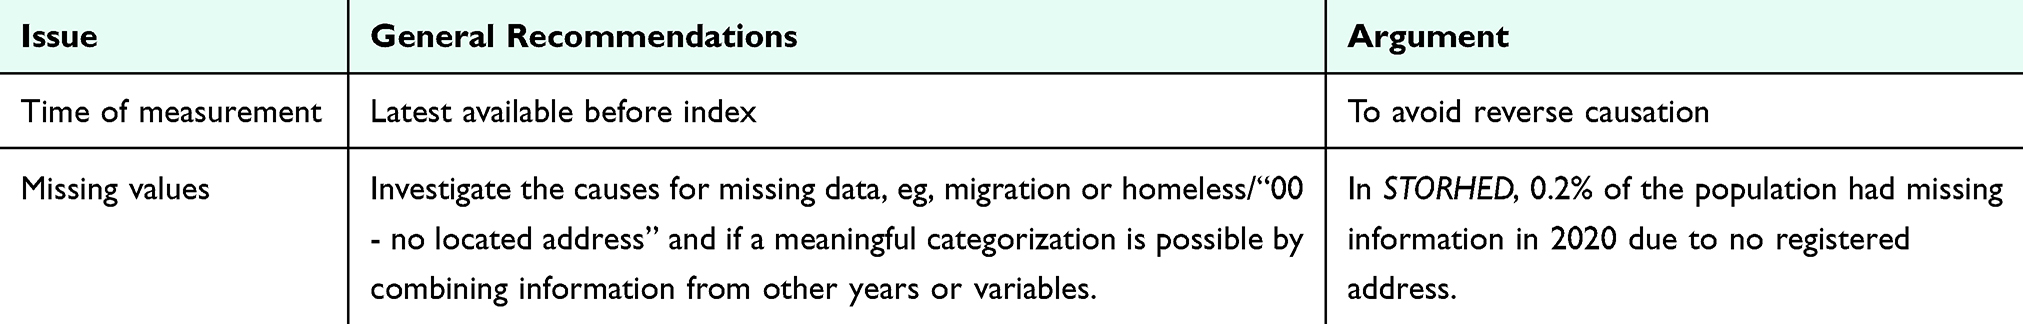 |
Table 16 Data Management of Area-Level Characteristics Data |
The area-level sociodemographic characteristics can be measured by mean/median household income, the proportion of immigrants and descendants, or proportion of the population with low educational level. These features are measured by aggregating individual-level information to the area-level of interest. These area-level sociodemographic characteristics could be categorized into quintiles or another relevant categorization in relation to the research question. Another feature for measuring the sociodemographic characteristics of the neighborhood is the degree of urbanization, which could be linked to individuals from the area-level, eg, population density in the municipality, or the address-level, eg, population density estimated in 13 categories in the variable STORHED for all residential locations in Denmark (Table 17). When studying neighborhood socioeconomic position it is possible to combine area-level characteristics measures into an index of deprivation.77
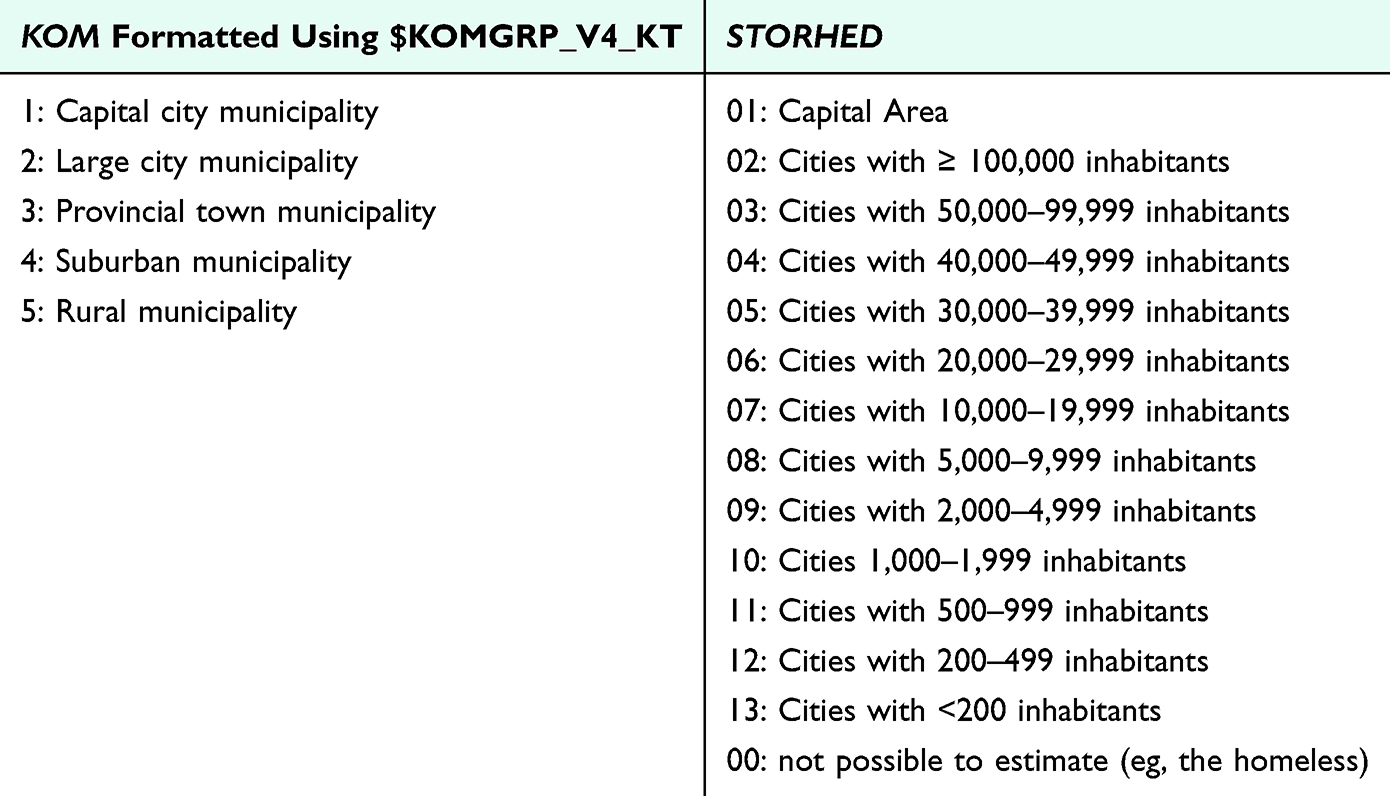 |
Table 17 Example of Categories of Area-Level Population Density Using Danish Registry Data |
Categorization
This guideline refrains from recommending categorization of area-level socioeconomic characteristics, as the relevant categorization is highly study dependent. Instead, Table 17 includes categorization of KOM according to the format $KOMGRP_V4_KT at Statistics Denmark and of the variable STORHED. The degree of urbanization is defined at the municipal-level (KOM) and by address-level (STORHED). For instance, when using KOM, the municipality of Aalborg will be categorized the same, regardless of whether they live in urban or rural areas, while STORHED provides more granular levels.
Attention Points
Causality Issues
- It is challenging to draw causal conclusions about the effect of the place of residence or neighborhood on health and wellbeing as these effects might be confounded by individual-level sociodemographic characteristics.
- It is important to explicitly describe how place of residence/neighborhood is theorized to be linked to the outcomes under study.
Missing Information
- Information on place of residence/neighborhood is available at Statistics Denmark for most citizens residing in Denmark. The few citizens with missing values are likely a distinct population group, eg, recently immigrated to the country or homeless.
Inaccuracy and Misclassification
- It is important to consider data gaps related to administrative units, especially the implementation of a structural reform of the public sector in 2007, where the former 13 counties and 270 municipalities were reduced to 5 regions and 98 municipalities. In addition, minor changes in the municipality boundaries occurred when five former municipalities of Bornholm joined into one municipality on 1st January 2003, and the two former municipalities of Ærø joined into one municipality on 1st January 2006. Statistics Denmark has constructed tables that enable converting addresses between the old to new municipality units (NBPF, NBPT, NOGF, and NOGT).
- Especially in international contexts, area-level characteristics are frequently used as a proxy for individual socioeconomic position, which may introduce misclassification bias, as area-level characteristics often fail to capture the heterogeneity of individual socioeconomic conditions within areas. This bias typically trends toward the null by diluting variability and averaging area-level data, thereby underestimating the association between socioeconomic position and health outcomes.
Birth Cohort/Life Course Aspects
- The place of residence/neighborhood may vary largely over the life course and be affected by life events such as education or training, work, family conditions, and retirement.
- Place of residence is often the area considered; however, people spend a considerable amount of time in other geographical areas, eg, at work or school.
- The population in each neighborhood changes over time, so the relative socioeconomic deprivation may also vary over time.
Analytical Considerations
Regardless of the choice of socioeconomic indicator, determining the appropriate statistical models and adjustment sets requires careful consideration of temporality and the causal pathways between exposure, outcome, and covariates. Transparency in reporting is vital for ensuring that methods and assumptions are clearly communicated, as they influence the interpretation of findings and their implications for public health interventions. Researchers are encouraged to include detailed tables that outline variables, data management steps, and categorization in supplemental materials. Graphical depictions can help communicate study design and data collection strategies, as well as identify potential bias.78 Moreover, tools such as Directed Acyclic Graphs79 or causal loop diagrams80 can be used to visualize underlying theoretical assumptions.
Temporality
From a life course perspective, it is important to consider different pathways linking socioeconomic position to health. A central discussion pertains to whether the social gradient observed in most health-related outcomes is caused by having a low socioeconomic position (social causation) or is a result of morbidity, poor health, or predisposing inherited factors leading to a lower socioeconomic position (social drift).81
These two pathways are illustrated in Figure 3, using morbidity as an example. Example A assumes that morbidity impacts income, making it a confounder in the association between income and cancer survival. Example B, however, suggests that income impacts morbidity (eg, through factors like health behavior and environmental exposure), which means that morbidity acts as a mediator on the causal pathway between income and cancer survival. In Example A, not adjusting for morbidity as a confounder would overestimate the effect of income on cancer survival, whereas in Example B, adjusting for morbidity would lead to an underestimation of the effect of income on cancer survival.
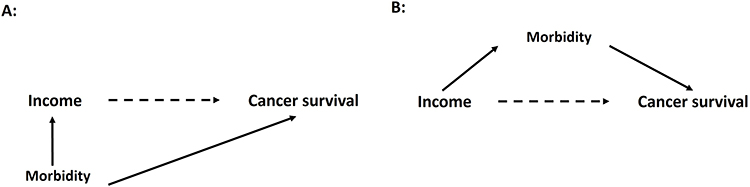 |
Figure 3 Illustration of the association between income and cancer survival confounded by morbidity pre-diagnosis (A) or mediated by morbidity post-diagnosis (B). |
Causal Pathways and Interpretation
The relationship between socioeconomic position and health outcomes is complex, with the role and direction of specific variables depending on the specific research question and assumptions. Figure 4 gives an example of common temporal relationships between socioeconomic indicators, demographic factors, and health conditions, integrating the social drift and social causation hypotheses.82 As socioeconomic position acts as the exposure, it is crucial to collect the indicator before the investigated disease outcome, including potential early pre-diagnosis effects that could impact factors such as income level. In this association, variables such as sex, year of birth, and age at diagnosis or calendar year at diagnosis often act as confounders. However, pre-diagnosis socioeconomic position may also influence the timing of diagnosis/age at diagnosis. Moreover, adjusting for sex implies a value judgment that differences by sex are permissible and should, therefore, be controlled for, which may not always be appropriate depending on the context.83 In such cases, reporting stratified estimates by sex can offer more nuanced insights. Likewise, stratification by age or birth cohort can help elucidate whether the association between socioeconomic position and health differs across strata of these variables.
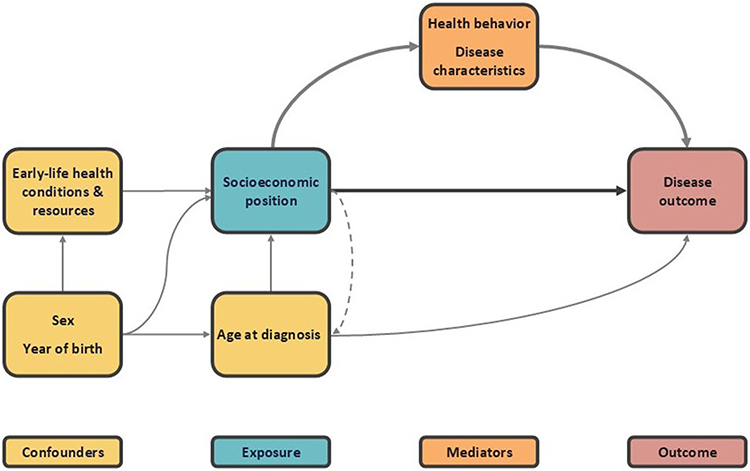 |
Figure 4 Illustration of common temporality and the relation between socioeconomic position, demographics, and health conditions. |
Figure 5 highlights an example of smoking as a mediator between socioeconomic position and cancer survival. Here, a mediation analysis can decompose the total effect of socioeconomic position on cancer survival (A) into an indirect effect through smoking and a direct effect independent of smoking (B). The indirect effect quantifies how much of the socioeconomic differences in survival could be eliminated by removing the socioeconomic differences in smoking behavior, assuming no unmeasured confounding (U). Identifying these pathways can offer valuable insights for targeted intervention strategies. However, the assumption of no unmeasured confounding for both the exposure-mediator and mediator-outcome relationships are critical and often violated. In practice, this means that the proportion mediated by smoking may be overestimated. The complex interplay between socioeconomic position, mediators like smoking, health or disease outcomes, and other confounders complicates causal inference.84,85
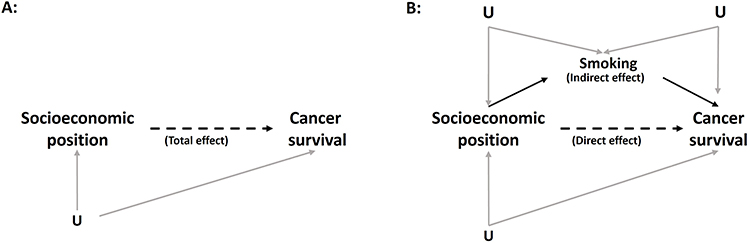 |
Figure 5 Illustration of the decomposition of the total effect of socioeconomic position on cancer survival (A) into an indirect effect going through smoking and (B) a direct effect not going through smoking. |
Categorization and Reference Level
The choice of categorization and group size may have a considerable impact on study results, including the comparability of findings across studies and how the results translate into potential intervention strategies. Using balanced categorization, such as quartiles or quintiles, may capture broader systemic trends and facilitate the implementation of population-based strategies. In contrast, focusing on a small, vulnerable group may underscore a need for individual-based strategies, tailored to address specific needs of vulnerable groups. Likewise, the choice of reference level may also impact the interpretation of results. If the number of events allows, it is suggested that the most advantaged socioeconomic group is used as the reference level, to improve the comparability of research results. In this way, the potential “window of opportunity” for health improvement is emphasized. However, often the advantaged group will be less likely to experience the outcome of interest, which might decrease the precision of the estimates. Regardless of the choice of reference category, presenting absolute estimates alongside relative differences provides a more comprehensive assessment of socioeconomic differences by establishing the baseline level of risk.
Mutual Adjustment for Multiple Socioeconomic Indicators
Due to shared effects of different socioeconomic indicators illustrated in Figure 2, mutual adjustment for multiple socioeconomic indicators should be approached with caution, as it may either enhance our understanding of the observed socioeconomic differences, or—if done blindly—introduce bias in the study.20,83 For the association between education and health, adjusting for income, and thereby also the indirect effect of education that works through income, may lead to an underestimation of the effect of education.
In the association between income and cancer survival, even if education meets the criteria of being a confounder, it depends on the research question, whether education should be adjusted for, as simply illustrated in Figure 6. If income is used as an indicator for socioeconomic position (research question A), adjusting for education will remove part of the effect of interest, leading to underestimated estimates. On the other hand, if the aim is to estimate the effect of income specifically (research question B), adjusting for education may provide important insights about unique and shared effects, which could enhance our understanding of the causes behind the observed socioeconomic differences. To increase transparency and address these complexities, it is advisable to begin with and include descriptive or unadjusted analyses.
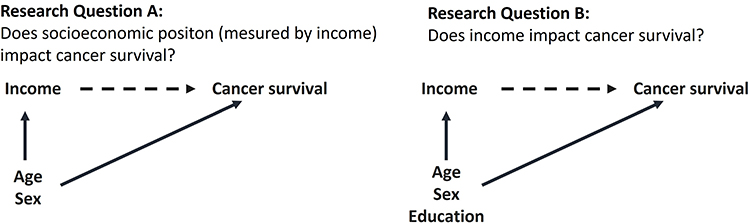 |
Figure 6 Illustration of two types of research questions and their confounding structures. |
Conclusions
To enhance the comparability, quality, and feasibility of epidemiological research, incorporating socioeconomic data, this guideline provides a structured analytical framework with specific information on Danish data sources and recommendations for data handling. While tailored to Danish registry-based research, the guideline’s methodological principles have broader applicability. Researchers are encouraged to use the guideline as a relevant starting point and adapt it to their specific study populations and research questions. Considering the complexity of the research fields, researchers are advised to ensure high transparency to clarify theoretical assumptions, data sources, and data management practices.
Acknowledgment
SEPLINE was initiated by Maja Halgren Olsen from the Danish Cancer Institute and Cathrine Fonnesbech Hjorth from Aarhus University, and developed in collaboration with Deirdre Cronin Fenton, Aarhus University and Susanne Oksbjerg Dalton, Danish Research Center for Equality in Cancer (COMPAS) and Danish Cancer Institute. Thora Majlund Kjærulff, National Institute of Public Health, University of Southern Denmark, and Mette K Thomsen, Aarhus University and Copenhagen University Hospital, have contributed to drafting the guideline. Sincere appreciation to the entire SEPLINE group for their high level of engagement and valuable contributions.
Funding
The initiative was supported by the Danish Comprehensive Cancer Center (DCCC13-2023 awarded MHO) and the Danish Cancer Society (R327-A19070 awarded DCF).
Disclosure
The authors report no conflicts of interest in this work.
References
1. Schmidt M, Schmidt SAJ, Adelborg K. et al. The Danish health care system and epidemiological research: from health care contacts to database records. Clin Epidemiol. 2019;11:563–591. doi:10.2147/CLEP.S179083
2. Karlson KB, Landersø R. The making and unmaking of opportunity: educational mobility in 20th-century Denmark. Scand J Econ. 2025;127(1):178–212. doi:10.1111/sjoe.12567
3. Organisation for economic co-operation and development. understanding the socio-economic divide in Europe. Available from: https://mronline.org/wp-content/uploads/2019/04/cope-divide-europe-2017-background-report.pdf.
4. Anell A, Glenngård AH, Merkur S. Sweden health system review. Health Syst Transit. 2012;14(5):1–159.
5. Mackenbach JP. The persistence of health inequalities in modern welfare states: the explanation of a paradox. Soc Sci Med. 2012;75(4):761–769. doi:10.1016/j.socscimed.2012.02.031
6. Pallesen AVJ, Mierau JO, Christensen FK, Mortensen LH. Educational and income inequalities across diseases in Denmark: a register-based cohort study. Lancet Public Health. 2024;9(11):e916–e924. doi:10.1016/S2468-2667(24)00128-2
7. Schmidt M, Pedersen L, Sørensen HT. The Danish civil registration system as a tool in epidemiology. Eur J Epidemiol. 2014;29(8):541–549. doi:10.1007/s10654-014-9930-3
8. Statistics Denmark. High quality variables [In Danish: højkvalitetsvariable]. Available from: https://www.dst.dk/da/TilSalg/Forskningsservice/Dokumentation/hoejkvalitetsvariable.
9. Ejlskov L, Plana-Ripoll O. Income in epidemiological research: a guide to measurement and analytical treatment with a case study on mental disorders and mortality. J Epidemiol Community Health. 2025;jech–2024–223206. doi:10.1136/jech-2024-223206
10. Lynch J, Kaplan G. Socioeconomic Position. In: Berkman LF, Kawachi I editors. Social Epidemiology. Oxford University Press; 2000. doi:10.1093/oso/9780195083316.003.0002
11. Krieger N, Williams DR, Moss NE. Measuring social class in US public health research: concepts, methodologies, and guidelines. Annu Rev Public Health. 1997;18(1):341–378. doi:10.1146/annurev.publhealth.18.1.341
12. Diderichsen F, Evans T, Whitehead M. The social basis of disparities in health. In: Evans T, Whitehead M, Diderichsen F, Bhuiya A, Wirth M editors. Challenging Inequities in Health: From Ethics to Action. Oxford University Press; 2001. doi:10.1093/acprof:oso/9780195137408.003.0002
13. Diderichsen F, Hallqvist J, Whitehead M. Differential vulnerability and susceptibility: how to make use of recent development in our understanding of mediation and interaction to tackle health inequalities. Int J Epidemiol. 2019;48(1):268–274. doi:10.1093/ije/dyy167
14. Dahlgren G, Whitehead M Policies and strategies to promote social equity in health. background document to WHO - strategy paper for europe. Institute for Futures Studies; 1991. Available from: https://EconPapers.repec.org/RePEc:hhs:ifswps:2007_014.
15. Galobardes B, Shaw M, Lawlor DA, Lynch JW, Davey Smith G. Indicators of socioeconomic position (part 1). J Epidemiol Community Health. 2006;60(1):7–12. doi:10.1136/jech.2004.023531
16. Marmot MG, Rose G, Shipley M, Hamilton PJ. Employment grade and coronary heart disease in British civil servants. J Epidemiol Community Health. 1978;32(4):244–249. doi:10.1136/jech.32.4.244
17. Marmot MG, Smith GD, Stansfeld S, et al. Health inequalities among British civil servants: the Whitehall II study. Lancet Lond Engl. 1991;337(8754):1387–1393. doi:10.1016/0140-6736(91)93068-k
18. Olsen MH, Kjær TK, Dalton SO, Danish Cancer Society Research Center. Social Inequality in Cancer in Denmark: White Paper.Danish Cancer Society; 2023. Available from: https://mediebibliotek.cancer.dk/m/7484eb8e03945662/original/Whitepaper_2023_Social_Inequality_in_Cancer.pdf.
19. Afshar N, English DR, Milne RL. Factors explaining socio-economic inequalities in cancer survival: a systematic review. Cancer Control. 2021;28:10732748211011956. doi:10.1177/10732748211011956
20. Green MJ, Popham F. Interpreting mutual adjustment for multiple indicators of socioeconomic position without committing mutual adjustment fallacies. BMC Public Health. 2019;19(1):19. doi:10.1186/s12889-018-6364-y
21. Khalatbari-Soltani S, Maccora J, Blyth FM, Joannès C, Kelly-Irving M. Measuring education in the context of health inequalities. Int J Epidemiol. 2022;51(3):701–708. doi:10.1093/ije/dyac058
22. Svendsen MT, Bak CK, Sørensen K, et al. Associations of health literacy with socioeconomic position, health risk behavior, and health status: a large national population-based survey among Danish adults. BMC Public Health. 2020;20(1):565. doi:10.1186/s12889-020-08498-8
23. Bröder J, Chang P, Kickbusch I, et al. IUHPE position statement on health literacy: a practical vision for a health literate world. Glob Health Promot. 2018;25(4):79–88. doi:10.1177/1757975918814421
24. Jensen VM, Rasmussen AW. Danish education registers. Scand J Public Health. 2011;39(7 Suppl):91–94. doi:10.1177/1403494810394715
25. International Standard Classification of Education: ISCED 2011. UNESCO Institute for Statistics; 2012.
26. Statistics Denmark.Without education [in danish: uden uddannelse]. Statistics Denmark; 2021. Available from: https://www.dst.dk/Site/Dst/Udgivelser/GetPubFile.aspx?id=44731&sid=udenudd2021.
27. Galobardes B, Shaw M, Lawlor DA, Lynch JW, Davey Smith G. Indicators of socioeconomic position (part 2). J Epidemiol Community Health. 2006;60(2):95–101. doi:10.1136/jech.2004.028092
28. Petersson F, Baadsgaard M, Thygesen LC. Danish registers on personal labour market affiliation. Scand J Public Health. 2011;39(7_suppl):95–98. doi:10.1177/1403494811408483
29. Hjollund NH, Larsen FB, Andersen JH. Register-based follow-up of social benefits and other transfer payments: accuracy and degree of completeness in a Danish interdepartmental administrative database compared with a population-based survey. Scand J Public Health. 2007;35(5):497–502. doi:10.1080/14034940701271882
30. Schmidt JA, Woolpert KM, Hjorth CF, Farkas DK, Ejlertsen B, Cronin-Fenton D. Social characteristics and adherence to adjuvant endocrine therapy in premenopausal women with breast cancer. J Clin Oncol. 2024;42(28):3300–3307. doi:10.1200/JCO.23.02643
31. Hjorth CF, Damkier P, Ejlertsen B, Lash T, Sørensen HT, Cronin-Fenton D. Socioeconomic position and prognosis in premenopausal breast cancer: a population-based cohort study in Denmark. BMC Med. 2021;19(1). doi:10.1186/s12916-021-02108-z
32. Backhaus I, Hoven H, Tecco CD, Iavicoli S, Conte A, Dragano N. Economic change and population health: lessons learnt from an umbrella review on the great recession. BMJ Open. 2022;12(4):e060710. doi:10.1136/bmjopen-2021-060710
33. Lindholdt L, Labriola M, Nielsen CV, Horsbøl TA, Lund T. Sequence analysis to assess labour market participation following vocational rehabilitation: an observational study among patients sick-listed with low back pain from a randomised clinical trial in Denmark. BMJ Open. 2017;7(7):e015661. doi:10.1136/bmjopen-2016-015661
34. Dalton SO, Olsen MH, Moustsen IR, Andersen CW, Vibe-Petersen J, Johansen C. Socioeconomic position, referral and attendance to rehabilitation after a cancer diagnosis: a population-based study in Copenhagen, Denmark 2010–2015. Acta Oncol. 2019;58(5):730–736. doi:10.1080/0284186X.2019.1582800
35. Frydenlund J, Mackenhauer J, Christensen EF, et al. Socioeconomic disparities in prehospital emergency care in a Danish tax-financed healthcare system: nationwide cohort study. Clin Epidemiol. 2022;14:555–565. doi:10.2147/CLEP.S358801
36. Bihrmann K, Pedersen MT, Hartvigsen J, Wodschow K, Ersbøll AK. Social inequity in chiropractic utilisation – a cross-sectional study in Denmark, 2010 and 2017. Chiropr Man Ther. 2024;32(1):27. doi:10.1186/s12998-024-00548-x
37. Baadsgaard M, Quitzau J. Danish registers on personal income and transfer payments. Scand J Public Health. 2011;39(7_suppl):103–105. doi:10.1177/1403494811405098
38. de Vos K, Zaidi MA. Equivalence scale sensitivity of poverty statistics for the member states of the European community. Rev Income Wealth. 1997;43(3):319–333. doi:10.1111/j.1475-4991.1997.tb00222.x
39. Cairns AJG, Kallestrup-Lamb M, Rosenskjold C, Blake D, Dowd K. Modelling socio-economic differences in mortality using a new affluence index. ASTIN Bull J IAA. 2019;49(3):555–590. doi:10.1017/asb.2019.14
40. Organisation for economic co-operation and development. poverty rate. OECD. 2024. Available from: https://www.oecd.org/en/data/indicators/poverty-rate.html.
41. Frisch M, Simonsen J. Marriage, cohabitation and mortality in Denmark: national cohort study of 6.5 million persons followed for up to three decades (1982–2011). Int J Epidemiol. 2013;42(2):559–578. doi:10.1093/ije/dyt024
42. Pascoe R. Migration, ethnicity, race and health in multicultural societies (2nd edition; RS Bhopal). N Z Med J Online. 2014;127(1394).
43. Flanagin A, Frey T, Christiansen SL. AMA manual of style committee. updated guidance on the reporting of race and ethnicity in medical and science journals. JAMA. 2021;326(7):621–627. doi:10.1001/jama.2021.13304
44. Johnson MRD, Bhopal RS, Ingleby JD, Gruer L, Petrova-Benedict RS. A glossary for the first world congress on migration, ethnicity, race and health. Public Health. 2019;172:85–88. doi:10.1016/j.puhe.2019.05.001
45. Sironi ACB, Emmanuel M. Glossary on migration. International Migration Law, No. 34. International Organization for Migration (IOM); 2019. https://publications.iom.int/books/international-migration-law-ndeg34-glossary-migration.
46. Lebano A, Hamed S, Bradby H, et al. Migrants’ and refugees’ health status and healthcare in Europe: a scoping literature review. BMC Public Health. 2020;20(1):1039. doi:10.1186/s12889-020-08749-8
47. Kristiansen M, Razum O, Tezcan-Güntekin H, Krasnik A. Aging and health among migrants in a European perspective. Public Health Rev. 2016;37(1):20. doi:10.1186/s40985-016-0036-1
48. Abubakar I, Gram L, Lasoye S, et al. Confronting the consequences of racism, xenophobia, and discrimination on health and health-care systems. Lancet Lond Engl. 2022;400(10368):2137–2146. doi:10.1016/S0140-6736(22)01989-4
49. Kumar BN, Diaz E, Castaneda AE, Ahrne M, Nørredam ML, Puthoopparambil SJ. Migration health research in the Nordic countries: priorities and implications for public health. Scand J Public Health. 2022;50(7):1039–1046. doi:10.1177/14034948221125037
50. Statistics Denmark. Data on the basis for residence for immigrants before 1997 [In Danish: data om opholdsgrundlag for indvandrede før 1997]. Available from: https://www.dst.dk/Site/Dst/SingleFiles/GetArchiveFile.aspx?fi=befolkning&fo=ophold--pdf&ext={2}.
51. de Montgomery C Jamil, Rasmussen A Falah, Bergström J, Taipale H, Akhtar A, Krasnik A, Nørredam M, Mittendorfer‐Rutz E and Cullen A E. (2025). Refugee Migration Background and Healthcare Contacts Prior to First‐Episode Psychosis in Young Adults in Denmark and Sweden: Are Patterns Consistent Across Countries?. Early Intervention Psych, 19(4), 10.1111/eip.70039
52. Team OW in D, Roser M Definitions of world regions. Our World Data. Available from: https://ourworldindata.org/world-region-map-definitions.
53. Villarroel N, Davidson E, Pereyra-Zamora P, Krasnik A, Bhopal RS. Heterogeneity/granularity in ethnicity classifications project: the need for refining assessment of health status. Eur J Public Health. 2019;29(2):260–266. doi:10.1093/eurpub/cky191
54. Syme SL. The social environment and health. Daedalus. 1994;123(4):79–86.
55. Diez Roux AV. Neighborhoods and health: what do we know? What should we do? Am J Public Health. 2016;106(3):430–431. doi:10.2105/AJPH.2016.303064
56. Diez Roux AV, Mair C. Neighborhoods and health. Ann N Y Acad Sci. 2010;1186(1):125–145. doi:10.1111/j.1749-6632.2009.05333.x
57. Diez-Roux AV. Bringing context back into epidemiology: variables and fallacies in multilevel analysis. Am J Public Health. 1998;88(2):216–222. doi:10.2105/ajph.88.2.216
58. Chaix B. Geographic life environments and coronary heart disease: a literature review, theoretical contributions, methodological updates, and a research agenda. Annu Rev Public Health. 2009;30(1):81–105. doi:10.1146/annurev.publhealth.031308.100158
59. Krieger N. Ecosocial Theory of Disease Distribution. In: Oxford University Press; 2011. doi:10.1093/acprof:oso/9780195383874.003.0007
60. Horsdal HT, Pedersen MG, Schullehner J, et al. Perspectives on environment and health research in Denmark. Scand J Public Health. 2024;52(6):741–751. doi:10.1177/14034948231178076
61. Pearce J, Witten K, Bartie P. Neighbourhoods and health: a GIS approach to measuring community resource accessibility. J Epidemiol Community Health. 2006;60(5):389–395. doi:10.1136/jech.2005.043281
62. Mseke EP, Jessup B, Barnett T. Impact of distance and/or travel time on healthcare service access in rural and remote areas: a scoping review. J Transp Health. 2024;37:101819. doi:10.1016/j.jth.2024.101819
63. Jokela M. Are neighborhood health associations causal? A 10-year prospective cohort study with repeated measurements. Am J Epidemiol. 2014;180(8):776–784. doi:10.1093/aje/kwu233
64. Holmager TLF, Lophaven SN, Mortensen LH, Lynge E. Selective migration and mortality by economic status in lolland-falster, Denmark, 1992–2018. Sci Rep. 2022;12(1):19970. doi:10.1038/s41598-022-24635-2
65. Hedman L, van Ham M, van Ham M, et al. Understanding Neighbourhood Effects: Selection Bias and Residential Mobility. Springer Netherlands. 2011:79–99. doi:10.1007/978-94-007-2309-2_4
66. Diez Roux AV. Social epidemiology: past, present, and future. Annu Rev Public Health. 2022;43(1):79–98. doi:10.1146/annurev-publhealth-060220-042648
67. Chaix B, Merlo J, Chauvin P. Comparison of a spatial approach with the multilevel approach for investigating place effects on health: the example of healthcare utilisation in France. J Epidemiol Community Health. 2005;59(6):517–526. doi:10.1136/jech.2004.025478
68. Diez-Roux AV. Multilevel analysis in public health research. Annu Rev Public Health. 2000;21(1):171–192. doi:10.1146/annurev.publhealth.21.1.171
69. Oakes JM. The (mis)estimation of neighborhood effects: causal inference for a practicable social epidemiology. Soc Sci Med 1982. 2004;58(10):1929–1952. doi:10.1016/j.socscimed.2003.08.004
70. Oakes JM. Invited commentary: repeated measures, selection bias, and effect identification in neighborhood effect studies. Am J Epidemiol. 2014;180(8):785–787. doi:10.1093/aje/kwu231
71. Arcaya MC, Tucker-Seeley RD, Kim R, Schnake-Mahl A, So M, Subramanian SV. Research on neighborhood effects on health in the United States: a systematic review of study characteristics. Soc Sci Med 1982. 2016;168:16–29. doi:10.1016/j.socscimed.2016.08.047
72. Chyn E, Katz LF. Neighborhoods matter: assessing the evidence for place effects. J Econ Perspect. 2021;35(4):197–222. doi:10.1257/jep.35.4.197
73. Foverskov E, White JS, Norredam M, et al. Neighbourhood socioeconomic disadvantage and psychiatric disorders among refugees: a population-based, quasi-experimental study in Denmark. Soc Psychiatry Psychiatr Epidemiol. 2023;58(5):711–721. doi:10.1007/s00127-022-02300-3
74. Jensen NK, Frøslev T, Foverskov E, Glymour M, Sørensen HT, Hamad R. The association of neighborhood socioeconomic characteristics with cardiovascular health: a quasi-experimental study of refugees to Denmark. Health Place. 2023;84:103128. doi:10.1016/j.healthplace.2023.103128
75. Lund RL. From the dark end of the street to the bright side of the road: automated redistricting of areas using physical barriers as dividers of social space. Methodol Innov. 2018;11(3). doi:10.1177/2059799118814386
76. Pedersen CB, Antonsen S, Timmermann A, et al. Urban-rural differences in schizophrenia risk: multilevel survival analyses of individual- and neighborhood-level indicators, urbanicity and population density in a Danish national cohort study. Schizophr Bull Open. 2022;3(1):sgab056. doi:10.1093/schizbullopen/sgab056
77. Meijer M, Engholm G, Grittner U, Bloomfield K. A socioeconomic deprivation index for small areas in Denmark. Scand J Public Health. 2013;41(6):560–569. doi:10.1177/1403494813483937
78. Schneeweiss S, Rassen JA, Brown JS, et al. Graphical depiction of longitudinal study designs in health care databases. Ann Intern Med. 2019;170(6):398–406. doi:10.7326/M18-3079
79. Textor J, van der Zander B, Gilthorpe MS, Liskiewicz M, Ellison GT. Robust causal inference using directed acyclic graphs: the R package “dagitty. Int J Epidemiol. 2016;45(6):1887–1894. doi:10.1093/ije/dyw341
80. Uleman JF, Stronks K, Rutter H, Arah OA, Rod NH. Mapping complex public health problems with causal loop diagrams. Int J Epidemiol. 2024;53(4):dyae091. doi:10.1093/ije/dyae091
81. Dohrenwend BP, Levav I, Shrout PE, et al. Socioeconomic status and psychiatric disorders: the causation-selection issue. Science. 1992;255(5047):946–952. doi:10.1126/science.1546291
82. Hoffmann R, Kröger H, Geyer S. Social causation versus health selection in the life course: does their relative importance differ by dimension of SES? Soc Indic Res. 2019;141(3):1341–1367. doi:10.1007/s11205-018-1871-x
83. Kaufman JS. Statistics, adjusted statistics, and maladjusted statistics. Am J Law Med. 2017;43(2–3):193–208. doi:10.1177/0098858817723659
84. VanderWeele TJ. Mediation analysis: a practitioner’s guide. Annu Rev Public Health. 2016;37(1):17–32. doi:10.1146/annurev-publhealth-032315-021402
85. Pearl J. The causal mediation formula--a guide to the assessment of pathways and mechanisms. Prev Sci off J Soc Prev Res. 2012;13(4):426–436. doi:10.1007/s11121-011-0270-1
 © 2025 The Author(s). This work is published and licensed by Dove Medical Press Limited. The
full terms of this license are available at https://www.dovepress.com/terms
and incorporate the Creative Commons Attribution
- Non Commercial (unported, 4.0) License.
By accessing the work you hereby accept the Terms. Non-commercial uses of the work are permitted
without any further permission from Dove Medical Press Limited, provided the work is properly
attributed. For permission for commercial use of this work, please see paragraphs 4.2 and 5 of our Terms.
© 2025 The Author(s). This work is published and licensed by Dove Medical Press Limited. The
full terms of this license are available at https://www.dovepress.com/terms
and incorporate the Creative Commons Attribution
- Non Commercial (unported, 4.0) License.
By accessing the work you hereby accept the Terms. Non-commercial uses of the work are permitted
without any further permission from Dove Medical Press Limited, provided the work is properly
attributed. For permission for commercial use of this work, please see paragraphs 4.2 and 5 of our Terms.