Back to Journals » International Journal of Chronic Obstructive Pulmonary Disease » Volume 14
Area under the forced expiratory flow-volume loop in spirometry indicates severe hyperinflation in COPD patients
Authors Das N, Topalovic M, Aerts JM, Janssens W ![]()
Received 30 August 2018
Accepted for publication 16 December 2018
Published 14 February 2019 Volume 2019:14 Pages 409—418
DOI https://doi.org/10.2147/COPD.S185931
Checked for plagiarism Yes
Review by Single anonymous peer review
Peer reviewer comments 3
Editor who approved publication: Prof. Dr. Richard Russell
Nilakash Das,1 Marko Topalovic,1 Jean-Marie Aerts,2 Wim Janssens1
1Laboratory of Respiratory Diseases, Department of Chronic Diseases, Metabolism and Ageing, Katholieke Universiteit Leuven, Leuven, Belgium; 2Division of Animal and Human Health Engineering, Department of Biosystems, Katholieke Universiteit Leuven, Leuven, Belgium
Background: Severe hyperinflation causes detrimental effects such as dyspnea and reduced exercise capacity and is an independent predictor of mortality in COPD patients. Static lung volumes are required to diagnose severe hyperinflation, which are not always accessible in primary care. Several studies have shown that the area under the forced expiratory flow-volume loop (AreaFE) is highly sensitive to bronchodilator response and is correlated with residual volume/total lung capacity (RV/TLC), a common index of air trapping. In this study, we investigate the role of AreaFE% (AreaFE expressed as a percentage of reference value) and conventional spirometry parameters in indicating severe hyperinflation.
Materials and methods: We used a cohort of 215 individuals with COPD. The presence of severe hyperinflation was defined as elevated air trapping (RV/TLC >60%) or reduced inspiratory fraction (inspiratory capacity [IC]/TLC <25%) measured using body plethysmography. AreaFE% was calculated by integrating the maximal expiratory flow-volume loop with the trapezoidal rule and expressing it as a percentage of the reference value estimated using predicted values of FVC, peak expiratory flow and forced expiratory flow at 25%, 50% and 75% of FVC. Receiver operating characteristics (ROC) curve analysis was used to identify cut-offs that were used to indicate severe hyperinflation, which were then validated in a separate group of 104 COPD subjects.
Results: ROC analysis identified cut-offs of 15% and 20% for AreaFE% in indicating RV/TLC >60% and IC/TLC <25%, respectively (N=215). On validation (N=104), these cut-offs consistently registered the highest accuracy (80% each), sensitivity (68% and 75%) and specificity (83% and 80%) among conventional parameters in both criteria of severe hyperinflation.
Conclusion: AreaFE% consistently provides a superior estimation of severe hyperinflation using different indices, and may provide a convenient way to refer COPD patients for body plethysmography to address static lung volumes.
Keywords: spirometry, flow-volume loop, air trapping, severe hyperinflation, COPD, area under flow-volume loop
Introduction
Lung hyperinflation is associated with expiratory flow limitation (EFL), which is generally regarded as the pathophysiological hallmark of COPD.1 EFL arises because of the dual effects of airway dysfunction and permanent parenchymal destruction or emphysema, the latter resulting in a reduced recoil elasticity of the lungs. At the end of spontaneous expiration in COPD, the lung compensates for a reduced recoil pressure by acquiring a larger volume than normal to balance the outward recoil of the chest wall. This resetting of the respiratory system’s relaxation volume, often synonymous with functional residual capacity (FRC), to a higher level than in age-matched healthy individuals, is termed static or resting hyperinflation.1 In the case of forced expiration, air trapping is reflected by an increase in the residual volume (RV) within a slightly preserved total lung capacity (TLC). Air trapping at the end of forced expiration is attributed not only to reduced elastic recoil pressure and bronchial narrowing due to airway inflammation, but also to a reduced duration for expiration due to the development of intolerable respiratory discomfort.1,2 Finally, dynamic hyperinflation occurs during periods of increased ventilatory needs, such as exercise, when exhalation may not be completed before the onset of the next breath, causing a progressive increase in air retention, and therefore in the FRC.1,3
Severe hyperinflation leads to high levels of dyspnea, impaired quality of life and reduced exercise capacity in COPD patients. This is highlighted by the evidence that significant improvements are seen in patient symptoms and exercise tolerance after using long-lasting bronchodilators or lung volume reduction surgery.4 A common indicator of hyperinflation is to address the level of air trapping; a ratio of RV to TLC greater than the upper limit of normal (ULN) is used to indicate the presence of air trapping.5,6 Increased RV/TLC is known to be a powerful predictor of mortality in COPD patients,7 and often, a ratio of RV/TLC >60% is used as a criterion for severe hyperinflation and a prerequisite for referral to lung volume reduction surgery.8,9 Another indicator of severe hyperinflation is a severe reduction of resting inspiratory capacity or inspiratory fraction (IC/TLC) when TLC is stable;5 IC/TLC <25% has been shown to be a predictor of mortality,10 exercise impairment and exacerbation in COPD patients.11,12 While these measures are clinically useful for indicating severe hyperinflation, body plethysmography is required to obtain these lung volume ratios and in many clinical situations, such as primary care, access to body plethysmography is unavailable.
Spirometry is a widely used clinical tool that would be of particular interest if it were able to indicate severe hyperinflation. Although spirometry is typically used to characterize airway obstruction, spirometry parameters such as the FEV1 and inspiratory capacity (ICs) are known to be strongly associated with static hyperinflation.13,14 Another parameter that is of interest is the area under the forced or maximal expiratory flow-volume loop (AreaFE), and it has been shown to be very sensitive in assessing bronchoconstriction and bronchodilation.15,16 A 2016 study attempted to quantify the concavity of the maximal expiratory flow-volume loop (FVL) using different parameters involving AreaFE, which strongly correlated with RV/TLC.17
Until now, a detailed investigation has not been carried out to study the value of AreaFE in indicating severe hyperinflation. In this study, we hypothesized that AreaFE% (AreaFE expressed as a percentage of the reference value) is a good indicator of severe hyperinflation, described by increased air trapping and reduced inspiratory fraction, as it represents a holistic way of quantifying FVL. Our main objective was to investigate AreaFE% and to compare it to conventional spirometry parameters in predicting RV/TLC >60% and IC/TLC <25% in COPD patients.
Materials and methods
Study subjects
We selected the 215 COPD individuals (cohort A) from the Leuven COPD cohort (NCT00858520).18,19 These individuals underwent complete pulmonary function testing including post-bronchodilator spirometry, body plethysmography and diffusion capacity at the time of enrollment. All subjects were Caucasian with a minimum age of 50 years and with a smoking history of at least 15 pack-years. We further selected a separate group of 104 COPD individuals from the Leuven COPD cohort to validate our findings (cohort B). The study was conducted in accordance with the Helsinki Declaration and approved by the ethical committee of University Hospital Leuven (ML11081). All study participants gave their signed informed consent.
Pulmonary function tests
All pulmonary function tests were performed with standardized equipment (Masterlab, Erich Jeager, Würzburg, Germany) by respiratory technicians, according to the European Respiratory Society criteria.20 Pre- and post-bronchodilator spirometry, airway resistance, lung volumes and diffusion capacity measurements are expressed as percentages of healthy reference values according to Quanjer et al.21 COPD patients were identified based on the post-bronchodilator ratio of FEV1 to FVC or FEV1/FVC (Tiffeneau–Pinelli index) <0.7. The severity of the disease was based on FEV1 expressed as a percentage (FEV1%) of the healthy reference value, as described in the GOLD classification.22
Severe hyperinflation indicators
We obtained the ratios RV/TLC and IC/TLC from body plethysmography. Hyperinflation was defined as the presence of air trapping with RV/TLC > ULN.5,6 Severe hyperinflation indices were then defined as elevated air-trapping levels with RV/TLC >60% and diminished inspiratory fraction with IC/TLC <25%.9,10
Estimation of AreaFE%
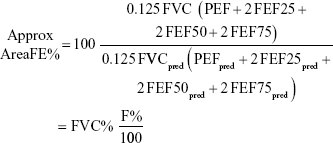
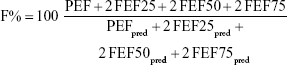
Since body plethysmography is performed pre-bronchodilator intake, we used spirometry data from pre-bronchodilator maneuvers. We selected the one with the largest sum of FEV1 and FVC among all acceptable and repeatable maneuvers.20 The spirometry data were sampled at a uniform frequency of 125 Hz and all flow-volume measurement points were used to reconstruct the FVL. We integrated this FVL with all measurement points using the trapezoidal rule to obtain AreaFE and expressed it as a percentage of the reference value (Figure 1). Reference AreaFE was estimated from the reference FVL determined by predicted values of FVC (FVCpred), peak expiratory flow (PEFpred), forced expiratory flow at 25% (FEF25pred), 50% (FEF50pred) and 75% of FVC (FEF75pred). We state the formula for reference AreaFE as follows:
|
|
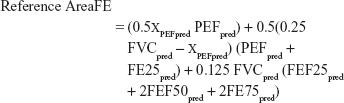
 | Figure 1 Area under the forced expiratory FVL is determined by integrating all flow-volume measurement points of the observed FVL. |
where xPEFpred is the volume when PEFpred occurs. Linear interpolation between points at FEF25pred and FEF50pred was used to find xPEFpred. Finally, the ratio of AreaFE to reference AreaFE was expressed as a percentage or AreaFE%. We developed a script in Python to calculate AreaFE% for all subjects.
Statistical analysis
In cohort A, we explored the linear correlation of AreaFE% and conventional spirometry parameters such as FEV1%, FVC%, FEV1/FVC, PEF%, ICs% and forced expiratory flow between 25% and 75% of FVC expressed as percentage predicted (FEF25%–75%) with RV/TLC and IC/TLC. Receiver operating characteristics (ROC) analysis was used to identify cut-offs for spirometry parameters in predicting RV/TLC > ULN, RV/TLC >60% and IC/TLC <25%. To achieve a trade-off between sensitivity and specificity, the cut-offs were chosen to minimize the sum of (1 – Sensitivity)2 and (1 – Specificity)2. These cut-offs were independently validated in cohort B. Bland–Altman plots were generated to study the agreement between AreaFE% against RV/TLC and IC/TLC. One-way ANOVA was used to evaluate the differences between parameters across GOLD stages. The significance level was set at 0.01 and all analyses were carried out in RStudio software.23
Ethics approval and informed consent
The study was conducted in accordance with the Helsinki Declaration and approved by the ethical committee of University Hospital Leuven (ML11081). All study participants gave their signed informed consent.
Results
Baseline characteristics
The baseline characteristics of cohort A are shown in Table 1. This cohort comprised 42 GOLD I, 65 GOLD II, 52 GOLD III and 56 GOLD IV individuals. In this cohort, RV/TLC increases while IC/TLC decreases with severity of COPD from GOLD I to GOLD IV. Air trapping (RV/TLC > ULN) was prevalent in 61% of the subjects while severe hyperinflation was indicated in 34% and 41% of the patients according to RV/TLC >60% and IC/TLC <25%, respectively (Figure 2). No patient in GOLD I stage exhibited air trapping, while more than 80% of patients in GOLD IV had severe hyperinflation in both criteria. AreaFE% was highest for GOLD I (79% ± 18%) subjects and it decreased significantly (P<0.001) across all GOLD stages (Figure 3). The baseline characteristics of cohort B (n=104) were similar to those of cohort A in clinical characteristics, with no patient in GOLD I and II displaying severe hyperinflation in both criteria.
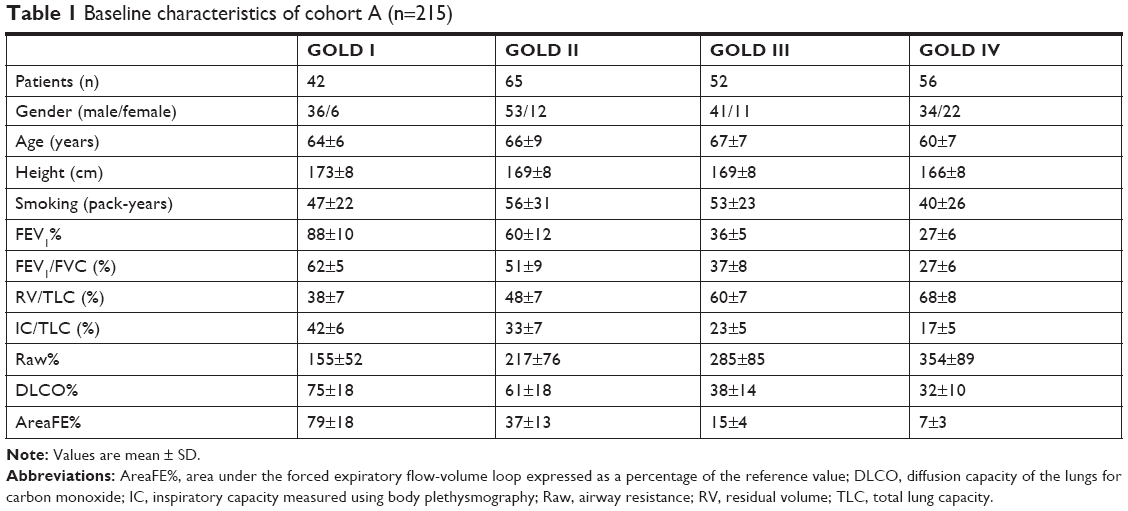 | Table 1 Baseline characteristics of cohort A (n=215) |
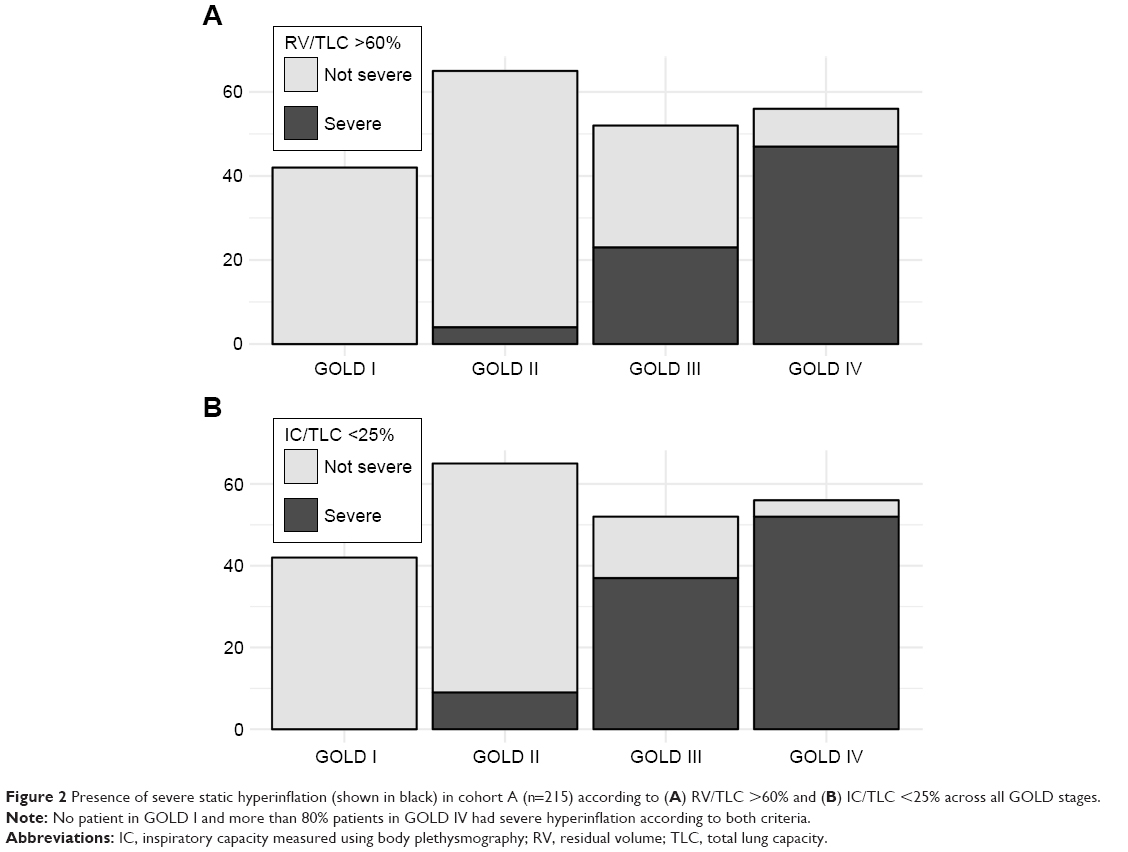 | Figure 2 Presence of severe static hyperinflation (shown in black) in cohort A (n=215) according to (A) RV/TLC >60% and (B) IC/TLC <25% across all GOLD stages. |
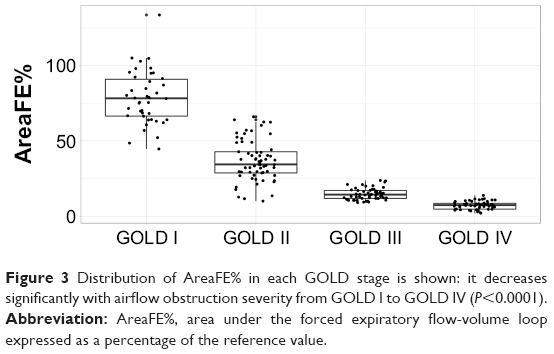 | Figure 3 Distribution of AreaFE% in each GOLD stage is shown: it decreases significantly with airflow obstruction severity from GOLD I to GOLD IV (P<0.0001). |
Correlation analysis
FEV1% was most correlated with RV/TLC and IC/TLC, followed closely by AreaFE%, in cohort A (n=215). However, when we excluded the patients from GOLD I, as they did not exhibit hyperinflation (sub-cohort A with GOLD II, III and IV, n=173), FEV1% (r=-0.79, P<0.001) and AreaFE% were equally matched as the highest correlated parameters with RV/TLC. The same trend was observed in the case of correlations with IC/TLC, with AreaFE% and FEV1% registering a correlation of 0.8 (P<0.001) each (Table 2).
 | Table 2 Correlations of AreaFE% and conventional spirometry parameters with RV/TLC and IC/TLC in sub-cohort A (GOLD II, III and IV subjects from cohort A, n=173) |
ROC curve analysis
Since no subject in GOLD I displayed air trapping (RV/TLC > ULN), we only considered sub-cohort A (GOLD II, III and IV, n=173) for ROC analysis. This pointed to 23% (AUC =0.95, P<0.001) as the cut-off for AreaFE% in indicating air trapping (RV/TLC > ULN), 13% (AUC =0.91, P<0.001 [Figure 4A]) for severe air trapping (RV/TLC >60%) and 17% (AUC =0.91, P<0.001 [Figure 4B]) for reduced inspiratory fraction (IC/TLC <25%). On validation in sub-cohort B (GOLD II, III and IV patients of cohort B, n=75), AreaFE% demonstrated the best metrics (accuracy =81%, sensitivity =75%, specificity =81%), followed by FEV1% (accuracy =72%, sensitivity =75%, specificity =69%), when indicating RV/TLC > ULN. AreaFE% also emerged as the parameter with the highest accuracy in indicating RV/TLC >60%. Further, AreaFE%, ICs% and FEV1/FVC were equally matched as the parameters with highest sensitivity (68%), while AreaFE%, FVC% and FEF25%–75% had equal highest specificity (83%). In predicting IC/TLC <25%, AreaFE% again registered the highest accuracy (80%) along with FEF25%–75% during validation. In addition, AreaFE%, ICs%, and FEV1/FVC demonstrated the highest sensitivity (75%), while AreaFE% and FEV1% established the highest specificity (79%). To summarize, AreaFE% consistently demonstrated the best validation performance not only in indicating hyperinflation, but also in predicting severe hyperinflation in both criteria (Table 3) among conventional spirometry parameters.
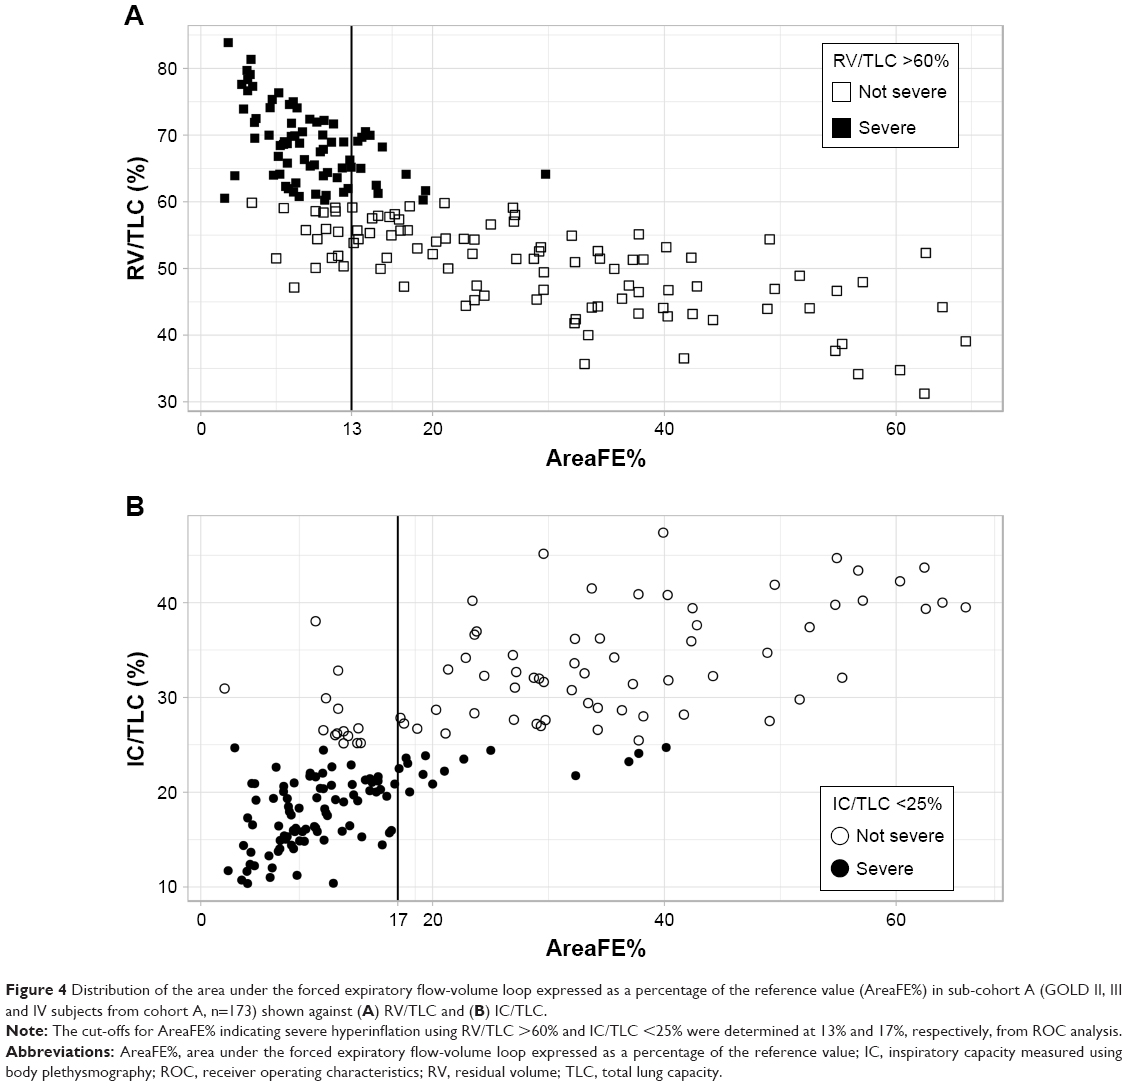 | Figure 4 Distribution of the area under the forced expiratory flow-volume loop expressed as a percentage of the reference value (AreaFE%) in sub-cohort A (GOLD II, III and IV subjects from cohort A, n=173) shown against (A) RV/TLC and (B) IC/TLC. |
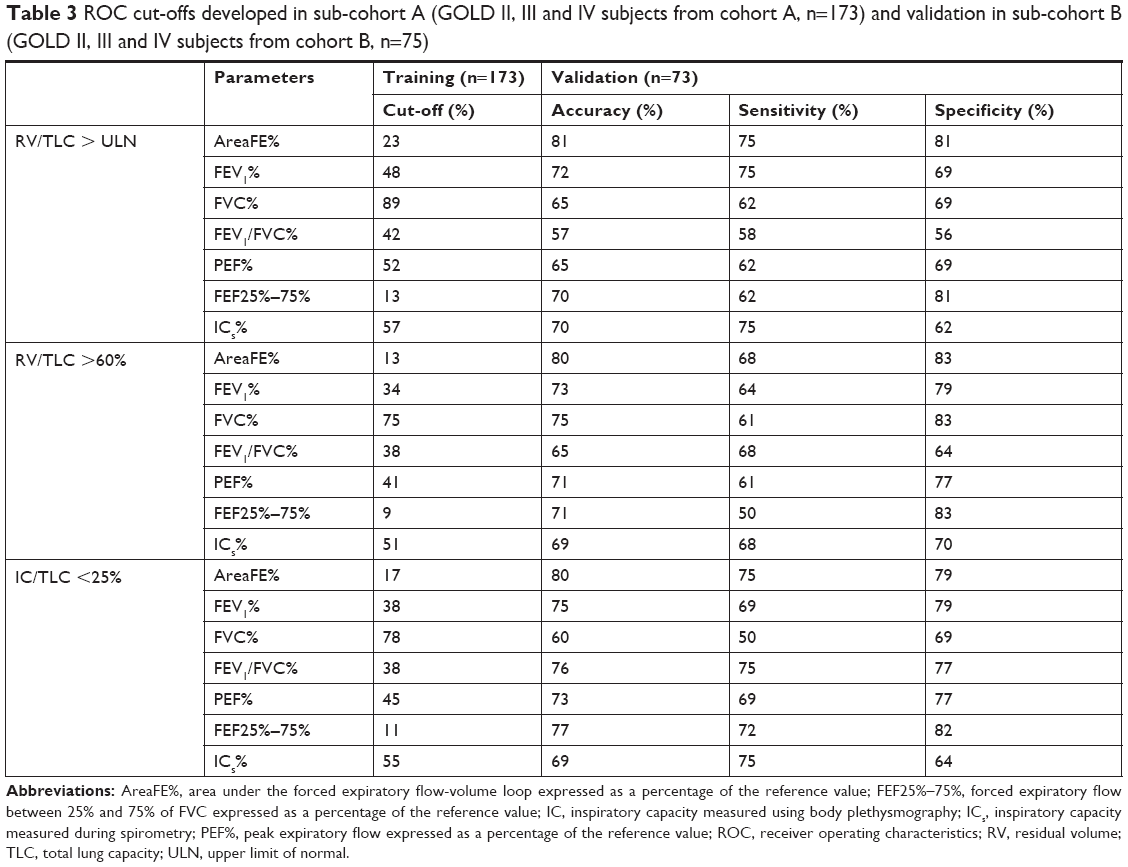 | Table 3 ROC cut-offs developed in sub-cohort A (GOLD II, III and IV subjects from cohort A, n=173) and validation in sub-cohort B (GOLD II, III and IV subjects from cohort B, n=75) |
Bland–Altman plots
Since AreaFE% was negatively correlated with RV/TLC, we plotted the difference of (100 – AreaFE%) and RV/TLC against their mean (Figure 5A). The differences showed a bias of 21.4% (95% CI 19.9% to 22.8%) with the width between the 95% limits of agreement (LOA) at 38%. On plotting the difference of AreaFE% and IC/TLC against their mean (Figure 5B), the bias was only -4% (95% CI -2.5% to -5.5%) for a similar width (39%) between the LOA. Both differences showed an increasing trend with the means, while the variability did not show a consistent pattern.
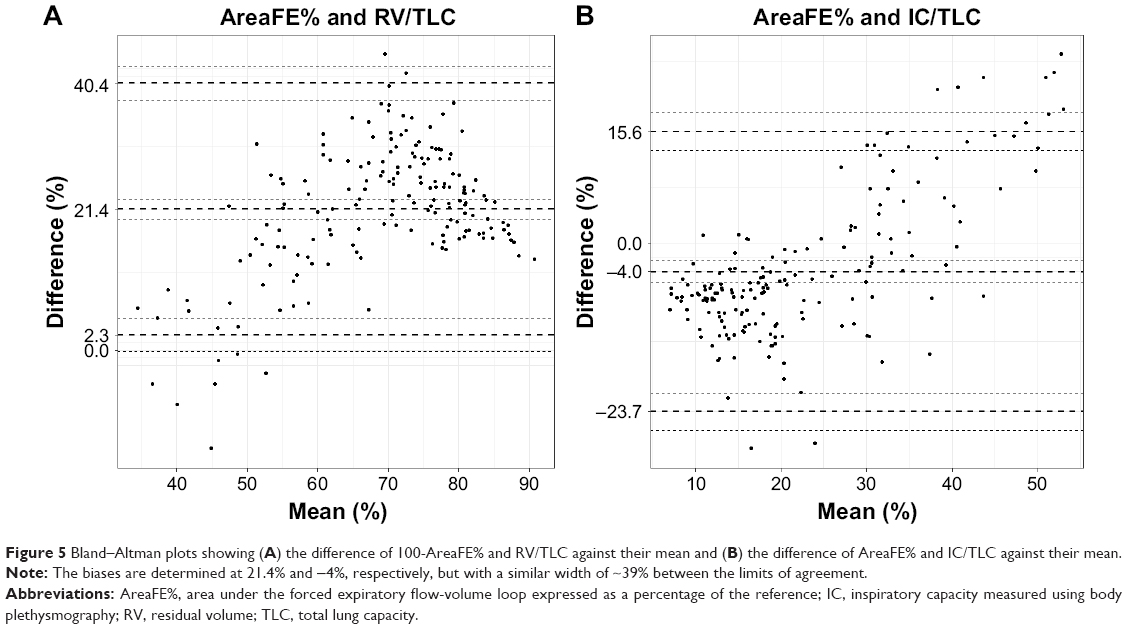 | Figure 5 Bland–Altman plots showing (A) the difference of 100-AreaFE% and RV/TLC against their mean and (B) the difference of AreaFE% and IC/TLC against their mean. |
Components of AreaFE%
We also studied the components that make up AreaFE% in sub-cohort A (n=173). If we neglect the portion of expiratory FVL between TLC and PEF, a simple approximate formula for AreaFE% can be derived as follows, using the trapezoidal rule:
|
|
where:
|
|
The approximate AreaFE% can reasonably describe the actual AreaFE% (R2=0.96, slope of regression line =0.93), which is obtained by integrating the actual FVL and dividing it by the reference AreaFE. We further analyzed the contribution of FVC% and F% in estimating RV/TLC and IC/TLC using univariate linear regression. While F% explained more than 60% variance for both RV/TLC and IC/TLC, FVC% contributed to 54% variance for RV/TLC but only to 24% variance for IC/TLC. Further, the correlation between FVC% and F% was noted at 0.65 (P<0.01) and the correlation between F% and FEF25%–75% was noted at 0.88 (P<0.001).
Discussion
In this study, we investigated the role of AreaFE% and conventional spirometry parameters in predicting severe hyperinflation, defined by elevated air trapping (RV/TLC >60%) and reduced inspiratory fraction (IC/TLC <25%), in COPD patients. From our investigation, we infer that FEV1% and AreaFE% were equally matched as the best univariate predictors of RV/TLC and IC/TLC. However, validation with ROC cut-offs revealed that AreaFE% provided the best prediction not only in indicating air trapping (RV/TLC > ULN) but also in estimating severe hyperinflation in both criteria in a cohort of GOLD II, III and IV subjects. Other parameters, although tied with AreaFE% in one criterion or the other, did not exhibit the same consistency. For instance, while FEF25%–75% was similarly tied with AreaFE% using the IC/TLC <25% criterion, it performed worse when the RV/TLC >60% criterion was considered (accuracy =71% vs 80% for AreaFE%). Thus, we can conclude that a single parameter such as AreaFE%, which consistently provides a superior prediction of severe hyperinflation using different criteria, carries an advantage in clinical practice compared to conventional spirometry parameters.
Although our investigation is the first of its kind, the correlation of AreaFE% is in close alignment with a study that reported the correlation of area of obstruction with RV/TLC.17 A major strength of AreaFE% is that it combines information from several parameters such as FVC% and F% (Equation 3), where F% is an amalgamation of different flow parameters and is highly correlated with FEF25%–75%. It was interesting to observe that the contribution of FVC% and F% to RV/TLC and IC/TLC was statistically significant whereas their intra-correlation was low. While a low FVC% is known to be indicative of hyperinflation (increased RV within a limited TLC),24 FEF25%–75% is often associated with small airway obstruction, pointing to increased airway resistance and air trapping following forced expiration.25,26 AreaFE% provides a convenient way to package all of this information as a single parameter.
We can also perceive AreaFE% as a ratio that quantifies the concavity of the FVL, since it is the defined as actual area divided by the reference area of FVL. In the past, several attempts were made to quantify the concavity of the FVL,17,27–29 but the chosen reference points were arbitrary at best. In our study, the parameter AreaFE% describes the concavity relative to the FVL of a healthy individual and, thus, it has the added advantage that it provides a measure of concavity that is developing progressively from a reference healthy individual. This way of quantifying concavity proves to be a sensitive marker for EFL that arises from the combined effects of airway dysfunction and permanent parenchymal destruction (emphysema),1 the latter being responsible for reduced elastic recoil pressure, resulting in an elevated RV and end-expiratory lung volume.1,30 Past studies have confirmed that COPD patients with less concave FVL were also less hyperinflated at rest and during exercise.27
In our study, we excluded the patients from GOLD I from correlations and ROC analysis because GOLD assessment guidelines consider them rather as a risk group for clinical COPD.31 Moreover, no subject in GOLD I satisfied the criteria for hyperinflation (RV/TLC > ULN) in our training and validation data set. From this, we can infer that subjects in GOLD stage I (FEV1% >80%) could be ruled out for severe hyperinflation. We considered ROC analysis over multivariate classification because we were only interested in comparing the detection ability of individual parameters for which cut-offs could be easily calculated. We also noted that spirometry-measured inspiratory capacity (ICs), which is often associated with resting hyperinflation,32 did not feature as the best candidate, although it was highly correlated with RV/TLC and IC/TLC. A possible reason could be that expiratory reserve volume is underestimated or overestimated owing to the instability at the beginning of the maximal inspiratory maneuver preceding forced expiration,33 which was also observed in 15% of our subjects.
Apart from the limited sample size, a major limitation of our study was that the reference value for AreaFE does not exist. We estimated it using predicted reference values of FVC, PEF, FEF25, FEF50 and FEF75. Although the actual reference value may slightly differ from our estimated value, reference equations for AreaFE need to be developed by considering a healthy population of all ages, genders, heights and ethnicity to completely validate our results. Another drawback is that our study focused only on severe hyperinflation in resting phases while it completely ignored dynamic hyperinflation, which may occur concurrently or independently. Moreover, our study rests upon the assumption that RV/TLC >60% and IC/TLC <25% are accurate indices of severe hyperinflation. However, these indices are not standardized and may be biased, as FRC and IC in body plethysmography are effort dependent.34 Body plethysmography may also overestimate thoracic gas volume in patients with severe and very severe COPD owing to incomplete equilibration of mouth and alveolar pressures, heterogeneity of alveolar pressure swings during the panting maneuver and excessive compliance of the extrathoracic airway.5 A ground-truth estimate of severe hyperinflation could have been obtained by observing increased air trapping in computed tomography, which was unavailable in this study.35 Finally, our investigation sheds little light on the physiological determinants of severe hyperinflation but, instead, provides a way to quantify it.
Conclusion
Our study has potential implications because it demonstrates that AreaFE% has a diagnostic role in indicating severe hyperinflation in COPD patients using spirometry alone. Since it provides a superior estimation of severe hyperinflation using different criteria, it may carry an advantage in clinical practice compared to conventional parameters such as FEV1%. In primary care where static lung-volume measurements are unavailable, this may help to identify a population at risk that should be referred for body plethysmography. It is still to be studied whether AreaFE% may help to identify COPD patients who may benefit more from long-lasting bronchodilators or even lung-volume reduction. Moreover, it is to be ascertained whether changes in AreaFE% upon treatment may better reflect the real benefits of intervention than traditional changes on FEV1%.
Acknowledgments
The authors would like to thank Geert Celis and co-workers (Respiratory Division, University Hospital Leuven, Belgium) for helping in the collection of patient data and their technical support in extracting data from the MasterScreen. This study is supported by a strategic basic (SB) research fellowship of the Research Foundation–Flanders (FWO).
An abstract of this paper was presented at the American Thoracic Society 2018 International Conference, May 18–23, 2018, San Diego, CA, USA, as a poster presentation with interim findings; the abstract has been published.36
Author contributions
ND had full access to all of the data in the study and takes responsibility for the integrity of the data and the accuracy of the data analysis. ND, MT and WJ contributed to the conception and acquisition of data. All authors contributed toward data analysis, drafting and critically revising the paper, gave final approval of the version to be published, and agreed to be accountable for all aspects of the work.
Disclosure
The authors report no conflicts of interest in this work.
References
O’Donnell DE, Laveneziana P. Physiology and consequences of lung hyperinflation in COPD. Eur Respir Rev. 2006;15:61–67. | ||
Leith DE, Brown R. Human lung volumes and the mechanisms that set them. Eur Respir J. 1999;13(2):468–472. | ||
Gagnon P, Guenette JA, Langer D, et al. Pathogenesis of hyperinflation in chronic obstructive pulmonary disease. Int J Chron Obstruct Pulmon Dis. 2014;9:187–201. | ||
Thomas M, Decramer M, O’Donnell DE. No room to breathe: the importance of lung hyperinflation in COPD. Prim Care Respir J. 2013;22(1):101–111. | ||
O’Donnell DE, Webb KA, Neder JA. Lung hyperinflation in COPD: applying physiology to clinical practice. COPD Res Pract. 2015;1(1):4. | ||
Smith BM, Hoffman EA, Basner RC, Kawut SM, Kalhan R, Barr RG. Not all measures of hyperinflation are created equal: lung structure and clinical correlates of gas trapping and hyperexpansion in COPD: the multi-ethnic study of atherosclerosis (MESA) COPD study. Chest. 2014;145(6):1305–1315. | ||
Nishimura K, Izumi T, Tsukino M, Oga T. Dyspnea is a better predictor of 5-year survival than airway obstruction in patients with COPD. Chest. 2002;121(5):1434–1440. | ||
Fishman A, Martinez F, Naunheim K, et al. A randomized trial comparing lung-volume-reduction surgery with medical therapy for severe emphysema. N Engl J Med. 2003;348(21):2059–2073. | ||
Caviezel C. Lung volume reduction surgery in selected patients with severe emphysema: significant benefit with low peri-operative risk. J Xiangya Med. 2017;2(11):48. | ||
Casanova C, Cote C, de Torres JP, et al. Inspiratory-to-total lung capacity ratio predicts mortality in patients with chronic obstructive pulmonary disease. Am J Respir Crit Care Med. 2005;171(6):591–597. | ||
Albuquerque AL, Nery LE, Villaça DS, et al. Inspiratory fraction and exercise impairment in COPD patients gold stages II–III. Eur Respir J. 2006;28(5):939–944. | ||
Zaman M, Mahmood S, Altayeh A. Low inspiratory capacity to total lung capacity ratio is a risk factor for chronic obstructive pulmonary disease exacerbation. Am J Med Sci. 2010;339(5):411–414. | ||
Dykstra BJ, Scanlon PD, Kester MM, Beck KC, Enright PL. Lung volumes in 4,774 patients with obstructive lung disease. Chest. 1999;115(1):68–74. | ||
Ferguson GT. Why does the lung hyperinflate? Proc Am Thorac Soc. 2006;3(2):176–179. | ||
Sovijarvi AR. Flow-volume response to inhaled metacholine in asthmatics; comparison of area under the curve (AFV) with conventional parameters. Eur J Respir Dis. 1986;68(SUPPL. 143):18–21. | ||
Zapletal A, Hladíková M, Chalupová J, Svobodová T, Vávrová V. Area under the maximum expiratory flow-volume curve – a sensitive parameter in the evaluation of airway patency. Respiration. 2008;75(1):40–47. | ||
Lee J, Lee CT, Lee JH, et al. Graphic analysis of flow-volume curves: a pilot study. BMC Pulm Med. 2016;16(1):18. | ||
Lambrechts D, Buysschaert I, Zanen P, et al. The 15q24/25 susceptibility variant for lung cancer and chronic obstructive pulmonary disease is associated with emphysema. Am J Respir Crit Care Med. 2010;181(5):486–493. | ||
Topalovic M, Exadaktylos V, Peeters A, et al. Computer quantification of airway collapse on forced expiration to predict the presence of emphysema. Respir Res. 2013;14(1):131. | ||
Miller MR, Hankinson J, Brusasco V, et al. Standardisation of spirometry. Eur Respir J. 2005;26(2):319–338. | ||
Quanjer PH, Tammeling G, Cotes JE, Pedersen OF, Peslin R, Yernault J-C. Standardized lung function testing: official statement of European Respiratory Society. Eur Respir J Suppl. 1993;16:1–100. | ||
Vogelmeier CF, Criner GJ, Martinez FJ, et al. Global strategy for the diagnosis, management, and prevention of chronic obstructive lung disease 2017 report. GOLD executive summary. Am J Respir Crit Care Med. 2017;195(5):557–582. | ||
RStudio Team. Integrated Development for R. Boston, MA: RStudio; 2016 Available from: http://www.rstudio.com. Accessed March 24, 2017. | ||
Sorkness RL, Bleecker ER, Busse WW, et al. Lung function in adults with stable but severe asthma: air trapping and incomplete reversal of obstruction with bronchodilation. J Appl Physiol. 2008;104(2):394–403. | ||
McFadden ER, Linden DA. A reduction in maximum mid-expiratory flow rate. A spirographic manifestation of small airway disease. Am J Med. 1972;52(6):725–737. | ||
McDonough JE, Yuan R, Suzuki M, et al. Small-airway obstruction and emphysema in chronic obstructive pulmonary disease. N Engl J Med. 2011;365(17):1567–1575. | ||
Varga J, Casaburi R, Ma S, et al. Relation of concavity in the expiratory flow-volume loop to dynamic hyperinflation during exercise in COPD. Respir Physiol Neurobiol. 2016;234:79–84. | ||
Mead J. Analysis of the configuration of maximum expiratory flow-volume curves. J Appl Physiol Respir Environ Exerc Physiol. 1978;44(2):156–165. | ||
Ohwada A, Takahashi K. Concave pattern of a maximal expiratory flow-volume curve: a sign of airflow limitation in adult bronchial asthma. Pulm Med. 2012;2012:797495. | ||
Deesomchok A, Webb KA, Forkert L, et al. Lung hyperinflation and its reversibility in patients with airway obstruction of varying severity. COPD. 2010;7(6):428–437. | ||
Vestbo J, Hurd SS, Agustí AG, et al. Global strategy for the diagnosis, management, and prevention of chronic obstructive pulmonary disease: gold executive summary. Am J Respir Crit Care Med. 2013;187(4):347–365. | ||
Celli B, Zuwallack R, Wang S, Kesten S. Improvement in resting inspiratory capacity and hyperinflation with tiotropium in COPD patients with increased static lung volumes. Chest. 2003;124(5):1743–1748. | ||
Guenette JA, Chin RC, Cory JM, Webb KA, O’Donnell DE. Inspiratory capacity during exercise: measurement, analysis, and interpretation. Pulm Med. 2013;2013:1–13. | ||
Criée CP, Sorichter S, Smith HJ, et al. Body plethysmography – its principles and clinical use. Respir Med. 2011;105(7):959–971. | ||
Miller WT, Chatzkel J, Hewitt MG. Expiratory air trapping on thoracic computed tomography: a diagnostic subclassification. Ann Am Thorac Soc. 2014;11(6):874–881. | ||
Das N, Topalovic M, Aerts JM, Janssens W. Area Under Forced Expiratory Flow-Volume Loop in Spirometry Is a Suitable Marker for Severe Static Hyperinflation in COPD Patients [abstract]. Am J Respir Crit Care Med. 2018;197:A3912. Available from: https://www.atsjournals.org/doi/abs/10.1164/ajrccm-conference.2018.197.1_MeetingAbstracts.A3912. Accessed January 31, 2019. |
 © 2019 The Author(s). This work is published and licensed by Dove Medical Press Limited. The
full terms of this license are available at https://www.dovepress.com/terms
and incorporate the Creative Commons Attribution
- Non Commercial (unported, 3.0) License.
By accessing the work you hereby accept the Terms. Non-commercial uses of the work are permitted
without any further permission from Dove Medical Press Limited, provided the work is properly
attributed. For permission for commercial use of this work, please see paragraphs 4.2 and 5 of our Terms.
© 2019 The Author(s). This work is published and licensed by Dove Medical Press Limited. The
full terms of this license are available at https://www.dovepress.com/terms
and incorporate the Creative Commons Attribution
- Non Commercial (unported, 3.0) License.
By accessing the work you hereby accept the Terms. Non-commercial uses of the work are permitted
without any further permission from Dove Medical Press Limited, provided the work is properly
attributed. For permission for commercial use of this work, please see paragraphs 4.2 and 5 of our Terms.