Back to Journals » Drug Design, Development and Therapy » Volume 12
Are laboratory parameter (biomarker) values similar to the healthy volunteer reference range in all patient populations?
Authors Brott DA, Goodman MJ, Hermann RP, Merz M, Calvo R ![]() , Poorkhalkali N, Kiazand A
, Poorkhalkali N, Kiazand A
Received 9 May 2018
Accepted for publication 27 June 2018
Published 6 September 2018 Volume 2018:12 Pages 2757—2773
DOI https://doi.org/10.2147/DDDT.S173671
Checked for plagiarism Yes
Review by Single anonymous peer review
Peer reviewer comments 2
Editor who approved publication: Dr Tuo Deng
David A Brott,1 Michael J Goodman,1 Richard P Hermann,1 Michael Merz,2 Roser Calvo,1 Nadereh Poorkhalkali,3 Alexandre Kiazand1
1Patient Safety, Safety Science, AstraZeneca Pharmaceuticals, Gaithersburg, MD, USA; 2Patient Safety, Safety Science, AstraZeneca Pharmaceuticals, Webel, Germany; 3Patient Safety, Safety Science, AstraZeneca Pharmaceuticals, Gothenburg, Sweden
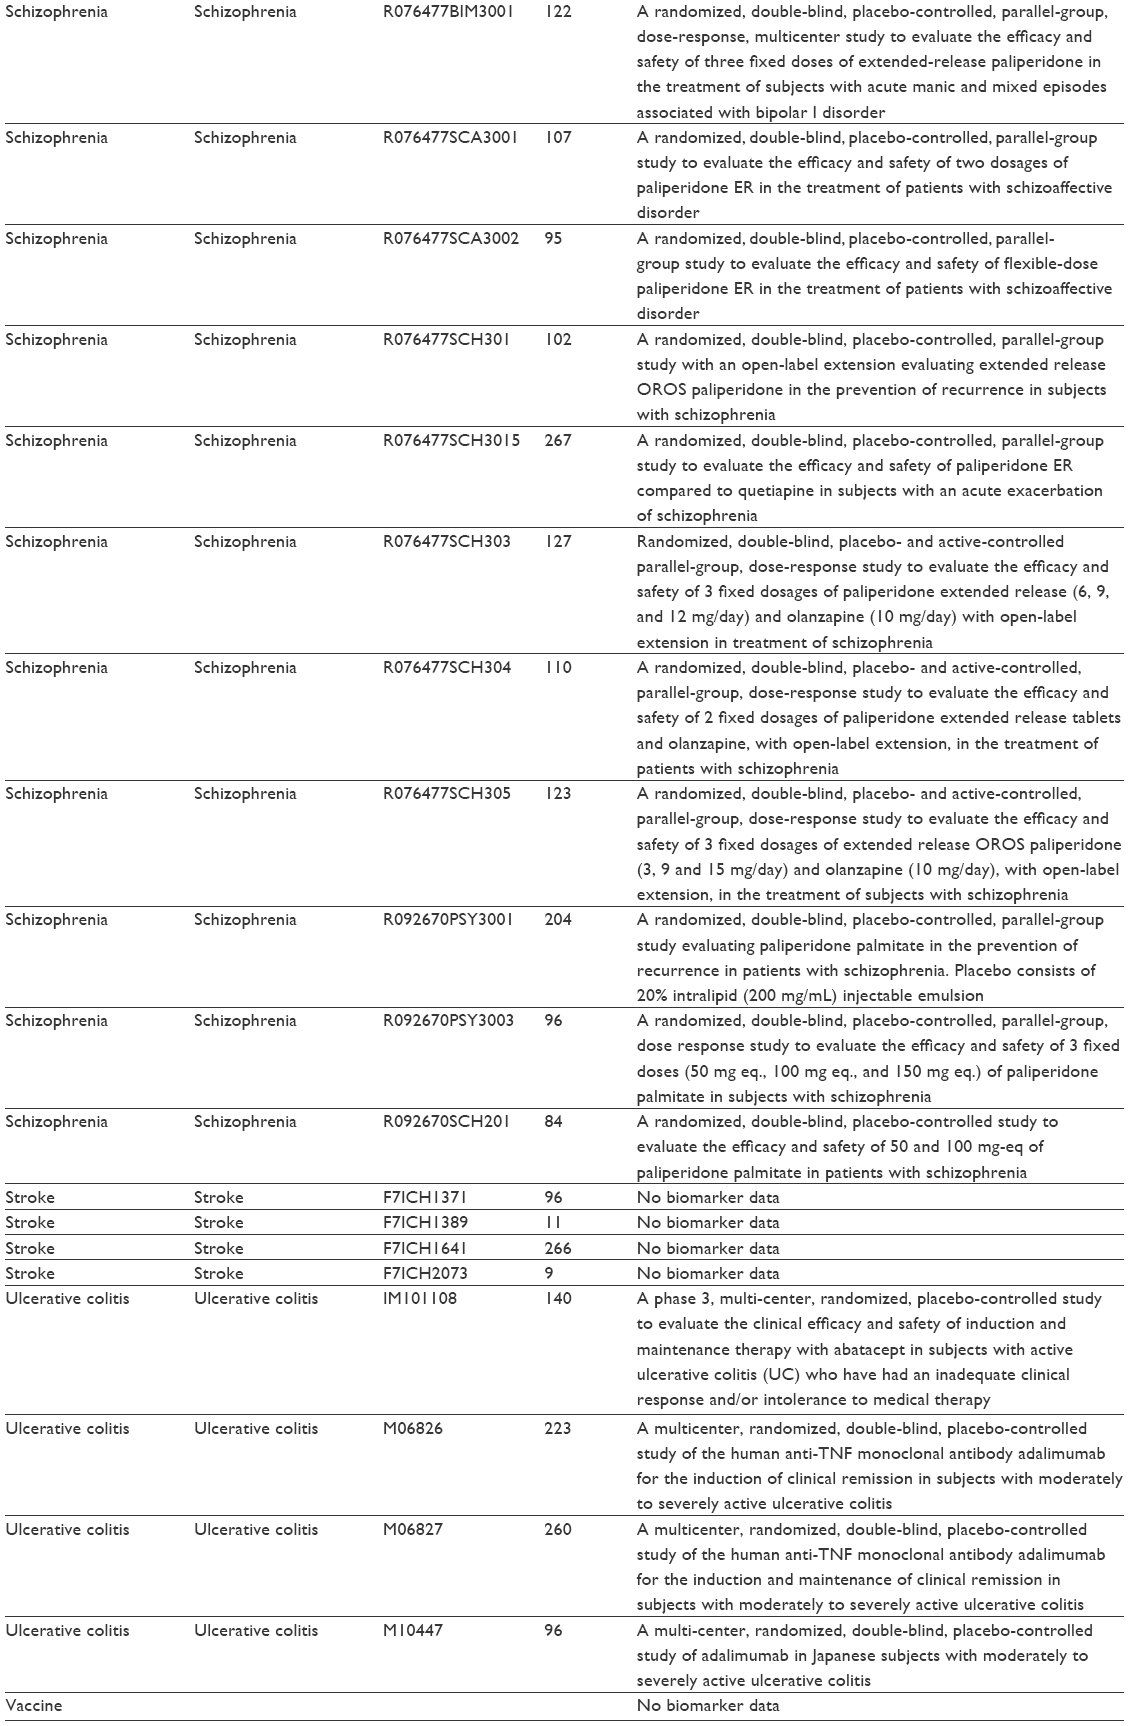
Background: Liver biomarkers alanine aminotransferase (ALT) and bilirubin in patients with hepatitis are above the healthy volunteer reference range (HVRR) at baseline (prior to receiving the clinical trial medication). Discussions continue as how to best distinguish drug-induced liver injury in patients with abnormal baseline values participating in clinical trials. This study investigated if other baseline routine clinical safety biomarkers (lab parameters) are different from the HVRR.
Materials and methods: Clinical trial data (TransCelerate dataset) from placebo and standard of care treated patients were compared to the HVRR using a 10% threshold above or below the HVRR to classify a lab parameter in a patient population as potentially different from the HVRR at baseline. The TransCelerate dataset, batch 4, contained data from patients with Alzheimer’s, asthma, COPD, cardiovascular disease, diabetes, hidradenitis, hypercholesterolemia, rheumatoid arthritis, schizophrenia, stroke, and ulcerative colitis. A subset of the 200 biomarkers in TransCelerate were evaluated in this pilot: glucose, platelet count, neutrophil count, ALT, aspartate aminotransferase (AST), and bilirubin.
Results: Glucose was potentially higher than the HVRR in patients with diabetes, COPD, cardiovascular disease, hypercholesterolemia, and schizophrenia. At least one or more of the hematology and hepatic biomarkers were different from the HVRR in at least one patient population, except bilirubin. All the patient populations, except Alzheimer’s and asthma, had at least one biomarker that was higher than the HVRR.
Summary: The routine biomarkers evaluated in this pilot study demonstrated that not all lab parameters in patient populations are similar to the HVRR. Further efforts are needed to determine which biomarkers are different from the HVRR and how to evaluate the biomarkers in patient populations for detecting drug-induced altered lab values in clinical trials.
Keywords: patient populations, reference range, healthy volunteer, biomarkers
Introduction
Clinical safety signals (adverse drug reaction: ADR) in drug development are typically recorded using Medical Dictionary for Regulatory Activities terms and a severity score based on Common Terminology Criteria for Adverse Events (CTCAE) grade or a similar scoring method. The CTCAE grades for many routine lab parameters are based on the healthy volunteer reference range (HVRR) at the site doing the sample analysis. For example, severity scores for the liver biomarker alanine aminotransferase (ALT) are based on the upper limit of normal (ULN) of the reference range with grade one being >1–3 times ULN, grade two being >3–5 times ULN, grade three being >5–20 times ULN, and grade four being >20 times ULN. The HVRR is calculated so that 95% of all healthy volunteers are within the range and that only 2.5% of the subjects would have values higher than the ULN and 2.5% of the subjects would have values lower than the lower limits of normal (LLN). However, it is known that most patients with hepatitis C, liver metastases, or non-alcoholic steatohepatitis (NASH) have ALT levels above the ULN at baseline (prior to receiving the clinical trial medication).1–4 These findings have led to the current controversy of how to detect drug-induced liver injury (DILI) in clinical trials for patients with elevated ALT levels at baseline.5
Determining that baseline ALT values in patients with hepatitis C are different from the healthy volunteer reference range was relatively straightforward as less than 1% of the patients had ALT values less than or equal to the ULN while more than 33% of the patients had ALT levels greater than three times the ULN.4 Given that the biopharmaceutical industry develops drugs for a wide range of indications, it is vital to ensure that the data collected during clinical development are utilized and interpreted appropriately in order to correctly identify patients with ADRs and adequately accounting for patients with high values due to the disease or disease progression. A large dataset would be needed to determine if a patient population(s) has a different baseline reference range than the HVRR currently used in clinical trials. Real world datasets such as Truven MarketScan contain large quantities of demographic and health care utilization data but very little routine lab data and therefore are not applicable for this effort. TransCelerate BioPharma Inc is a non-profit organization with a mission to collaborate across the biopharmaceutical research and development community to identify, prioritize, design and facilitate the implementation of solutions for delivery of new medicines. One workstream initiated by this consortium focuses on the formation of a placebo and standard of care (PSoC) database containing routine safety lab data from clinical trials across the biopharmaceutical industry. Batch 4 of the dataset contains lab data from more than 20,000 subjects spread across multiple disease populations. In this pilot study, the dataset was used to determine if routine safety lab parameters were consistently similar to the HVRR or if, similar to ALT in hepatitis patients, there were lab parameters in a patient population that are different from the HVRR.
Materials and methods
Dataset
Data were selected from batch 4 of the TransCelerate BioPharma PSoC dataset, which is designed to act as a historical control to facilitate development of new drug products. A full description of PSoC is contained in a White Paper published by the collaborative.6 Briefly, contributing companies provide data from the PSoC control arms of completed studies in standard format. Member companies of the consortia have access to the dataset, in which all subjects are deidentified. Internal review board or ethics committee review was done by each individual company before initiation of their clinical trial. At present, each collaborator holds a copy of the data (it is not stored on the cloud nor freely accessible to the scientific community).
Therefore, the PSoC database incorporates a large volume of Good Clinical Practices (GCP)-compliant clinical trial data (comprised of both placebo and standard of care) to facilitate the development of innovative drug products.
Baseline date was defined as the minimum laboratory day (lbdy) in a study data tabulation model (SDTM). If an individual had more than one value for a specific test on the baseline date, one of the values was randomly selected by assigning a random number from a uniform distribution and choosing the minimum random number. Only a single baseline value from each subject was used in this study, even though many subjects had longitudinal samples.
There are more than 200 different lab parameters within the TransCelerate dataset but only six lab parameters were evaluated to determine if lab parameters in PSoC patient populations were similar to the HVRR. The lab parameters selected for analysis in this study are routinely used in most clinical trials across patient populations: glucose, platelets, neutrophils, ALT, aspartate aminotransferase (AST), and bilirubin.
Data analysis
Reference ranges may be different within and between studies as they are determined at the lab doing the sample analysis. To eliminate the influence of different reference ranges, all lab values were normalized to the ULN by dividing the value by the ULN and were normalized to the lower limit of normal (LLN) by dividing by the LLN, on an individual sample basis.
All data processing was done in SAS Enterprise Guide Version 7.15 on the AZ SAS Grid installation. Data for this paper comes from two SDTM tables: LB (laboratory) and DM (demographics).
Box plots were generated using SAS. The horizontal axis was the condition. The vertical axis was the lab value normalized to ULN. The box plots contain the mean, median, interquartile range, upper and lower 95% CI and outliers. A lab parameter in a patient population was deemed potentially different from the HVRR if greater than 10% of the lab values from the patient population were above the ULN or below the LLN. The 10% threshold is four times higher than the expected percentage (2.5%), based on the definition of HVRR and was selected to minimize the risk of false positives (classifying a lab parameter as different from the HVRR).
Results
Studies
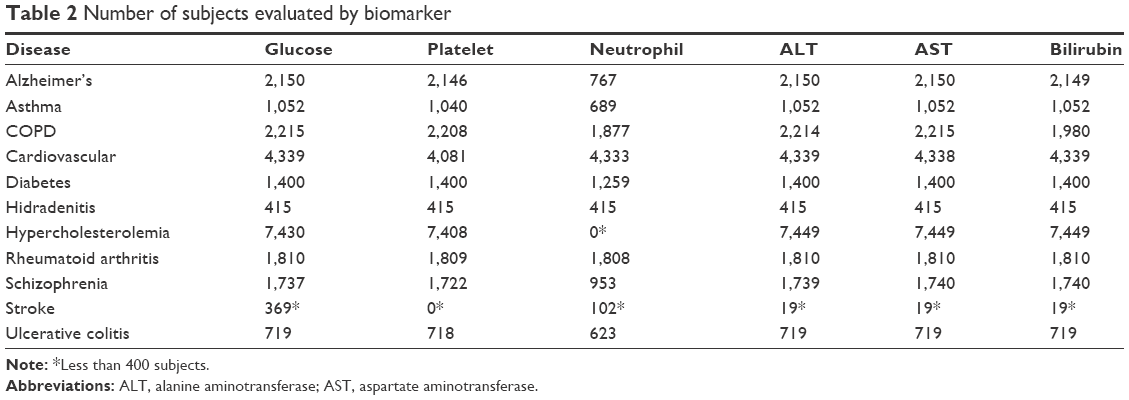
There are 82 clinical trials in the TransCelerate database, batch 4. The vaccine patient population consisting of one clinical trial did not have any lab data and so this patient population could not be evaluated in this study. The remaining 81 clinical trials are divided amongst 11 different patient populations: Alzheimer’s, asthma, COPD, cardiovascular disease, diabetes, hidradenitis, hypercholesterolemia, rheumatoid arthritis, schizophrenia, stroke and ulcerative colitis (Table 1).
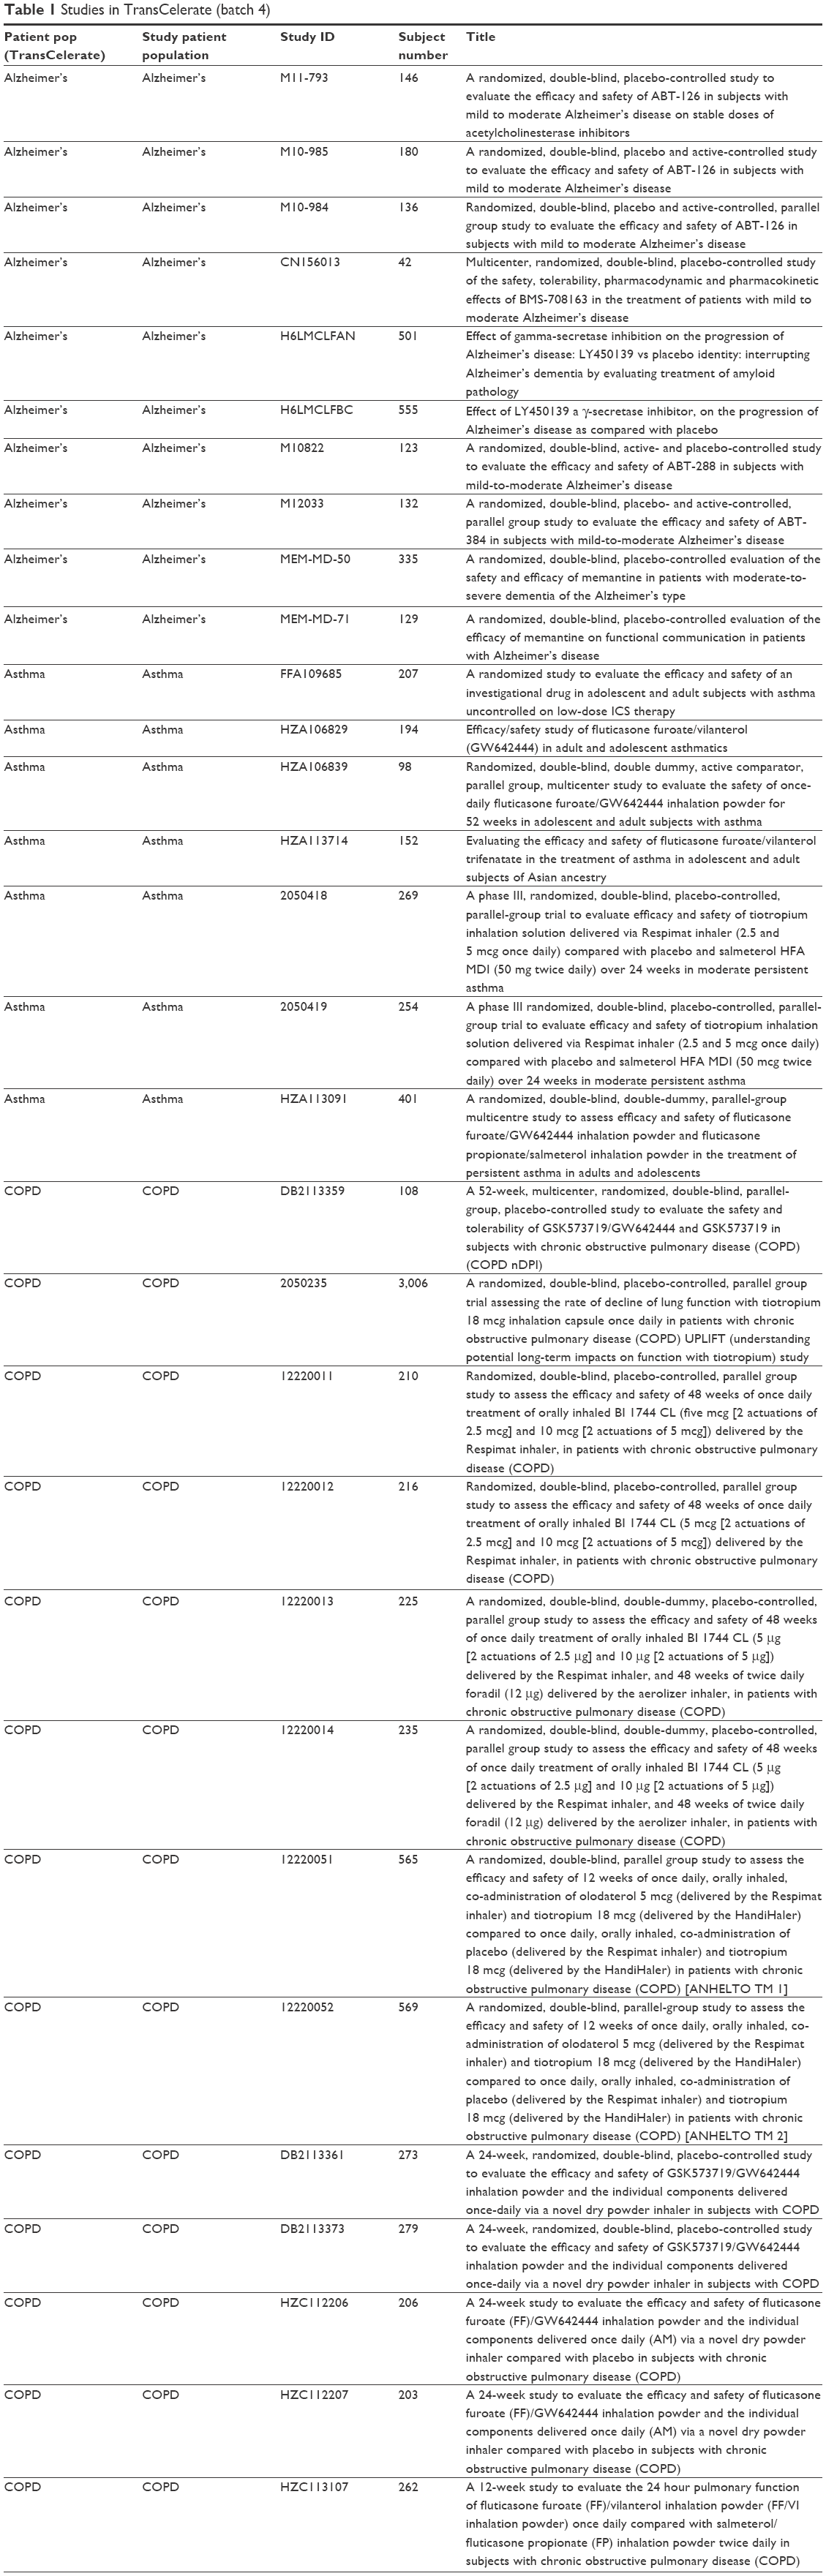   | Table 1 Studies in TransCelerate (batch 4) |
Within each broad indication, the patient population characterization is of relevance, in terms of both the type of disease (eg, cardiovascular disease) and the stage of disease (eg, rheumatoid arthritis). For example, the cardiovascular population consisted of a variety of conditions: deep vein thrombosis (DVT), hypertension and atherosclerosis/coronary artery disease (CAD). The DVT indication (two clinical trials) was the highest contributor in terms of number of patients (3,511 out of 4,380) within the cardiovascular disease patient population. Although it is recognized that the different subpopulations could have very different values within a lab parameter, for purposes of this pilot study the three cardiovascular disease patient subpopulations were kept as one population. Similarly, among the 13 rheumatoid arthritis clinical trials, many consisted of patients with moderate to severe disease but at least one study enrolled patients with low to moderate rheumatoid arthritis. Although it is acknowledged that there could be lab value differences between subjects across different stages of the disease, for this pilot study all rheumatoid arthritis subpopulations were kept as one patient population.
The distribution of sample numbers across studies was compared within each condition to determine if a clinical trial could potentially have a disproportionate impact on determining if a lab parameter was different from the HVRR. In this regard, the only two patient populations of potential concern were cardiovascular and hypercholesterolemia. The cardiovascular patient population had more than 50% of the patients in 1 of the five studies while all of the hypercholesterolemia patient population were in one study. Although the impact of a majority of subjects being from one clinical trial has the potential to skew the results, for the purpose of this pilot study the cardiovascular disease and hypercholesterolemia patient populations were acceptable.
Study and patient numbers
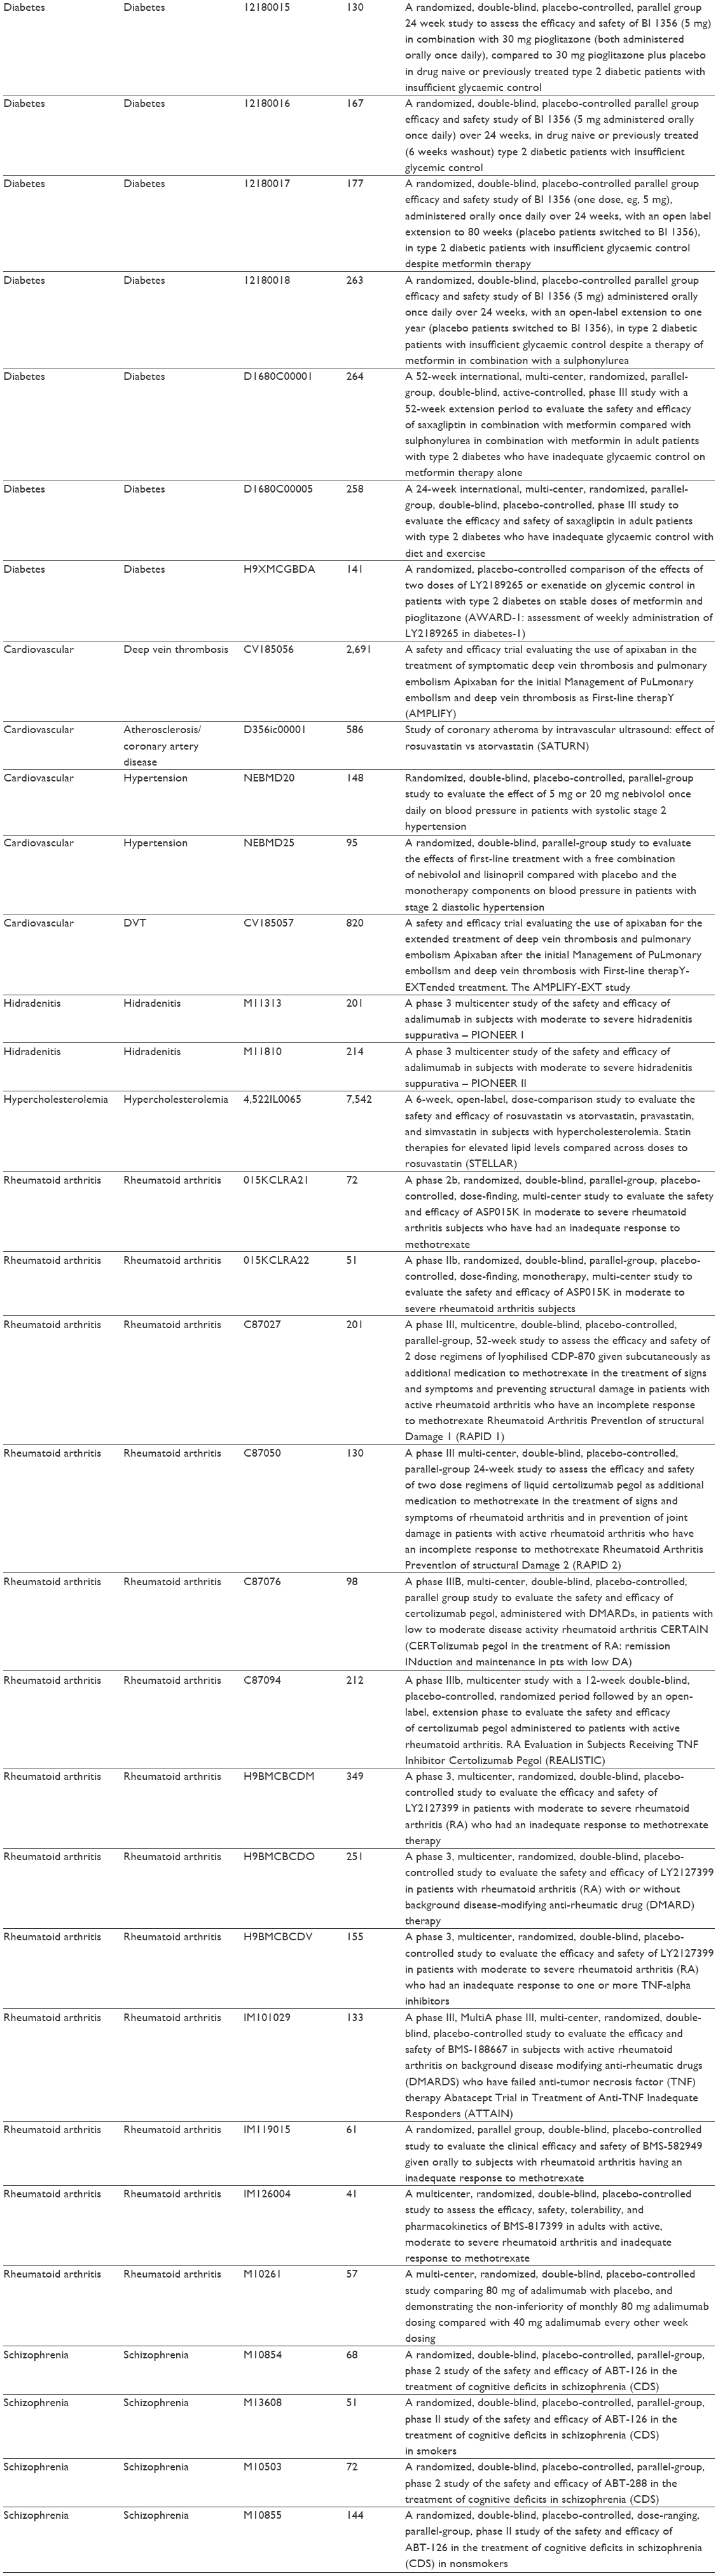
To determine if the patient population reference range for a lab parameter is potentially different from the HVRR for the same lab parameter, it is important to have sufficient numbers of biomarker sampled patients. The stroke population had 369 subjects with glucose values, while more than half of the other lab parameters evaluated had fewer than 100 subjects (Table 2). Due to the low number of subjects with a lab value (<400) and a high variability in subject numbers for each lab parameter (0–369) the stroke patient population was excluded from further analysis. Any lab parameter with data from less than 400 subjects was not evaluated and interpreted.
 | Table 2 Number of subjects evaluated by biomarker |
Some lab parameters were evaluated in only a subset of the patients. For example, neutrophils were evaluated in only a third of the patients with Alzheimer’s. These parameters were further evaluated in this study only if the lab parameter was measured in a sufficient overall number of subjects (400; Table 2).
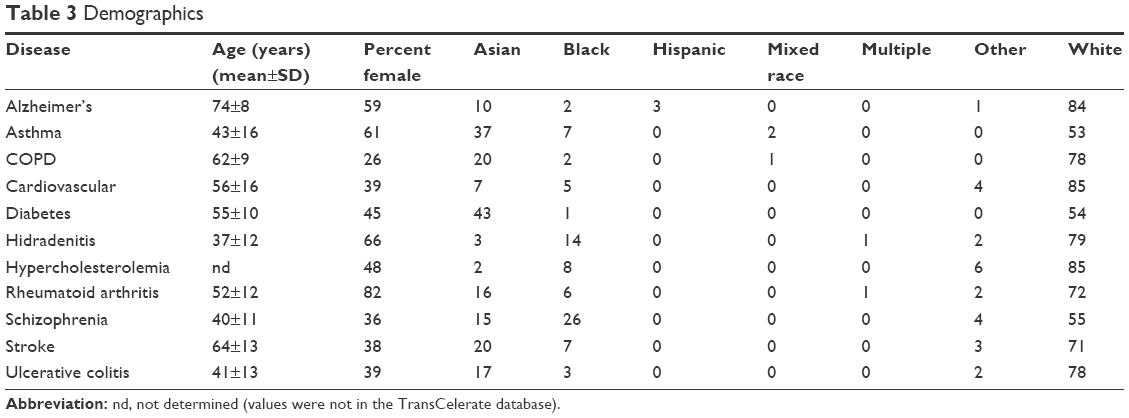
Demographics
Demographics are different in the various patient populations, as would be expected (Table 3). Of the 10 patient populations reported in this study, the youngest patient populations with the mean age in the 30s–40s were those with hidradenitis, asthma, schizophrenia and ulcerative colitis, while the Alzheimer’s population was the oldest with a mean age of 74 years. The rheumatoid arthritis patient population had the highest percentage of females with 82% and the COPD population had the lowest percentage of females with 26%.
 | Table 3 Demographics |
Endocrine – glucose
Half (5 out of 10) of the patient populations had glucose values higher than the healthy volunteer reference range: COPD, cardiovascular disease, diabetes, hypercholesterolemia, and schizophrenia (Figure 1). As expected, the mean glucose value was highest in patients with diabetes at 1.41±0.35×ULN (mean±SD) and 63% of the samples being above the ULN. All of the patient populations except ulcerative colitis had subjects with greater than 2×ULN with some subjects being greater than 4×ULN.
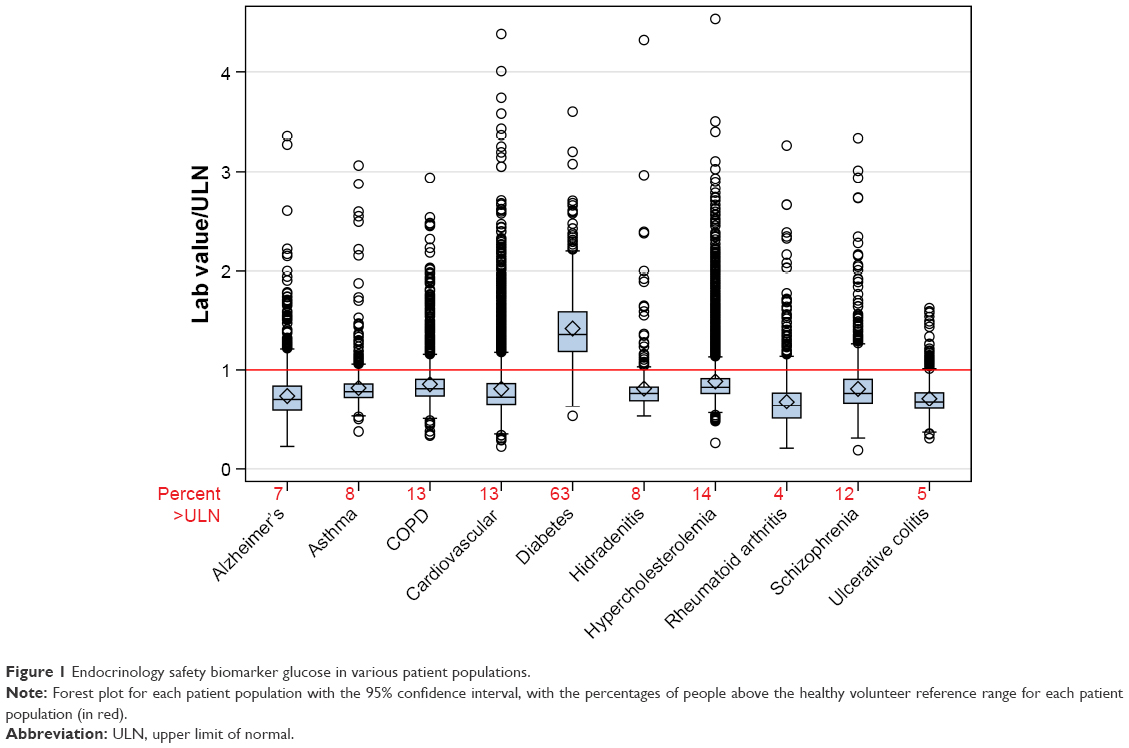 | Figure 1 Endocrinology safety biomarker glucose in various patient populations. |
Hematology – platelet and neutrophil counts
None of the patient populations were considered different from the HVRR for decreased neutrophils or decreased platelets (Figures 2 and 3, percentages not shown). However, neutrophil and platelet counts were increased compared to the HVRR in patients with rheumatoid arthritis and ulcerative colitis and neutrophils alone were increased in patients with hidradenitis.
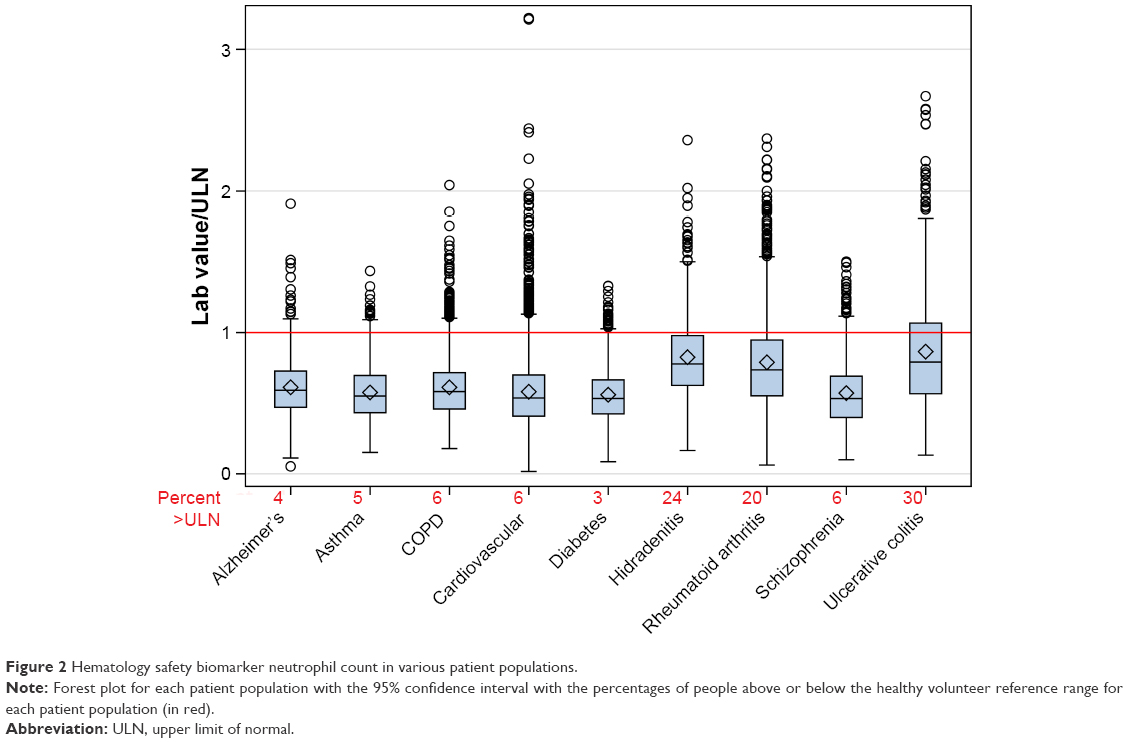 | Figure 2 Hematology safety biomarker neutrophil count in various patient populations. |
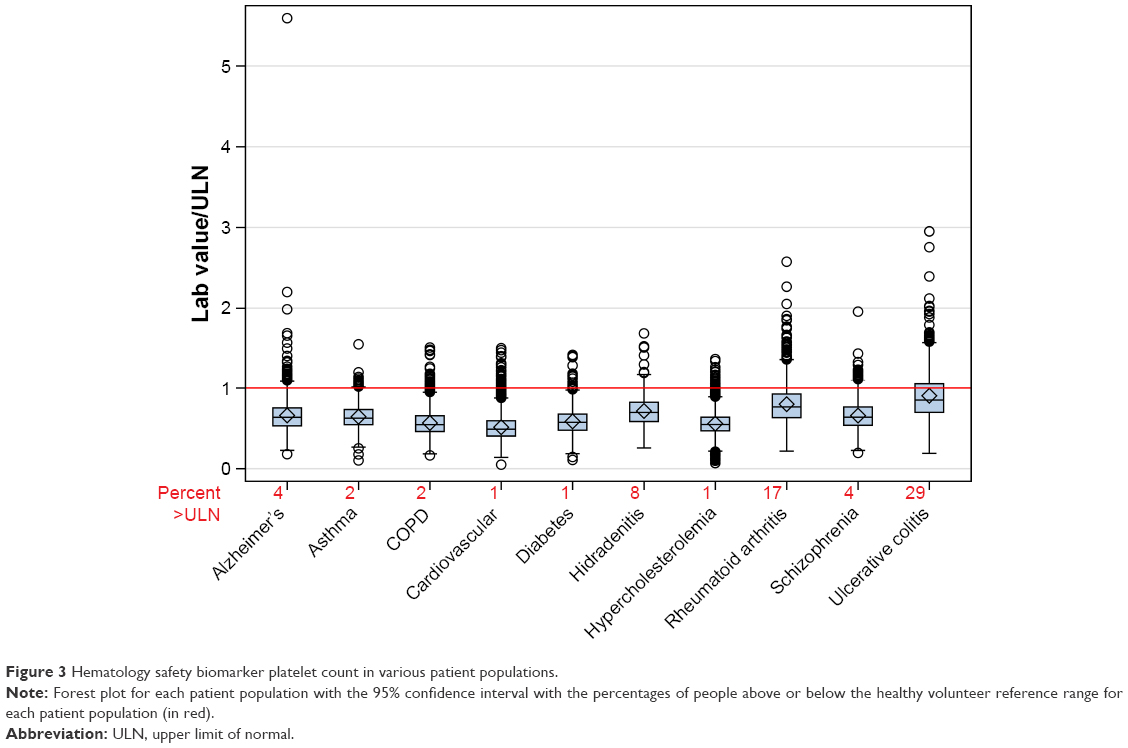 | Figure 3 Hematology safety biomarker platelet count in various patient populations. |
Hepatic – ALT, AST, and bilirubin
ALT was higher than the HVRR in four of the ten patient populations: diabetes, hypercholesterolemia, rheumatoid arthritis. and schizophrenia (Figure 4) with the ALT being greater than 10×ULN in some hypercholesterolemia patients. ALT levels were as high as 10×ULN in patients with hypercholesterolemia and most patient populations had subjects with levels greater than 3×ULN.
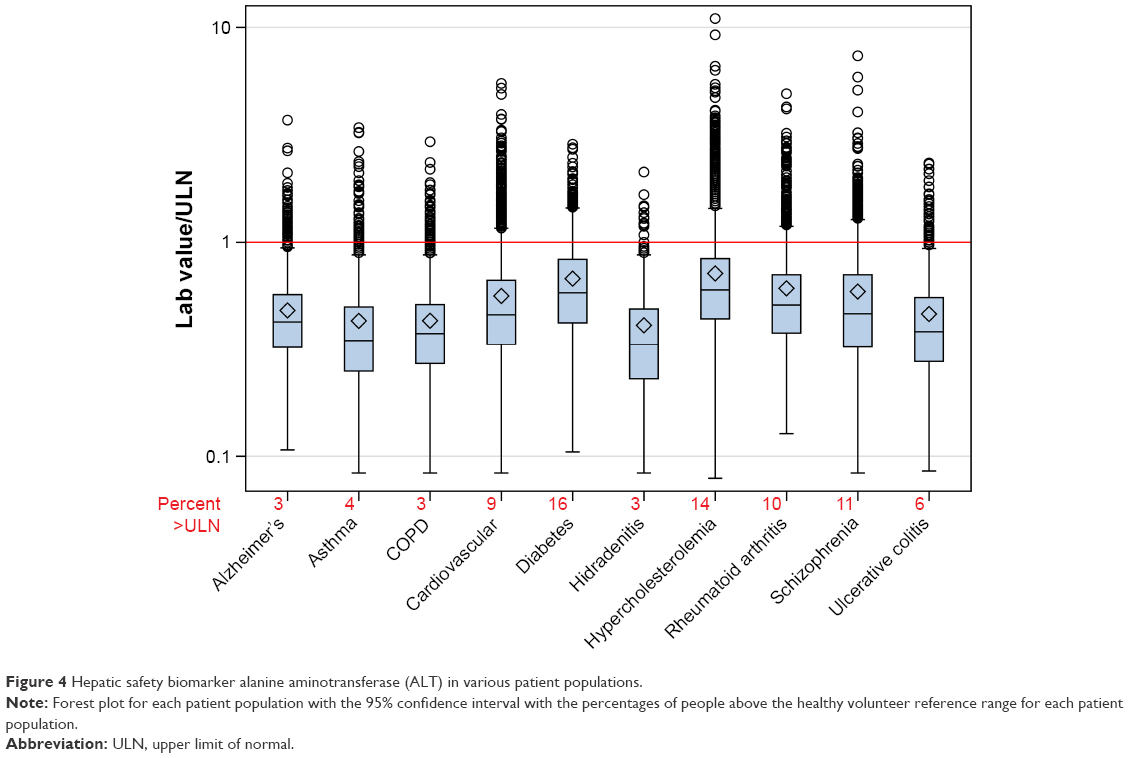 | Figure 4 Hepatic safety biomarker alanine aminotransferase (ALT) in various patient populations. |
AST was higher than the HVRR in only the hypercholesterolemia patients with the values being up to approximately 5×ULN (Figure 5). AST levels were as high as 10×ULN in patients with cardiovascular disease and several patient populations had subjects with levels greater than 3×ULN.
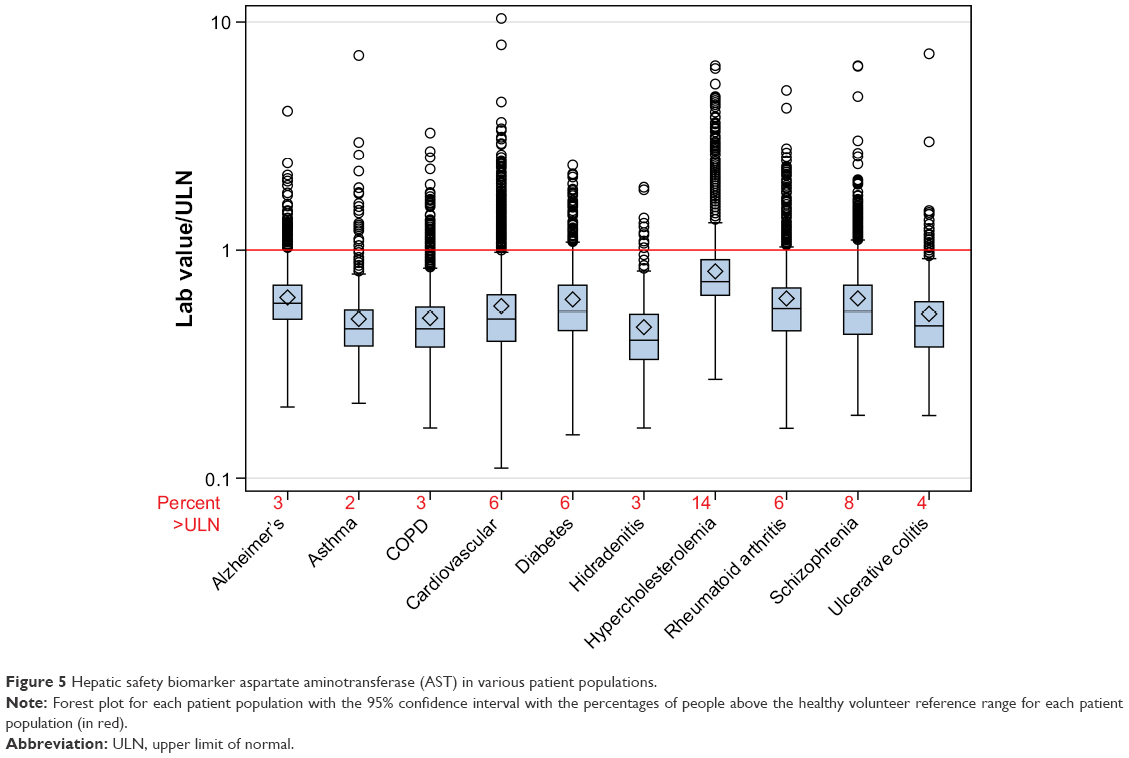 | Figure 5 Hepatic safety biomarker aspartate aminotransferase (AST) in various patient populations. |
Bilirubin was similar to the HVRR in all ten of the patient populations (Figure 6). However, most patient populations had subjects with bilirubin greater than 2×ULN.
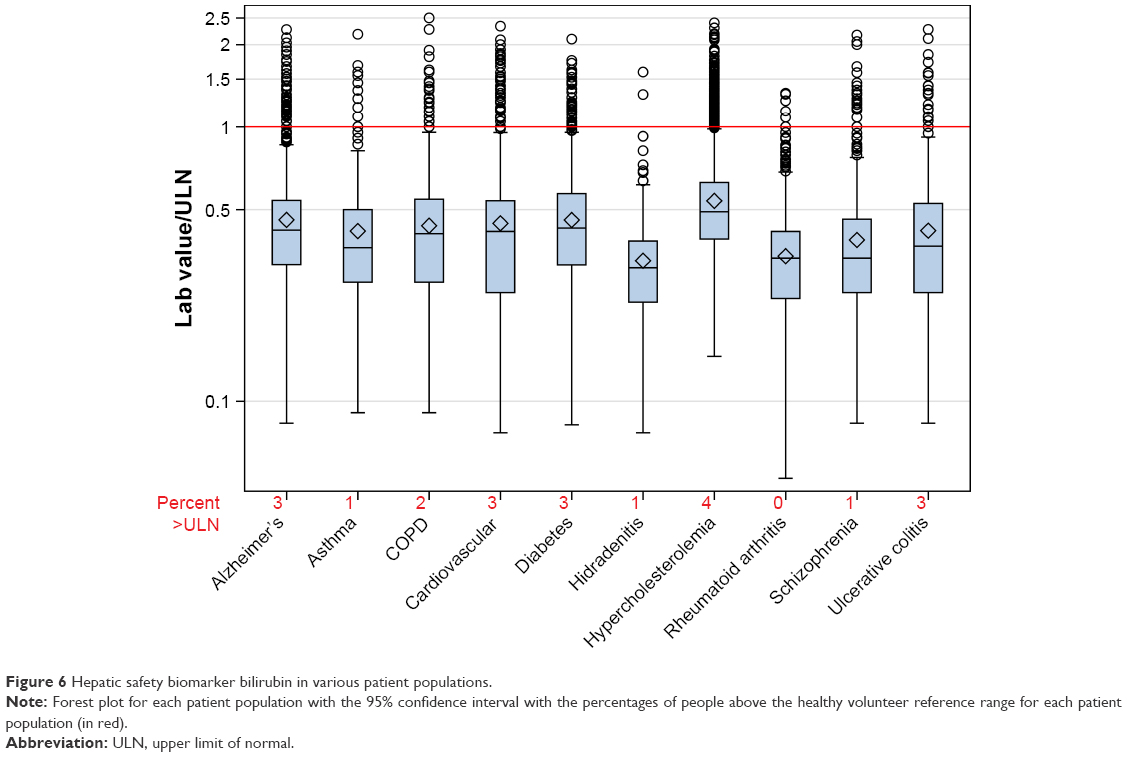 | Figure 6 Hepatic safety biomarker bilirubin in various patient populations. |
Differences from healthy volunteer reference ranges
All patient populations except Alzheimer’s and asthma had at least one lab parameter deemed potentially different from the HVRR and all lab parameters except bilirubin were deemed potentially different in at least one patient population (Table 4). Both patients with hypercholesterolemia and rheumatoid arthritis had three of the lab parameters potentially different from the HVRR. Patients with hypercholesterolemia had increased glucose, ALT and AST levels, whereas patients with rheumatoid arthritis had increased platelet count, neutrophil count and ALT.
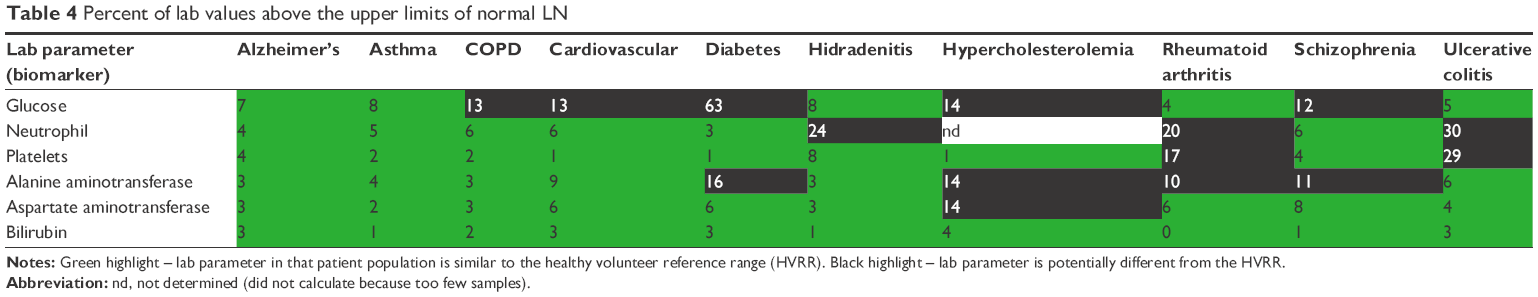 | Table 4 Percent of lab values above the upper limits of normal LN |
For the lab parameters evaluated in this pilot study using the cutoff of 10% of the subjects having values greater than the ULN, 25% (15 out of 60) of the lab parameters analyzed in the various patient populations were higher than the HVRR. Approximately 10% of the lab values would still be potentially higher than the HVRR if using a higher cutoff of 20% of the values greater the ULN.
Discussion
The objective of this pilot study was to determine if routine safety lab parameters were similar to the HVRR or if like ALT in NASH or oncology patient populations, other lab parameters are potentially different from the HVRR.
The TransCelerate dataset consisting of clinical trial data from across pharmaceutical companies contained lab data from enough subjects (>400) within the various patient populations for comparison with the HVRR. The demographics of the various patient populations were consistent with expectations. For example, the Alzheimer’s patient population in the dataset had a mean age of 74 years and a preponderance of females (59%). In a case control study of 2,618 patients with Alzheimer’s the mean age was 76.1 years with 59% being female.7 However, there were limitations in the TransCelerate dataset such as 1) disease definition and 2) disease stage.
Clinical trials typically have a very specific patient population definition and it is important to know if the HVRR can be used for the various lab parameters in that patient population. However, the TransCelerate dataset combined three different patient subpopulations into their definition of cardiovascular disease: deep vein thrombosis, hypertension and atherosclerosis/coronary artery disease. This broad definition of cardiovascular disease could have created false negative results. Similar to a broad disease definition, a patient population consisting of wide disease stages can impact the evaluation of lab parameters. For example, the rheumatoid arthritis population consisted of clinical trials of patient from mild all the way to severe patients. To overcome these limitations, future studies will need to determine if there are differences between the different clinical trials within a patient population.
Using the TransCelerate dataset, a lab parameter was classified similar to the HVRR if less than 10% of the lab parameter values in a patient population were above or below the HVRR (ULN and LLN, respectively). In contrast, a lab parameter was classified potentially different from the HVRR if ≥10% of the lab parameter values in a patient population were above or below the HVRR. The 10% threshold was chosen to decrease the chance of false positive classification of a lab parameter being different from the HVRR without doing statistical analysis within this pilot study. The HVRR reference range is a 95% CI, meaning 2.5% of the values will be above the ULN and 2.5% of values will be below the LLN. The 10% cutoff would be four times the expected values to be above or below the HVRR. This study with the 10% cutoff determined that 25% of the lab parameters in the various patient populations evaluated were classified as potentially different from the HVRR. Of those, five lab parameters in various patient populations had more than 20% of the values greater than the ULN of the HVRR: glucose in patients with diabetes; platelets in patients with ulcerative colitis; neutrophils in patients with hidradenitis, rheumatoid arthritis, or ulcerative colitis.
There are three important pre-analytical ways a lab parameter could be different from the HVRR: physiologically associated with the disease, due to standard of care of the patient population or due to a comorbidity of the patient population. For example, ALT in patients with diabetes,5,8,9 increased platelet and neutrophil counts in patients with ulcerative colitis10,11 would be considered physiologically associated with the disease of the patient population. Glucose being higher than the HVRR in patients with schizophrenia is potentially due to the comorbidity of diabetes, since the incidence of diabetes is 2–4 times greater in patients with schizophrenia than in healthy volunteers.12 Whereas glucose being higher in COPD patients is a combination of disease severity with elevated glucose level associated with COPD exacerbation, comorbidity of diabetes is higher in patients with COPD than in the general population, as well as glucocorticoid treatment of patients with COPD potentially inducing hyperglycemia.13 To determine the potential cause(s) of a lab parameter being different in a patient population, future studies will need to compare lab values with co-morbidities and co-medications, both of which are included in the TransCelerate dataset.
The data from this pilot along with literature and medical judgement suggests that it is not uncommon for lab values to be different from the HVRR in various patient populations. There are two options that can be used in clinical trials to evaluate patients with a lab value outside the HVRR after treatment with an investigational new drug: 1) continue using medical judgement alone to determine if the lab value is drug-induced or due to the patient population/disease, or 2) combine medical judgment with better evaluation criteria for detecting a potential drug-induced abnormal lab value.
Using medical judgement alone in clinical trials requires a significant amount of time and is subjective due to varying levels of medical expertise. For example, our 10% cutoff used in this study indicates that at least 10% of the subjects would yield a false positive elevated signal in a clinical trial before and after subjects are treated with the investigational drug. For example, 24% of the patients with hidradenitis had neutrophil counts above the ULN, which means that for a study consisting of 200 subjects, then 48 subjects at each time point of lab analysis would need medical judgment even though the lab value above the ULN would be due to other causes and not because of the drug under investigation (false positives). If there are 10 timepoints within the study then there are at least 480 false positive values that would undergo unnecessary medical judgements and if each medical judgement took 5 minutes then better data evaluation would save 40 hours of time, reduce the degree of misinterpretation of the data, and human error or inconsistency.
Better evaluation criteria will decrease the number of medical judgements within each clinical trial, but the criteria must be based on medical evidence and validation. For example, the criteria historically used for a potential Hy’s Law has been ALT >3×ULN and BILI >2×ULN. But over the years it has been determined that many patients with NASH and metastatic cancer have ALT greater than the ULN before dosing with an investigative new drug.1–4 There has been much debate on how to better evaluate ALT for potential Hy’s Law cases in these patient populations.5 There have been recommendations of using multiples of ULN and multiples of the baseline values to identify DILI in patients with elevated ALT and bilirubin at baseline.14
Conclusion and next steps
These data clearly suggest that not all lab parameters in various patient populations are similar to the HVRR, but rather some lab parameters in some patient populations are potentially meaningfully different from the HVRR. Further studies will be required to determine if the potential differences are consistent across studies within a patient population and with possibly better evaluation criteria to be used during drug development and clinical practice. Limitations of the pilot that needs to be addressed in the next study(ies) include: 1) creating a more specific definition of patient populations and disease stage; 2) evaluating lab parameters for each sub-patient population separately; 3) examining between-study reproducibility; 4) assessing if inter- and intra-subject variability is different between healthy volunteers and patient populations; 5) determining if standard of care treatment and/or comorbidities explains increased lab values and should result in these subjects being evaluated differently than the other patients in this population; 6) determining the impact of age, gender, and ethnicity; 7) determining which biomarkers are different from the HVRR based on statistical analysis and medical relevance; and 8) evaluating a larger confirmatory dataset.
Disclosure
Authors were employees or contractors of AstraZeneca Pharmaceuticals when the experiments were conducted. The authors report no other conflicts of interest in this work.
References
Neuschwander-Tetri BA, Brunt EM, Wehmeier KR, Oliver D, Bacon BR. Improved nonalcoholic steatohepatitis after 48 weeks of treatment with the PPAR-gamma ligand rosiglitazone. Hepatology. 2003;38(4):1008–1017. | ||
O’Connor BJ, Kathamna B, Tavill AS. Nonalcoholic fatty liver (NASH syndrome). Gastroenterologist. 1997;5(4):316–329. | ||
Shantakumar S, Landis S, Lawton A, Hunt CM. Prevalence and incidence of liver enzyme elevations in a pooled oncology clinical trial cohort. Regul Toxicol Pharmacol. 2016;77:257–262. | ||
Torriani FJ, Rodriguez-Torres M, Rockstroh JK, et al. Peginterferon Alfa-2a plus ribavirin for chronic hepatitis C virus infection in HIV-infected patients. N Engl J Med Overseas Ed. 2004;351(5):438–450. | ||
Kullak-Ublick GA, Merz M, Griffel L, Kaplowitz N, Watkins PB. Liver safety assessment in special populations (hepatitis B, C, and oncology trials). Drug Saf. 2014;37(Suppl 1):57–62. | ||
Bhuyan P, Chen C, Desai J, et al. Development and Implementation of a pharma-collaborative large historical control database; 2017. Available from: http://www.transceleratebiopharmainc.com/wp-content/uploads/2015/04/TransCelerate-PSoC-Data-Sharing-White-Paper.pdf. Accessed March 30, 2017. | ||
Wang JH, Wu YJ, Tee BL, Lo RY, Yj W, Ry L. Medical comorbidity in Alzheimer’s disease: a nested case-control study. J Alzheimers Dis. 2018;63(2):773–781. | ||
Giandalia A, Romeo EL, Ruffo MC, et al. Clinical correlates of persistently elevated liver enzymes in type 2 diabetic outpatients. Prim Care Diabetes. 2017;11(3):226–232. | ||
Harris EH. Elevated liver function tests in type 2 diabetes. Clinical Diabetes. 2005;23(3):115–119. | ||
Cioffi M, Rosa AD, Serao R, Picone I, Vietri MT. Laboratory markers in ulcerative colitis: Current insights and future advances. World J Gastrointest Pathophysiol. 2015;6(1):13–22. | ||
Polińska B, Matowicka-Karna J, Kemona H. Assessment of the influence of the inflammatory process on the activation of blood platelets and morphological parameters in patients with ulcerative colitis (colitis ulcerosa). Folia Histochem Cytobiol. 2011;49(1):119–124. | ||
Al-Atram AA. A review of the bidirectional relationship between psychiatric disorders and diabetes mellitus. Neurosciences. 2018;23(2):91–96. | ||
Mirrakhimov AE. Chronic obstructive pulmonary disease and glucose metabolism: a bitter sweet symphony. Cardiovasc Diabetol. 2012;11:132. | ||
Lin X, Parks D, Painter J, et al. Validation of multivariate outlier detection analyses used to identify potential drug-induced liver injury in clinical trial populations. Drug Saf. 2012;35(10):865–875. |
 © 2018 The Author(s). This work is published and licensed by Dove Medical Press Limited. The
full terms of this license are available at https://www.dovepress.com/terms
and incorporate the Creative Commons Attribution
- Non Commercial (unported, 3.0) License.
By accessing the work you hereby accept the Terms. Non-commercial uses of the work are permitted
without any further permission from Dove Medical Press Limited, provided the work is properly
attributed. For permission for commercial use of this work, please see paragraphs 4.2 and 5 of our Terms.
© 2018 The Author(s). This work is published and licensed by Dove Medical Press Limited. The
full terms of this license are available at https://www.dovepress.com/terms
and incorporate the Creative Commons Attribution
- Non Commercial (unported, 3.0) License.
By accessing the work you hereby accept the Terms. Non-commercial uses of the work are permitted
without any further permission from Dove Medical Press Limited, provided the work is properly
attributed. For permission for commercial use of this work, please see paragraphs 4.2 and 5 of our Terms.