Back to Journals » Risk Management and Healthcare Policy » Volume 14
Are Epidemiological Estimates Able to Describe the Ability of Health Systems to Cope with COVID-19 Epidemic?
Authors Castaldi S ![]() , Luconi E
, Luconi E ![]() , Rivieccio BA, Boracchi P, Marano G, Pariani E, Romano L, Auxilia F, Nicolussi F, Micheletti A
, Rivieccio BA, Boracchi P, Marano G, Pariani E, Romano L, Auxilia F, Nicolussi F, Micheletti A ![]() , Manzi G
, Manzi G ![]() , Salini S, Galli M, Biganzoli E
, Salini S, Galli M, Biganzoli E
Received 7 November 2020
Accepted for publication 27 April 2021
Published 31 May 2021 Volume 2021:14 Pages 2221—2229
DOI https://doi.org/10.2147/RMHP.S290801
Checked for plagiarism Yes
Review by Single anonymous peer review
Peer reviewer comments 2
Editor who approved publication: Professor Marco Carotenuto
Silvana Castaldi,1,2,* Ester Luconi,3,* Bruno Alessandro Rivieccio,4,* Patrizia Boracchi,3 Giuseppe Marano,3 Elena Pariani,2 Luisa Romano,2 Francesco Auxilia,1 Federica Nicolussi,5 Alessandra Micheletti,6 Giancarlo Manzi,5 Silvia Salini,5 Massimo Galli,7,* Elia Biganzoli3,*
1Department of Biomedical Sciences for Health, University of Milan, Milan, Italy; 2Fondazione IRCCS Ca’ Granda Ospedale Maggiore di Milano, Milan, Italy; 3Department of Clinical Sciences and Community Health & DSRC, University of Milan, Milan, Italy; 4Niguarda Hospital, AREU, Regional Emergency Service Agency, Milan, Italy; 5Department of Economics, Management and Quantitative Methods & DSRC, University of Milan, Milan, Italy; 6Department of Environmental Science and Policy, University of Milan, Milan, Italy; 7Department of Biomedical and Clinical Sciences “L. Sacco”, University of Milan, Milan, Italy
*These authors contributed equally to this work
Correspondence: Silvana Castaldi
Department Biomedical Sciences for Health, University of Milan, Via Pascal, 36, Milan, 20133, Italy
Tel +390255038342
Fax +390255033144
Email [email protected]
Introduction: The coronavirus disease 2019 (COVID-19) epidemic is an infectious disease which was declared a pandemic and hit countries worldwide from the beginning of the year 2020. Despite the emergency vigilance plans, health systems in all countries experienced a different ratio of lethality, amount of admissions to intensive care units and quarantine management of positive patients. The aim of this study is to investigate whether some epidemiological estimates could have been useful in understanding the capacity of the Italian Regional Health Services to manage the COVID-19 epidemic.
Methods: We have compared data between two different Italian regions in the Northern part of Italy (Lombardy and Veneto) and the national data to determine whether different health strategies might be significant in explaining dissimilar patterns of the COVID-19 epidemic in Italy. Data have been extracted from a public database and were available only in an aggregated form.
Results: The regions in question displayed two different health policies to face the COVID-19 epidemic: while Veneto’s health service was largely territorially oriented, Lombardy’s strategy was more hospital-centered.
Discussion: The key to facing epidemics like this one consists in identifying solutions outside of hospitals. This however requires there be well-trained general practitioners and enough healthcare personnel working outside hospitals.
Keywords: COVID-19, epidemic, epidemiological estimates, health systems, region, Italy
Introduction
Planning health services (HSs) is a complex process. It requires a rigorous, evidence-based approach aimed at improving high-quality services that meet the future health needs of the population.1
This goal should be achieved through the provision of efficient and effective HSs, considering available resources and balancing hospitals and local services.2
HSs planning should be future-oriented and able to support organizations. It should also be better prepared to address emerging health threats and, for this reason, it must include the development of emergency plans to ensure operational readiness towards emergencies.2
Public health is constantly threatened by a wide range of hazards. Despite there being various measures to prevent them, emergencies of different nature, severity and consequences still occur and this requires that HSs be readily available to manage them.
The Coronavirus Disease 2019 (COVID-19) is an infectious disease whose outbreak was announced a pandemic and hit countries all over the world from the beginning of the year 2020.3
Despite the emergency vigilance plans, Health Systems in all countries experienced a different ratio of lethality, admissions to intensive care units (ICUs), and quarantine management of positive patients.3,4,5
We might evaluate these differences as a proxy of distinct management decisions at both national and local level, because health data related to COVID-19 infection might change with its different healthcare management strategies. For example, observed lethality ratio might change in relation to the number of the swab tests performed, which are the only tool to ensure a correct diagnosis. Moreover, some health authorities decided to treat COVID-19 patients at the hospitals, exposing healthcare workers to the infection and admitting even a-/pauci-symptomatic patients, which contributed to hospital bed saturation.
The aim of this study is to investigate if the epidemiological estimates taken into consideration might be useful to understand the capacity of Italian HS to manage the COVID-19 epidemic.
We have compared data of two different Italian regions in the Northern part of Italy (Lombardy and Veneto) with the national data to determine whether different HS strategies might be relevant in explaining different patterns of the COVID-19 epidemic in Italy. Socio-demographic data of the considered populations are shown in Table 1.
 |
Table 1 Distribution of Age, Gender, and Socio-Economic Characteristics in Lombardy, Veneto and Italy |
The considered epidemiological indicators estimates are not ideal for planning preventive measures, but they are fairly effective in estimating the burden of the disease in this pandemic situation.
Materials and Methods
Data about the spread of COVID-19 in Italy have been obtained from the GitHub repository of the Italian “Dipartimento della Protezione Civile – Presidenza del Consiglio dei Ministri” (https://github.com/pcm-dpc/COVID-19). In particular, information about national, regional and provincial situations was updated daily at 18:30 (after the Head of Department press conference).
It must be considered that data were reported in an aggregated form and no information on single patients (regarding, for instance, comorbidities) could be obtained. Moreover, only epidemiological data concerning the spread of the disease were reported, and socio-demographic information about the infected people (such as age, educational level or annual income, which might be correlated with the prevalence of the disease) was not available.
For the present work, daily data from 24/02/2020 to 12/04/2020 (so 49 days in total) have been taken into account. Particularly, for our analysis, we considered the following variables:
- Deaths,
- Symptomatic hospitalised patients,
- ICU patients,
- Currently infected patients,
- Total cases,
- Home-quarantined patients,
- Discharged and/or healed patients.
We tried to model the dynamic evolution of the following epidemiological indicators during the considered period:
- The ratio of discharged and/or healed patients to total cases.
- The case fatality ratio (“observed lethality”).
- The ratio of currently infected patients to total cases.
- The ratio of ICUs patients to currently infected patients.
- The ratio of quarantined patients to currently infected patients.
- The ratio of symptomatic hospitalised patients to currently infected patients.
Since the dynamics of both the deaths and the infections could be related to clinical, demographics and socio-economic characteristics of the population, a deeper analysis should be performed adjusting for these confounding factors as soon as these data will be made available. As an aid to interpreting the differences between the two regions and the whole Italian country, the following data are shown in Table 1:
- The composition of population with respect to age and gender in 2020 (https://www.citypopulation.de/en/italy/);
- The average income per family in 2017, as a proxy of socio-economic status (http://dati.istat.it/Index.aspx?QueryId=22919#);
- the educational level in 2020 (http://dati.istat.it/Index.aspx?DataSetCode=DCCV_POPTIT1);
the percentage of households in relative poverty in 2019 (http://dati.istat.it/index.aspx?queryid=17968). We considered the most recent available data at the present time.
Statistical Analysis
A logistic regression model was used to provide crude estimates of the endpoints, in which the response variable was the proportion of subjects with the endpoint above reported and the independent variable was the time.
In the model, the denominator used to calculate the outcome of interest was added to the model as a weight.
The shape of the time trend was modelled including restricted cubic spline functions.
Our aim was simply to obtain a smoothed shape of the trends, so we avoided defining knots positions.
Knots were placed according to a standard procedure, suggested by Harrell;6 in particular, given the linearity constraint, the first knot was placed at 0.025 quantile and the last one at 0.975 quantile of the time distribution. In fact, restricted cubic splines depend on the number of knots but are robust to the exact knots position.
Separate models were performed for Italy, Lombardy and Veneto for each indicator.
In order to choose the final model representing the smoothed shape of the trends, the following procedure was applied:
- Models with spline from 3 to 10 knots were performed, because we decided to have a maximum of one knot every five days.
- For each model AIC (Akaike Information Criterion) was reported and the estimated trend of the indicator over time was graphically examined in relationship to the observed data.
- Among all the models that one with the lower value of AIC was considered.
Table 2 displays the number of spline knots which have been chosen for each index and for each time series.
 |
Table 2 Number of Spline Knots Used in the Different Models for Each Indicator |
As the estimated regression coefficients for the cubic splines terms are not directly interpretable, results are reported only by the graphical estimated trend.
In some smoothed estimates, the goodness of fit for the first days (in general for the first 10 days) seems to be not satisfactory, but this is because of the low number of events in that period.
Data were gathered by public sources and they are freely available. Authors studied and analyzed them but did not collect them. Thus, the approval of an ethical committee is not requested.
Results
Figure 1 shows the ratio of discharged and/or healed patients to total cases.
 |
Figure 1 Ratio between discharged or healed patients and total patients. |
The trend of Lombardy is over the trend of Italy and Veneto, but all the three curves show an increase during the time of our observation as it is expected in an epidemic. In Veneto the trend is underlying that of Lombardy because of the different strategies adopted by the regions (Figure 1).
Figure 2 shows the case fatality ratio (“observed lethality”).
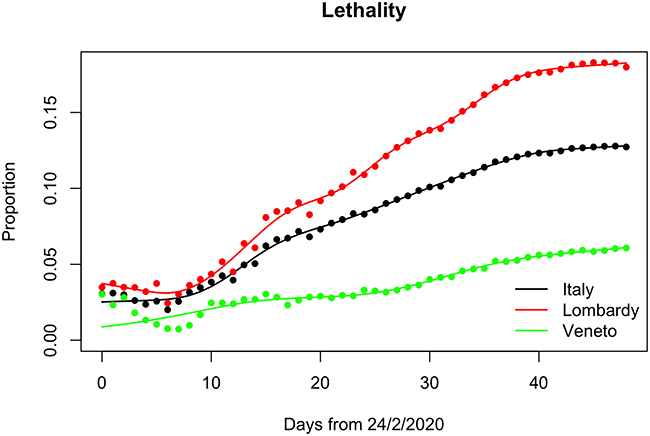 |
Figure 2 Comparison of lethality among Italy, Lombardy and Veneto. |
The lethality was very high in Lombardy (Figure 2).
Figure 3 shows the ratio of currently infected patients to total cases.
 |
Figure 3 Ratio between currently infected patients and total patients. |
The trends, as we expected, reflect the performance of an epidemic: the number of positive cases falls because patients recover and because of lockdown measures. Veneto’s values are greater probably because, in this region, many more swab tests were performed (Figure 3).
Figure 4 shows the ratio of ICUs patients to currently infected people.
 |
Figure 4 Ratio between ICUs patients and currently infected patients. |
The intensive use of hospital beds is evident in the figure for Lombardy while in Veneto the use of ICUs was postponed by some days and reserved only to the more severe cases. Lombardy faced the highest number of cases at the beginning of the epidemic when the method to cure these patients had not yet been established and placing them in intensive care was considered the best therapeutic option (Figure 4).
Figure 5 shows the ratio of quarantined patients to currently infected people.
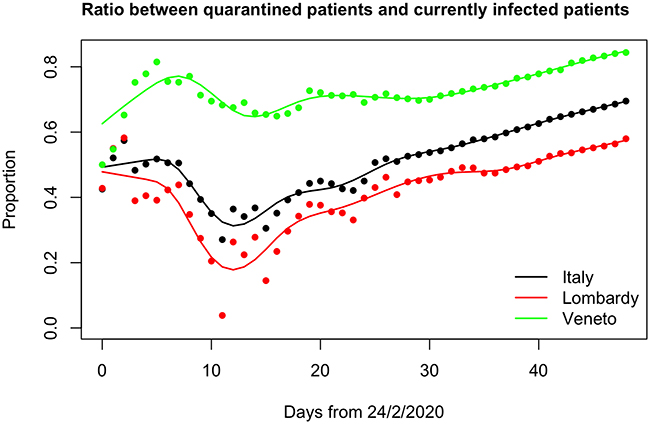 |
Figure 5 Ratio between quarantined patients and currently infected patients. |
The trend shows the strategy of care for this epidemic in Veneto whose government decided to hospitalize only patients in more severe conditions, while the less severe cases were to be treated at home (Figure 5).
Figure 6 shows the ratio of symptomatic hospitalised patients and the currently infected people.
 |
Figure 6 Ratio between symptomatic hospitalized patients and currently infected patients. |
This figure shows how in Lombardy the only strategy chosen for positive patients was their admission to hospital. The Veneto trend seems to be more stable throughout the entire period of observation (Figure 6).
The socio-demographic characteristics of the two considered regions and Italy are reported in Table 2. The distribution of age, gender and education level is very similar in Lombardy and Veneto. Economic indicators, however, show a better situation in Lombardy, with a slightly higher income per family and a 4% less of households in relative poverty conditions with respect to Veneto. These data support the idea that the different impact of the epidemic in the two regions was mostly due to the opposite public health strategies.
Discussion and Conclusion
Looking at all these data, it is possible to argue that the HS in Lombardy seemed less prepared to cope with this epidemic, while the Veneto HS managed their patients and this infection quite well.
In Veneto there was a lesser amount of hospitalizations (and so fewer discharged patients), because hospitalization was decided only for patients in critical conditions; this strategy probably had a positive impact.
The epidemic started in Lombardy due to its intensive commercial traffic with China.
The beginning of the outbreak was misunderstood probably because it happened during the influenza season.
There are also other possible explanations for this:
- With a very high number of admissions, it is possible that all the deaths that occurred in hospital were considered to be caused by COVID-19, which could have actually been only a comorbidity;
- The high admission rate might be a measure of the inadequate answer for the cure of the disease outside hospitals;
- The high lethality rate in Lombardy might be explained also by the high number of deaths in old people residing in care homes;
- On the contrary, it is unlikely that the low lethality rate in Veneto might be biased by the number of swabs performed and thus by the number of people which have not been diagnose with COVID-19: indeed, thanks to the territorial medicine care, a huge number of swabs was performed even at patients’ homes, unlike in Lombardy.
In fact, a limiting factor of the present study is the unavailability of data – at the beginning of the epidemic – regarding the number of performed swabs, and thus the impossibility to normalize the considered variables to this potential confounder.
Moreover, we may distinguish between case fatality ratio (“observed lethality”) vs infected fatality ratio (“true lethality”).
One can argue that the lethality in Lombardy “appears” to be so high because of the underestimation of the number of real total cases, due to the low number of swab tests performed and the consequent underestimation of the denominator. It must be considered that also the numerator of the fraction is certainly underestimated, since many people died at home (or even in hospitals, at least at the beginning of epidemic) without having received a specific diagnosis.
The red areas located in Bergamo and Brescia, which are in Lombardy, might have contributed to this high number of deaths.
The rapid increase of the number of deaths forced the Government to implement some restrictive measures, which lead to a national lockdown on the 9th of March.7
So, we have two different regional strategies: in Figure 2, Veneto’s stable trend is the result of its territorial care and the lower proportion of the Lombardy is the result of its hospital-centered care (the initial fall followed by an increase is the result of the saturation of hospital beds, particularly in ICUs).
However, the excess of positive cases related to early diagnosis can only partly explain the difference in apparent lethality due to the presence of silent cases without COVID-19 disease manifestation after massive screening practice in Veneto with respect to the symptomatic confirmation approach adopted in Lombardy. It is well known that this paradoxical effect is partially compensated by the increase of the lethality ratio in time even for the best regions. However, this phenomenon was observed also to the same extent for both Lombardy and Veneto. Better indicators should therefore be the ratio between the deaths and people hospitalized. In a region with a lower degree of hospitalization we could expect that more serious cases are hospitalized, therefore we could expect a higher ratio between the total number of deaths and the total number of hospitalized patients. This index should be at least comparable between the regions even in situations with different numbers of silent asymptomatic cases if similar admission criteria were adopted according to the similar expression of COVID-19 disease. If Veneto was expecting to admit more serious cases, while relying mostly on home care for the rest, such an index would have been expected to be higher than Lombardy. However, the approximated index was 0.554 for Veneto and 0.737 for Lombardy due to the lack of analytical epidemiological data, the total number of hospitalized patients is approximated by solely summing patients hospitalized at present to the fraction of the total number of dismissed/healed individuals proportional to the number of the hospitalized patients themselves. This result supports the fact that not only the apparent but also the true lethality could be different between the two regions according to the different impact of COVID-19 on the local HS.
This evidence is also supported by the general mortality data, and in particular by the comparison between the relative mortality estimation in two reference cities of Lombardy and Veneto. Indeed, while Milan and Brescia, in Lombardy, showed a huge increase in the expected mortality (respectively 1.96 and 3.15 times, with 1369 and 391 exceeding deaths), Venice and Verona, in Veneto, displayed “only”, respectively, a mortality increase of 16% and of 33% (62 and 87 exceeding deaths). All these exceeding deaths can be attributable to both direct and indirect causes due to the COVID-19 epidemic, but there is no way to discriminate between them.8
A limitation of our results is the impossibility to adjust for potential confounders such as gender, age, and socio-economic status. Consequently, even if general demographic and socio-economic data suggest that opposite public health strategies in Lombardy and Veneto can at least partly account for a different impact of COVID-19 epidemic in the two considered regions, direct comparison between these regions should be considered with caution (Table 1).
These two regions represent the Italian situation in which many different health organizations coexist: in Lombardy there was a progressive removal of public services in favor of private ones and there was the gradual dismantling of “territorial-centered” services and interventions (for example general practitioners, Local Social and Health Agencies) versus “hospital-centered” ones (for example, the Emergency Departments); in Veneto we had a “territory-centered” system.9
These features are reflected in the different health policies adopted by the two local governances to face COVID-19 epidemic.
In all the figures (except for a short trait in the ICUs pts. vs currently infected pts. ratio curve), the national curve (which obviously is the result of a weighted average of all regional ones) lies between the two curves of Lombardy and Veneto, which are two “opposite poles” in the Italian landscape. Indeed, while we can consider the last one as a positive coping region, Lombardy acted as a negative one.
The use of ICU beds to face this epidemic in Lombardy is one of the most significant pieces of evidence of the stress the HS had to cope with, along with the increased number of patients. In Lombardy two regional laws in 2009 and 2010 asked to prepare and to keep updated a preparedness plan for a respiratory virus pandemic. In particular, the Regional Management Board asked to limit the use of hospitals only to the more severe cases.10,11
The key to facing epidemics like this one consists in identifying solutions outside of hospitals. This however requires there be well-trained general practitioners able to perform swabs and provided with personal protective equipments, and in general well-trained healthcare personnel working outside hospitals.12
This was not the Italian situation, in fact the Global Health Security Index 2019 gave Italy a very low score for emergency preparedness and response planning and risk communication, leading to a rank of 31 out of 195 countries. Italy must start from this point.13,14
Acknowledgments
The Authors thank the anonymous Reviewers for the useful comments and English mother-tongue Ms. Alessandra Rizzuto for her revision of the text.
Author Contributions
All authors made a significant contribution to the work reported, whether that is in the conception, study design, execution, acquisition of data, analysis and interpretation, or in all these areas; took part in drafting, revising or critically reviewing the article; gave final approval of the version to be published; have agreed on the journal to which the article has been submitted; and agree to be accountable for all aspects of the work.
Disclosure
Prof. Dr Massimo Galli reports grants, personal fees, non-financial support from MSD, GS, ViiV, AbbVie, JC, outside the submitted work. The authors declare that the research was conducted in the absence of any other commercial or financial relationships that could be construed as a potential conflict of interest.
References
1. RAND Europe. Framework for Assessing, Improving and Enhancing Health Service Planning. Santa Monica: RAND Corporation; 2010.
2. Lawrence D. Strategic approaches to planning health services. In: Pencheon D, Melzer D, Gray M, Guest C, editors. Oxford Handbook of Public Health Practice.
3. WHO. Situation report n.51, 2020.
4. WHO. Strategic Framework for Emergency Preparedness; 2017.
5. Rivieccio BA, Luconi E, Boracchi P, et al. Heterogeneity of COVID-19 outbreak in Italy. Acta Bio Med. 2020;91(2):31.
6. Harrell FE. Regression Modeling Strategies: With Applications to Linear Models, Logistic Regression, and Survival Analysis. New York: Springer-Verlag; 2001. doi:10.1007/978-1-4757-3462-1
7. Repubblica Italiana - Decreto-Legge 8 marzo 2020, n. 11. Misure straordinarie ed urgenti per contrastare l’emergenza epidemiologica da COVID-19 e contenere gli effetti negativi sullo svolgimento dell’attività giudiziaria. (Gazzetta Ufficiale n. 60 dell’8.03.2020).
8. SiSMG. Andamento della Mortalità Giornaliera nelle città italiane in relazione all’epidemia di Covid-19. 4° Rapporto 1 Febbraio – 11 Aprile 2020. Available from: http://www.deplazio.net/images/stories/SISMG/SISMG_COVID19.pdf.
9. Regione Lombardia – Legge Regionale 11 agosto 2015, n. 23 Evoluzione del sistema sociosanitario lombardo: modifiche al Titolo I e al Titolo II della legge regionale 30 dicembre 2009, n. 33. (Testo unico delle leggi regionali in materia di sanità).
10. Regione Lombardia – Circolare 14.09.2009-19/SAN/2009 Piano Pandemico Regionale - Aggiornamento a seguito del manifestarsi della Pandemia Influenzale A/H1N1v.
11. Regione Lombardia - Deliberazione IX/001046 22.12. 2010. Conclusione fase 6 pandemia influenzale da virus A/H1N1: valutazioneed indicazioni operative.
12. WHO. Clinical Management of Human Infection with Pandemic H1N1: Revised Guidance; 2009.
13. Global health security index 2019 building collective action and accountability.
14. Castaldi S, Romano L, Pariani E, Biganzoli E, Garbelli C. The end of lockdown what next? Lockdown COVID 19. Acta Bio Med. 2020;91(2):236.
 © 2021 The Author(s). This work is published and licensed by Dove Medical Press Limited. The
full terms of this license are available at https://www.dovepress.com/terms
and incorporate the Creative Commons Attribution
- Non Commercial (unported, 3.0) License.
By accessing the work you hereby accept the Terms. Non-commercial uses of the work are permitted
without any further permission from Dove Medical Press Limited, provided the work is properly
attributed. For permission for commercial use of this work, please see paragraphs 4.2 and 5 of our Terms.
© 2021 The Author(s). This work is published and licensed by Dove Medical Press Limited. The
full terms of this license are available at https://www.dovepress.com/terms
and incorporate the Creative Commons Attribution
- Non Commercial (unported, 3.0) License.
By accessing the work you hereby accept the Terms. Non-commercial uses of the work are permitted
without any further permission from Dove Medical Press Limited, provided the work is properly
attributed. For permission for commercial use of this work, please see paragraphs 4.2 and 5 of our Terms.