Back to Journals » Neuropsychiatric Disease and Treatment » Volume 14
Application value of selected serum indicators in the differential diagnosis of geriatric depression and transient depressive state
Authors Xu Y, Yao S, Wei H, Zhu X, Yu M, Li Y
Received 21 September 2017
Accepted for publication 22 December 2017
Published 8 February 2018 Volume 2018:14 Pages 459—465
DOI https://doi.org/10.2147/NDT.S152247
Checked for plagiarism Yes
Review by Single anonymous peer review
Peer reviewer comments 3
Editor who approved publication: Professor Wai Kwong Tang
Yuhao Xu,1,* Shun Yao,2,* Hong Wei,1 Xiaolan Zhu,3 Ming Yu,1 Yuefeng Li2
1Department of Neurology, The Affiliated Hospital of Jiangsu University, Zhenjiang, People’s Republic of China; 2Department of Radiology, The Affiliated Hospital of Jiangsu University, Zhenjiang, People’s Republic of China; 3Department of Central Laboratory, The Fourth Affiliated Hospital of Jiangsu University, Zhenjiang, People’s Republic of China
*These authors contributed equally to this work
Background: Transient depressive state (TDS) is a transient, negative emotional state caused by certain events or situations. Because of the similarity in depressive symptoms between depression and TDS that arise within 2 weeks of their onset, it is difficult to distinguish TDS from depression. The aims of the present study were to investigate the application value of selected serum indicators in the differential diagnosis of geriatric depression and TDS in the early stage and to provide evidence for treatment.
Patients and methods: In this study, a total of 274 elderly patients were divided into the depression group (n=144) and the TDS group (n=130). All participants’ serum samples were collected, and 9 selected serum indicators were analyzed. Afterward, 90 patients with depression and 90 patients with TDS were used to build the diagnostic model. A binary logistic regression analysis was used to establish regression models, and the area under the receiver operating characteristic (ROC) curve was drawn. Finally, another 54 patients with depression and 40 patients with TDS were used to validate our model.
Results: For the 9 screening serum indicators, the 3 serum indicators selected to build the regression model were BDNF (P=0.001), IL-1β (P<0.001), and cortisol (P<0.001). The regression equation was Y = 1/[1 + e-(-16.258 - 0.018 (BDNF) + 0.256 (IL-1β) + 0.093 (Cortisol))], and the ROC curve of combined detection was 0.926. The diagnostic rate of the logistic model was 89.36%.
Conclusion: The logistic regression model and ROC curves based on serum levels of BDNF, IL-1β, and cortisol could distinguish depression from TDS in early stage, which could provide assistance to the differential diagnosis of geriatric depression and TDS.
Keywords: CCMD-3, depression, logistic regression, transient depressive state, ROC curve
Introduction
Depression is one of the most prevalent mental disorders, with an estimated global point prevalence of 4.7%, and it is the eleventh leading cause of the global disease burden.1,2 Even though depression can be diagnosed in a reliable manner, there still exist some problems in its early diagnosis and differential diagnosis.3
The Chinese Classification of Mental Disorders (CCMD-3) is the most commonly practiced mental classification in China, which was developed by the Chinese Society of Psychiatry.4 The diagnostic criteria of depression in the CCMD-3 includes two essential parts, symptom and disease course, which are widely used to diagnose depression.5,6 Since CCMD-3 has proposed a two-week time as the standard of course of disease, patients with a series of depressive symptoms, such as depressed mood and feelings of guilt, and whose disease course lasts for more than 2 weeks, can be diagnosed with depression. In addition, to rapidly determine whether patients’ symptoms are consistent with those of depression, the Hamilton Rating Scale for Depression (HAMD) is used to assess a representative series of depressive symptoms within the framework of a clinical interview with depressed patients.7 In the diagnostic procedure of psychiatric disorders, the results of the CCMD-3 and HAMD could help psychiatrists distinguish depression from other psychiatric disorders (eg, anxiety, schizophrenia).8,9 Currently, several epidemiological studies have revealed that subsyndromal conditions with depressive mood also exist in the community without progressing into full-blown mood episodes.10,11 Such depressive moods could be improved within 2 weeks, which we define as transient depressive state (TDS). In clinical work, patients with depression need early drug or physical treatment for a better prognosis,12 while patients with TDS can be observed temporarily without drug prescription or physiotherapy. Moreover, patients with TDS can mostly self-recover within 2 weeks, and it is unnecessary for them to consider the side effects of the treatment.13 Because the treatment principles of depression and TDS are different, distinguishing TDS from depression in patients with depressive symptoms is of high significance. Meanwhile, the Diagnostic and Statistical Manual of Mental Disorders-IV and International Classification of Diseases-10 also establish a 2-week course as the main diagnostic point of depression, but CCMD-3, Diagnostic and Statistical Manual of Mental Disorders-IV, and International Classification of Diseases-10 all show little importance on the diagnosis of patients with depressive symptoms if their disease course had not reached 2 weeks when they came to visit the doctor; this made the differential diagnosis of depression and TDS difficult.14
On this basis, we try to solve the problem based on analysis of serum indicators. Currently, changes of serum indicators in patients with depression including the reduction of neurotrophic factors,15 upregulation of inflammatory factors,16 and increase of cortisol17 have been widely studied. Although the existing result are not consistent, we have referred to a large number of mainstream literature and selected 9 recognized indicators including BDNF, GDNF, FGF-2, VEGF, IL-1β, IL-6, IL-10, TNF-α, and cortisol. Notwithstanding that TDS is similar to depression, it is still unknown whether these serum indicators show similar changes in TDS, whether these serum indicators behave differently between the two conditions, and whether these indicators could help us to distinguish depression from TDS. Additionally, due to the high incidence of depression and TDS in elderly people, we selected elderly patients for observation. In this report, we analyzed 9 selected serum indicators in elderly patients with depression and patients with TDS. Afterward, the logistic regression model was established and ROC curves were drawn in order to explore their application value in the differential diagnosis of geriatric depression and TDS, as well as provide evidence for treatment.
Patients and methods
Participants
Two hundred seventy-four in- and out-patients were recruited for this study from the Affiliated Hospital of Jiangsu University. The inclusion criteria were as follows: 1) age >65 years, 2) HAMD-24 scores ≥8, 3) on the first episode and treatment-naive, 4) coming to visit on the first day of the episode, and 5) temporarily refusing to be treated within 2 weeks of their course of the disease. Patients with any physical diseases (eg, organic brain diseases, tumor, thyroid disease, cardiovascular and autoimmune diseases), or history of familial psychiatric disorders were excluded from this study. Afterward, we followed up all participants during the following 2 weeks, and the retrospective diagnoses were made according to the CCMD-3 after the follow-up. According to their actual retrospective results of disease after a 2-week course, patients with depressive symptoms lasting for 2 weeks were diagnosed with depression, and patients with depressive symptoms who self-recovered within 2 weeks were diagnosed with TDS. The 274 elderly patients were divided into 144 patients with depression and 130 patients with TDS. Afterward, 90 patients with depression and 90 patients with TDS were randomly selected to build the diagnostic model, and another 54 patients with depression and 40 patients with TDS were used to validate our model.
The Institutional Review Board of the Affiliated Hospital of Jiangsu University approved the research protocol, and all participants provided written informed consent.
Clinical examinations of depression-related serum indicators
Following an overnight fast, 5 mL of venous blood from participants was collected between 7 and 9 am. After collection, the blood samples were kept at room temperature for 1 hour before separation of the serum by centrifugation at 3,000 rpm for 20 minutes at 4°C. Serum samples were aliquoted and stored at −80°C until further analysis. The levels of BDNF, GDNF, FGF-2, VEGF, IL-1β, IL-6, IL-10, TNF-α, and cortisol were measured using enzyme-linked immunosorbent assay kits (Table S1) according to the manufacturer’s instructions. All samples were examined by an operator who was blinded to the clinical status of the participants.
Statistical analysis
SPSS 19.0 statistical software (SPSS, Inc., Chicago, IL, USA) was employed to analyze significant differences in the assay data. The data are reported as the mean ± standard deviation. Independent sample t-test, χ2 test, and rank sum test were used to examine differences in demographic data and selected serum indicators between the two groups. Then, the 9 serum indicators were used as covariates and diagnostic results of disease were used (depression =1, TDS =0) as dependent variables; forward logistic stepwise regression analysis was used to screen serum indicators to determine the final modeling indices. For each single index screened out by logistic regression and the detection level of its new variables as test variables and diagnostic results of disease as state variables, subjects’ receiver operating characteristic (ROC) curve was drawn. Next, according to the logistic model and area under the ROC curve (AUC), the diagnostic value of combined detection for depression was evaluated. The results were considered significant at P<0.05.
Results
Results of demographic data and serum indicators
As shown in Table 1, there were no significant differences in the sex, age, height, weight, years of schooling, and HAMD scores between the two groups. For the 9 screening serum indicators, the serum levels of BDNF, GDNF, and VEGF in the depression group were lower than those in the TDS group (P<0.05), and the serum levels of IL-1β and cortisol in the depression group were higher than those in the TDS group (P<0.05). However, there were no differences in the serum levels of FGF-2, IL-6, IL-10, and TNF-α (P>0.05).
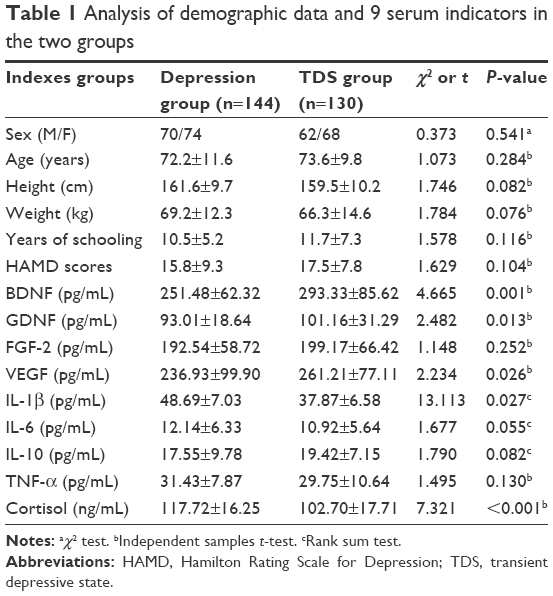 | Table 1 Analysis of demographic data and 9 serum indicators in the two groups |
Logistic regression analysis of serum indicators
In order to build the diagnostic model, 90 patients with depression and 90 patients with TDS were used. The 9 serum indicators were analyzed by forward logistic stepwise regression analysis, and the results are shown in Table 2. Only three independent variables, BDNF, IL-1β, and cortisol, were entered into the logistic regression equation. The partial regression coefficients were −0.018, 0.256, and 0.093, respectively, and their corresponding P-values were 0.001, <0.001, and 0.003, respectively. The corresponding regression equation was as follows:
Y = 1/[1 + e−(−16.258 − 0.018 (BDNF) + 0.256 (IL-1β) + 0.093 (Cortisol))] |
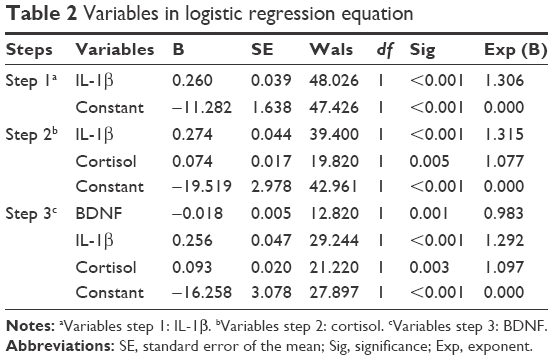 | Table 2 Variables in logistic regression equation |
ROC curve analysis of 3 serum indicators by single detection and combined detection
Figure 1A–D shows the ROC curves of the logistic regression models of 3 serum indicators by single detection and combined detection. The sensitivity and specificity of each serum marker for single detection and combined detection and AUC are shown in Table 3. The AUC of combined detection was 0.926, suggesting that combined detection had a better diagnostic rate than single detection, and its diagnostic sensitivity and specificity were 95.5% and 80.0%, which was the best model compared to others. According to the result of the best Youden Index, the corresponding cut point of combined detection for the diagnosis of depression was defined as a Y-value >0.306.
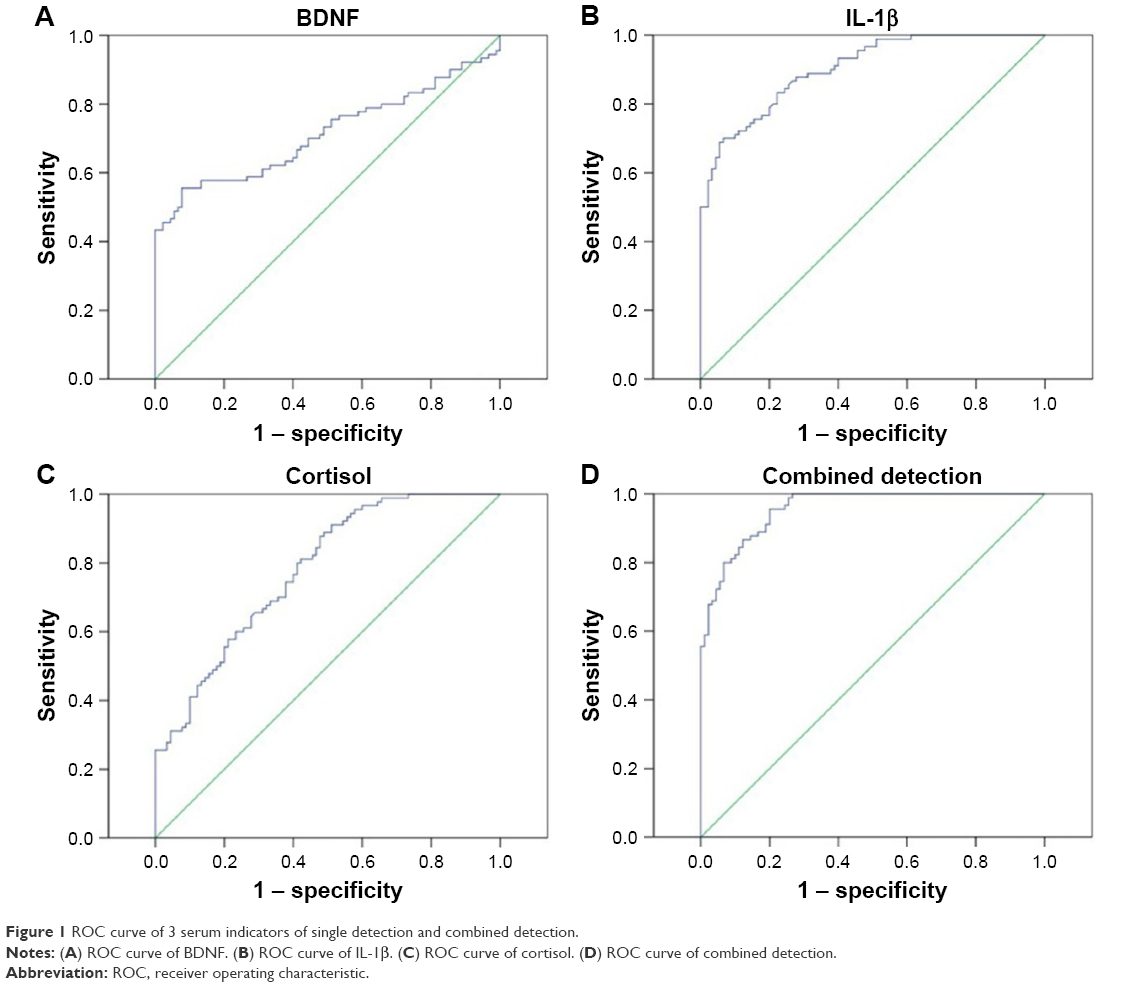 | Figure 1 ROC curve of 3 serum indicators of single detection and combined detection. |
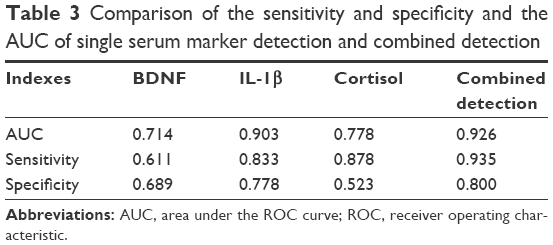 | Table 3 Comparison of the sensitivity and specificity and the AUC of single serum marker detection and combined detection |
Evaluation of logistic regression model
To further test the accuracy of the combined detection model, another 54 patients with depression and 40 patients with TDS were included in the analysis. The P-value of each patient was calculated according to the logistic regression equation. As shown in Table 4, compared to the actual diagnosis results made after 2 weeks, the diagnosis accuracy of the combined detection model was 89.36%.
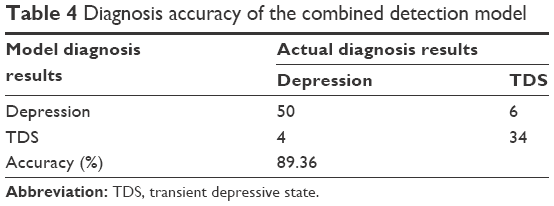 | Table 4 Diagnosis accuracy of the combined detection model |
Discussion
TDS is a transient, negative emotional state caused by certain events or situations, and it is associated with stress and can largely be overcome through self-recovery within 2 weeks.6 Due to the similarity of its symptoms with those of depression, and given the minor importance given by of the CCMD-3 and HAMD for their differential diagnosis at an early stage, the identification of depression and TDS has become a major difficulty in the field of neuropsychiatry, which had led to great difficulty in the treatment of depression and TDS. In this study, we innovatively combined observed multiple selected indicators and demonstrated, for the first time, that the logistic regression model and ROC curves based on BDNF, IL-1β, and cortisol can provide insight into differential diagnosis of geriatric depression and TDS.
Because of the high incidence rates of discord between children, death of relatives and inadaptability to life after retirement, the elderly bear more stress than younger groups, and thus constitute a large proportion of the population affected by depression and TDS.18–20 Thus, we chose elderly patients over 65 years of age as participants; we then divided them into depression and TDS groups, according to whether their depressive symptoms could be self-recovered from in 2 weeks of their course without drug or physical treatment. On this basis, we analyzed 9 selected serum indicators and found that the levels of the serum indicators were indeed different between the two groups. Afterward, serum indicators in 90 patients with depression and 90 patients were screened using logistic regression, and three indices were screened out (BDNF, IL-1β, and cortisol) to build the logistic model. Finally, another 54 patients with depression and 40 patients with TDS were used to validate our model.
So far, several reports have demonstrated that BDNF, IL-1β, and cortisol have significant value in the pathogenesis of depression. BDNF, as the core factor of the neurotrophic hypothesis, is involved in synaptic plasticity and the survival of neurons.21 Martocchia et al22 found that the decreased BDNF serum levels in depressed elderly subjects increased after antidepressant treatment. Moreover, IL-1β and cortisol were demonstrated to be associated with the apoptosis of hippocampus cells,23,24 and many studies have attested that the serum levels of IL-1β and cortisol levels in depression patients were higher than those in healthy controls and decreased significantly after antidepressant treatment.25,26 According to the differences in the serum levels of BDNF, IL-1β, and cortisol between patients with depression and TDS showed in our results, we can infer that compared to patients with TDS, the degree of neuronal damage in patients with depression was more serious and more difficult to reverse, and it seemed to provide us with an explanation of why the depressive symptoms in TDS showed recovery within 2 weeks without medication, which needs further animal experiments to verify. Meanwhile, because the depressive disease is based on a complex pathophysiological process, single serum indicators cannot fully explain the change and development of the disease; thus, serum biomarker variables were combined to optimize sensitivity and specificity. The ROC curves based on BDNF, IL-1β, and cortisol showed the best sensitivity and specificity, and compared to actual diagnostic results, the diagnostic accuracy of our model reached 89.36%, which can be regarded as having clinically practical values.
Conclusion
Our research is a preliminary retrospective analysis, and a number of issues could influence the interpretation of our results. A few limitations of this study should be noted. Although the standard course of 2 weeks for depressive symptoms was stipulated in the CCMD-3 and is a view commonly held by psychiatrists, there is no abundant proof for the length of this standard course; thus, this gold standard for the diagnosis of depression and TDS may not completely accurate. However, we did conduct a late follow-up after this experiment was over and demonstrated that our diagnosis was not problematic. Additionally, due to the complexity of the pathogenesis of depression, the 9 indicators we chose at the beginning is far from enough, and a more sensitive and more specific logistic model and ROC curve must exist, which requires further exploration. Notwithstanding these limitations, this study provides a more conducive method to the distinguish geriatric depression from TDS at an early stage. Once validated, substratification of geriatric depression/TDS patients based on composite biomarker and clinical assessment readouts could support psychiatrists in their diagnosis and treatment decision process and increase the rationality of treatment.
Acknowledgments
This work was supported by Jiangsu Provincial Key Research and Development Plan (BE2017698), project of Jiangsu Provincial Health and Family Planning Commission (Q201605), project of young key teacher training (5524040001), project of Jiangsu Provincial young medical talents (QNRC2016832/QNRC2016460), project of Affiliated Hospital of Jiangsu University 5123 Talents (JDFY009), and project of Zhenjiang social development (SH2017014).
Disclosure
The authors report no conflicts of interest in this work.
References
Buntrock C, Ebert DD, Lehr D, et al. Evaluating the efficacy and cost-effectiveness of web-based indicated prevention of major depression: design of a randomised controlled trial. BMC Psychiatry. 2014;14:25. | ||
Lambert M, Harter M, Arnold D, et al. [Improving Mental Health Literacy and Mental Illness Stigma in the Population of Hamburg]. Psychiatr Prax. 2015;42 (Suppl 1):S9–S13. | ||
Lieblich SM, Castle DJ, Pantelis C, Hopwood M, Young AH, Everall IP. High heterogeneity and low reliability in the diagnosis of major depression will impair the development of new drugs. BJPsych Open. 2015;1:e5–e7. | ||
Chinese Society of Psychiatry. Chinese Classification of Mental Disorders: version 3. Shandong Science and Technique Press; 2001. | ||
Chen YF. Chinese classification of mental disorders (CCMD-3): towards integration in international classification. Psychopathology. 2002;35:171–175. | ||
Zou YZ, Cui JF, Han B, Ma AL, Li MY, Fan HZ. Chinese psychiatrists views on global features of CCMD-III, ICD-10 and DSM-IV. Asian J Psychiatr. 2008;1:56–59. | ||
Ballesteros J, Bobes J, Bulbena A, et al. Sensitivity to change, discriminative performance, and cutoff criteria to define remission for embedded short scales of the Hamilton depression rating scale (HAMD). J Affect Disord. 2007;102:93–99. | ||
Wang J, Jiang C, Chen L, et al. A cross-sectional study to investigate the correlation between depression comorbid with anxiety and serum lipid levels. Compr Psychiatry. 2016;69:163–168. | ||
Grace AA. Dysregulation of the dopamine system in the pathophysiology of schizophrenia and depression. Nat Rev Neurosci. 2016;17(8):524–532. | ||
Judd LL, Akiskal HS. Delineating the longitudinal structure of depressive illness: beyond clinical subtypes and duration thresholds. Pharmacopsychiatry. 2000;33:3–7. | ||
Akiskal HS. Dysthymia and cyclothymia in psychiatric practice a century after Kraepelin. J Affect Disord. 2001;62:17–31. | ||
Möller HJ, Seemüller F, Riedel M. Time and depression treatment: the value of early treatment response. Medicographia. 2010;32:139–145. | ||
Kawada T, Katsumata M, Suzuki H, Shimizu T. Actigraphic predictors of the depressive state in students with no psychiatric disorders. J Affect Disord. 2007;98:117–120. | ||
Lai CM, Leung F, You J, Cheung F. Are DSM-IV-TR borderline personality disorder, ICD-10 emotionally unstable personality disorder, and CCMD-III impulsive personality disorder analogous diagnostic categories across psychiatric nomenclatures? J Pers Disord. 2012;26:551–567. | ||
Buttenschon HN, Foldager L, Elfving B, Poulsen PH, Uher R, Mors O. Neurotrophic factors in depression in response to treatment. J Affect Disord. 2015;183:287–294. | ||
Kohler CA, Freitas TH, Maes M, et al. Peripheral cytokine and chemokine alterations in depression: a meta-analysis of 82 studies. Acta Psychiatr Scand. 2017;135:373–387. | ||
Matsuzaka H, Maeshima H, Kida S, et al. Gender differences in serum testosterone and cortisol in patients with major depressive disorder compared with controls. Int J Psychiat Med. 2013;46:203–221. | ||
Bangerter LR, Kim K, Zarit SH, Birditt KS, Fingerman KL. Perceptions of giving support and depressive symptoms in late life. Gerontologist. 2015;55:770–779. | ||
Chang SC, Pan A, Kawachi I, Okereke OI. Risk factors for late-life depression: A prospective cohort study among older women. Prev Med. 2016;91:144–151. | ||
Kok RM, Reynolds CF 3rd. Management of depression in older adults: A review. JAMA. 2017;317:2114–2122. | ||
Suliman S, Hemmings SM, Seedat S. Brain-Derived Neurotrophic Factor (BDNF) protein levels in anxiety disorders: systematic review and meta-regression analysis. Front Integr Neurosci. 2013;7:55. | ||
Martocchia A, Curto M, Scaccianoce S, et al. Effects of escitalopram on serum BDNF levels in elderly patients with depression: a preliminary report. Aging Clin Exp Res. 2014;26:461–464. | ||
Watanabe R, Kakeda S, Watanabe K, et al. Relationship between the hippocampal shape abnormality and serum cortisol levels in first-episode and drug-naive major depressive disorder patients. Depress Anxiety. 2017;34:401–409. | ||
Koo JW, Duman RS. IL-1beta is an essential mediator of the antineurogenic and anhedonic effects of stress. Proc Natl Acad Sci U S A. 2008;105:751–756. | ||
Adler G, Skonieczna-Zydecka K, Madlani A, et al. Association between depression, parameters of adiposity and genetic polymorphisms of pro-inflammatory cytokines: IL-1alpha, IL-1beta, IL-2 and IL-6 in subjects over 55 years old. Acta Biochim Pol. 2016;63:253–259. | ||
Yi JH, Brown C, Whitehead G, et al. Glucocorticoids activate a synapse weakening pathway culminating in tau phosphorylation in the hippocampus. Pharmacol Res. 2017;121:42–51. |
Supplementary material
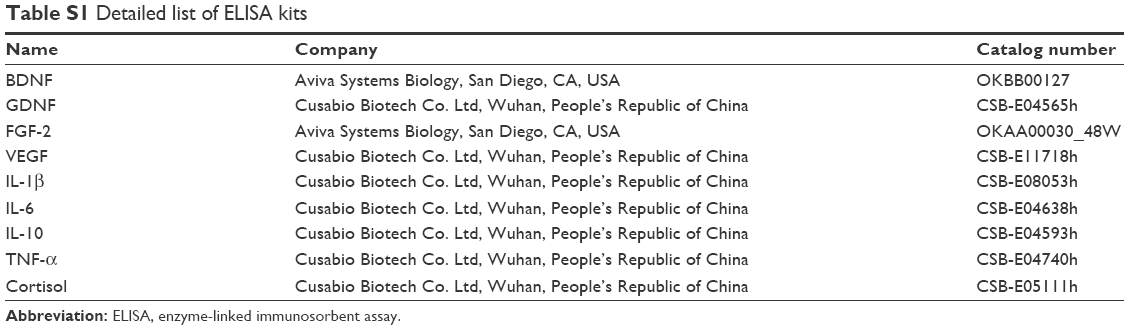 | Table S1 Detailed list of ELISA kits |
 © 2018 The Author(s). This work is published and licensed by Dove Medical Press Limited. The
full terms of this license are available at https://www.dovepress.com/terms
and incorporate the Creative Commons Attribution
- Non Commercial (unported, 3.0) License.
By accessing the work you hereby accept the Terms. Non-commercial uses of the work are permitted
without any further permission from Dove Medical Press Limited, provided the work is properly
attributed. For permission for commercial use of this work, please see paragraphs 4.2 and 5 of our Terms.
© 2018 The Author(s). This work is published and licensed by Dove Medical Press Limited. The
full terms of this license are available at https://www.dovepress.com/terms
and incorporate the Creative Commons Attribution
- Non Commercial (unported, 3.0) License.
By accessing the work you hereby accept the Terms. Non-commercial uses of the work are permitted
without any further permission from Dove Medical Press Limited, provided the work is properly
attributed. For permission for commercial use of this work, please see paragraphs 4.2 and 5 of our Terms.