
Back to Journals » International Journal of General Medicine » Volume 18
Application Value of Novel Inflammatory Indicators in Response to Ursodeoxycholic Acid Therapy in Patients with Primary Biliary Cholangitis
Authors Liu S  , Pang Y, Wang X, Lin R , Tunala S
Received 26 August 2024
Accepted for publication 30 January 2025
Published 19 February 2025 Volume 2025:18 Pages 897—905
DOI https://doi.org/10.2147/IJGM.S493132
Checked for plagiarism Yes
Review by Single anonymous peer review
Peer reviewer comments 2
Editor who approved publication: Dr Hossam Shaaban
Siqi Liu,1 Yongli Pang,2 Xiaoxi Wang,3 Ruihang Lin,4 Siqing Tunala5
1Inner Mongolia Medical University, Hohhot, Inner Mongoli, People’s Republic of China; 2Ordos second People’s Hospital, Ordos, Inner Mongoli, People’s Republic of China; 3People’s Hospital of Ordos Dongsheng District, Ordos, Inner Mongoli, People’s Republic of China; 4Ordos Central Hospital, Ordos, Inner Mongoli, People’s Republic of China; 5Ordos Mongolian Medicine Hospital, Ordos, Inner Mongoli, People’s Republic of China
Correspondence: Siqing Tunala, Ordos Mongolian Medicine Hospital, Ordos, Inner Mongoli, People’s Republic of China, Email [email protected]
Objective: To analyze the application value of novel inflammation indicators such as the lymphocyte/monocyte ratio (LMR), neutrophil/lymphocyte ratio (NLR), and platelet/lymphocyte ratio (PLR) in patients with primary biliary cholangitis (PBC) undergoing ursodeoxycholic acid (UDCA) treatment. We plan to further seek simple and convenient methods to assess the response of patients to UDCA treatment.
Methods: We recorded routine blood tests, liver function, and vitamin D (VD) levels of PBC patients and healthy controls visiting the hospital between October 2022 and October 2023. LMR, NLR, and PLR were calculated, and differences between the two groups were analyzed. PBC patients were divided into good response and poor response groups according to the Paris I criteria, and differences in laboratory tests between the two groups were analyzed. The predictive value of novel inflammation indicators in UDCA treatment response was further analyzed using ROC analysis.
Results: LMR and VD levels were significantly lower in the PBC group compared to the control group (P=0.000, P=0.000). In PBC patients, the good response group had higher LMR than the poor response group (P=0.001) and lower NLR than the poor response group (P=0.015). The areas under the ROC curve for LMR and NLR were 0.682± 0.049 and 0.630± 0.052, respectively. There was a significant negative correlation between PLR and VD in PBC patients (r=− 0.252, P=0.005).
Conclusion: Low LMR and high NLR may indicate poor treatment response. And PLR also have certain predictive values for treatment response.
Keywords: primary biliary cholangitis, lymphocyte/monocyte ratio, neutrophil/lymphocyte ratio, platelet/lymphocyte ratio, vitamin D
Introduction
Primary biliary cholangitis (PBC) is a chronic progressive non-suppurative inflammatory disease of the small intrahepatic bile ducts, leading to cholestasis. It is a type of autoimmune liver disease most common in women and people over 50 years old. The cause is not clear but is considered to be related mainly to genetic and environmental factors. The treatment is lifelong.1,2 In recent years, the incidence of PBC has gradually increased, and mortality has decreased after treatment,3 although there are currently few drug options. Undergoing ursodeoxycholic acid (UDCA) is the only approved first-line treatment for PBC. Patients with poor response to UDCA treatment have poor long-term prognosis and should consider second-line drug therapy. At present, commonly used models are based on a one-year period of UDCA treatment, and early use of simple methods to assess patient response is necessary in clinical treatment.
Lymphocyte/monocyte ratio (LMR), neutrophil/lymphocyte ratio (NLR), and platelet/lymphocyte ratio (PLR) are novel inflammation indicators that are inexpensive, simple, and can reflect the body’s inflammatory and immune status. In studies related to liver diseases, elevated NLR is associated with the progression and prognosis of viral hepatitis and non-alcoholic fatty liver disease. It is an independent prognostic risk factor for mortality in cirrhosis and acute-on-chronic liver failure. NLR is also associated with the prognosis of PBC patients.4–7 LMR can predict the prognosis of various liver diseases, including survival after radiofrequency ablation for hepatocellular carcinoma and mortality rates for hepatitis B-related cirrhosis, among others. Patients with low LMR generally have a poorer prognosis,8,9 and a low LMR can increase the risk of acute-on-chronic liver failure, reflecting the patient’s prognosis.10 Vitamin D (VD) is an essential fat-soluble vitamin that, besides regulating calcium and phosphorus metabolism through classical pathways, is also related to inflammation and autoimmune diseases.11 Its levels are correlated with novel inflammation indicators. Studies have indicated that new inflammatory markers such as NLR and PLR are negatively correlated with vitamin D levels, while LMR is positively correlated with vitamin D levels.10,12,13
Materials and Methods
Research Subjects
PBC patients and physical examinees visiting secondary or higher public hospitals in Ordos from October 2022 to October 2023 were selected. PBC patients met the diagnostic criteria of the “Guidelines for the Diagnosis and Treatment of Primary Biliary Cholangitis (2021)” by the Chinese Medical Association Liver Disease Committee and had been receiving standard oral UDCA treatment for at least 12 months. Exclusion criteria included the presence of other types of hepatitis, liver cirrhosis, malignant liver tumors, acute/chronic liver failure, renal failure, severe cardiovascular diseases, acute respiratory, gastrointestinal, or urinary tract infections, and a history of hormone, immunosuppressant, or VD treatment within the past three months. This study was approved by the hospital’s ethics committee (2022–027), and all enrolled patients voluntarily signed informed consent forms.
Methodology
All enrolled patients had fasting venous blood collected in the morning for routine blood tests (including platelet, neutrophil, lymphocyte, monocyte counts), liver function tests [including alanine aminotransferase (ALT), aspartate aminotransferase (AST), γ- glutamyl transpeptidase (GGT), alkaline phosphatase (ALP), total bilirubin (TB), albumin (ALB)], and 25-hydroxyvitamin D [25(OH)D] levels. Novel inflammation indicators (including LMR, NLR, and PLR) were calculated based on routine blood test results.
All enrolled PBC patients are early-stage patients. So they were divided into good response and poor response groups according to the Paris I criteria: good response was defined as ALP ≤ 3×ULN, AST ≤ 2×ULN, and bilirubin ≤ 17.1μmol/L after 12 months of UDCA treatment.
PBC patients were also divided into VD sufficient, insufficient, deficient, and severely deficient groups based on serum 25(OH)D levels. VD sufficiency was defined as 25(OH)D >30㎍/L, insufficiency as 20–30㎍/L, deficiency as <20㎍/L, and severe deficiency as <10㎍/L.
Statistical Analysis
Data were analyzed using SPSS27.0 software. Normally distributed data were expressed as mean ± standard deviation ( ±s) and compared between groups using independent sample t-tests or analysis of variance. Non-normally distributed data were expressed as median and interquartile range [M(P25, P75)] and compared between groups using independent rank-sum tests. Categorical data were expressed as n (%) and compared using chi-square tests or Fisher’s exact tests. Correlation analyses were performed using Pearson or Spearman correlation analysis. Binary logistic regression was used to analyze factors affecting treatment response, and ROC curves were drawn to analyze their predictive value. P<0.05 was considered statistically significant.
Results
General Information and Laboratory Results of PBC and Control Patients
A total of 123 PBC patients met the inclusion criteria, with an average age of 55.62±10.57 years; 10.57% were male, and 89.43% were female. Based on the age range and gender ratio of the PBC group, 123 control patients were selected for comparative analysis.
When age and gender showed no statistical differences, 25(OH)D levels in the PBC group (17.07 [12.20, 24.08] ㎍/L) were lower than those in the control group (20.23 [16.44, 27.30] ㎍/L). (Figure 1) The LMR in the PBC group (5.44 [3.76, 7.05]) was significantly lower than in the control group (6.91±2.10), with both differences being statistically significant (P<0.01). There were no significant differences in other novel inflammation indicators (P>0.05). Liver function indicators between the two groups showed significant statistical differences (P<0.01) (Table 1).
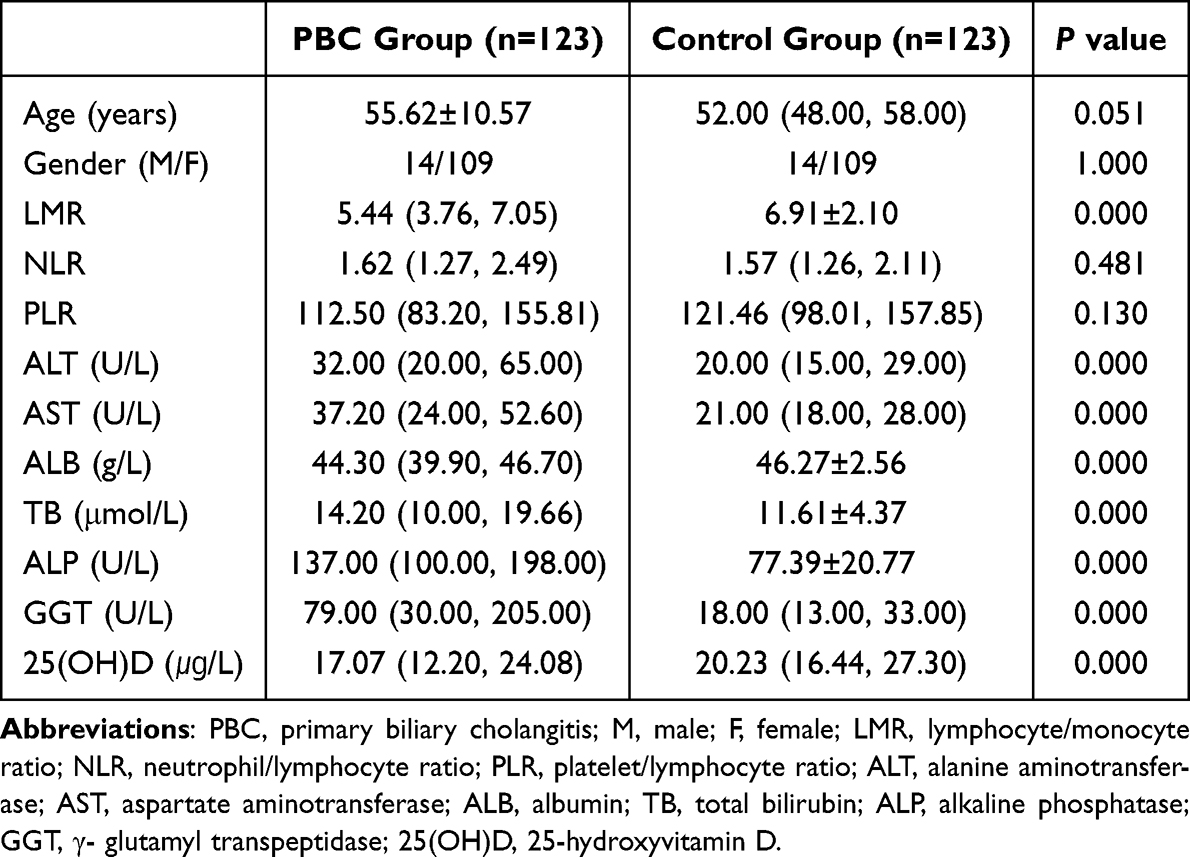 |
Table 1 Comparison of Relevant Data Between the PBC Group and the Control Group |
 |
Figure 1 Comparison of 25(OH)D levels between PBC patients and controls. Abbreviation: PBC, primary biliary cholangitis. |
Vitamin D Levels and Laboratory Tests in PBC Patients
There were significant differences in PLR among different VD level groups, with statistical significance (P<0.05). No significant differences were observed in other laboratory tests (P>0.05). The response rates to UDCA treatment did not show significant differences between the different VD level groups (P>0.05) (Table 2).
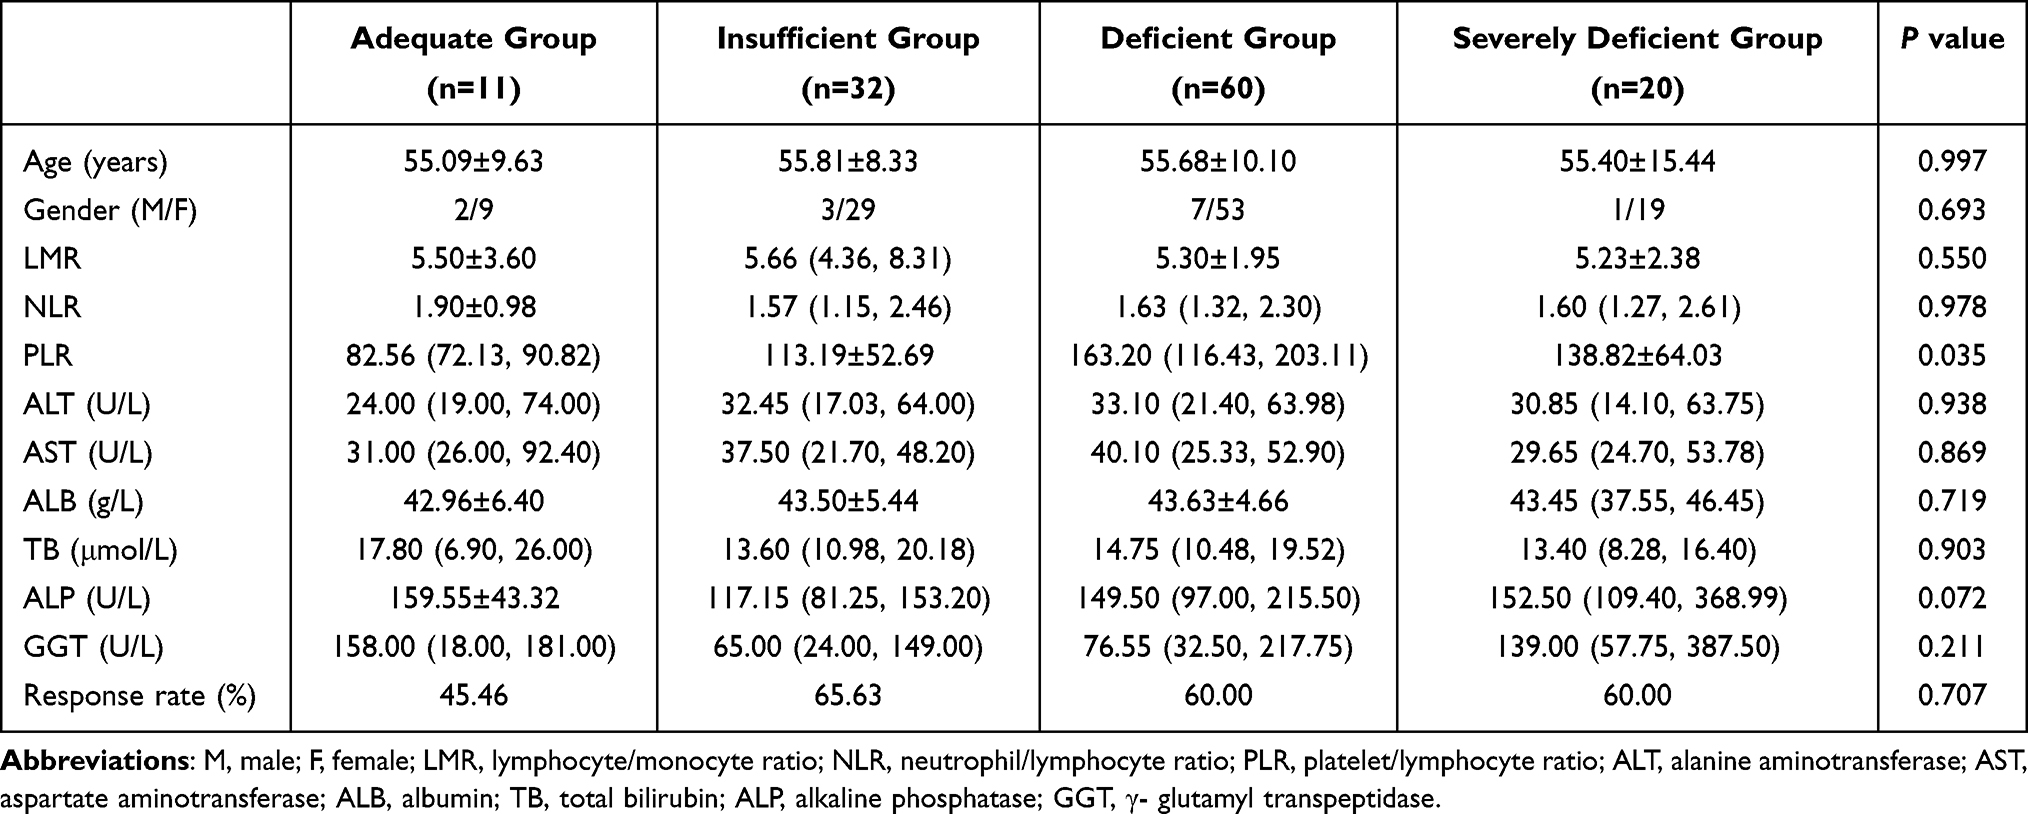 |
Table 2 Comparison Between VD Level and Laboratory Examination |
Correlation Between 25(OH)D and Novel Inflammation Indicators in PBC Patients
Correlation analysis between 25(OH)D and novel inflammation indicators in PBC patients revealed a significant negative correlation between 25(OH)D and PLR (r=−0.252, P<0.01) (Figure 2). No significant correlation was found between 25(OH)D and LMR or NLR (P>0.05) (Table 3).
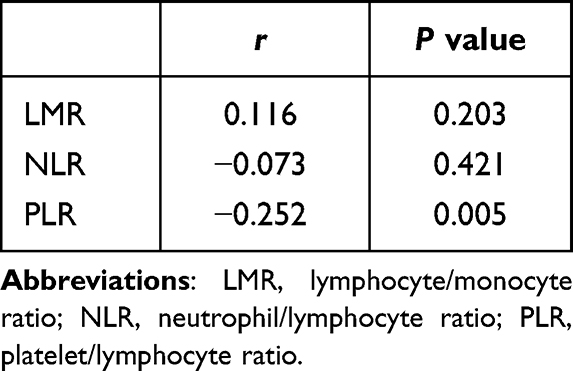 |
Table 3 The Correlation Between 25 (OH) D and Novel Inflammatory Indicators in PBC Patients |
 |
Figure 2 Correlation between 25 (OH) D and PLR. Abbreviations: PLR, platelet/lymphocyte ratio; 25(OH)D, 25-hydroxyvitamin D. |
UDCA Treatment Response in PBC Patients
The good response group had an LMR of 6.09±2.34, higher than the poor response group (4.48 [3.00, 5.98]). The NLR was 1.56 (1.11, 1.97) in the good response group, lower than the poor response group (1.92 (1.55, 3.08)). Both differences were statistically significant (P<0.01). There was no significant difference in PLR between the two groups (P>0.05) (Table 4).
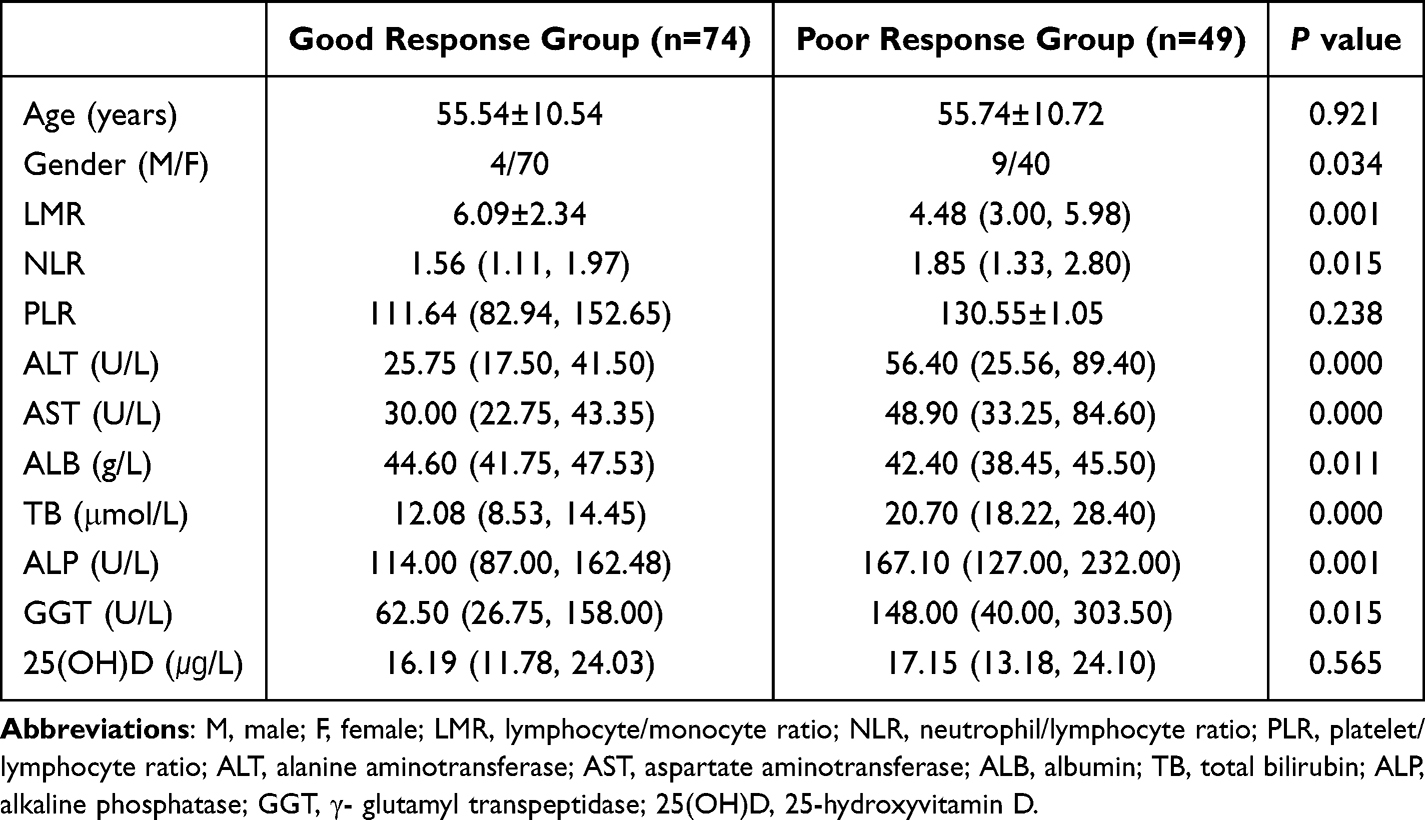 |
Table 4 Comparison of UDCA Treatment Response |
Through single factor binary logistic regression preliminary screening, it was found that besides the factors influencing response specified in the Paris I criteria, LMR, NLR, ALT, ALB, and GGT also significantly affect the treatment response in PBC patients (Table 5).
 |
Table 5 Single Factor Logistic Regression Results |
Consequently, ROC curves were drawn to analyze the predictive value of LMR, NLR, ALT, ALB, and GGT for UDCA treatment response (Table 6 and Figure 3).
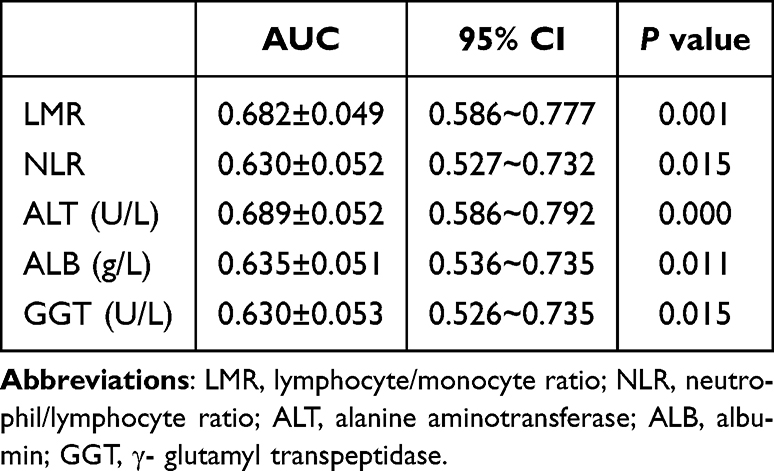 |
Table 6 ROC Curve Related Results |
 |
Figure 3 ROC curve for predicting UDCA treatment response. Abbreviations: LMR, lymphocyte/monocyte ratio; NLR, neutrophil/lymphocyte ratio; ALT, alanine aminotransferase; ALB, albumin; GGT, γ- glutamyl transpeptidase. |
LMR: The area under the curve (AUC) was 0.682±0.049, with an optimal cutoff value of 6.0167. At this cutoff, the sensitivity was 0.486, and the specificity was 0.796.
NLR: The AUC was 0.630±0.052, with an optimal cutoff value of 2.1376. At this cutoff, the sensitivity was 0.811, and the specificity was 0.49.
Perform multiple logistic regression analysis on the statistically significant factors in the single factor regression analysis, and the specific results are shown in Table 7.
 |
Table 7 Multivariate Logistic Regression Results |
Discussion
PBC is an autoimmune disease involving both innate and adaptive immune cells in its pathogenesis. The primary pathological basis of PBC is the immune-mediated destruction of intrahepatic bile duct epithelial cells, predominantly characterized by T lymphocyte infiltration, with the participation of various other immune cells.14 In the biliary system, different types of T cells, such as CD4+ T cells and CD8+ T cells, are present, and alterations in their levels can lead to an imbalance in intrahepatic immune responses, resulting in bile duct epithelial cell damage.15 Among them, CD8+ T cells can cause tissue damage through cytotoxic effects, making them the main effector cells in bile duct epithelial injury. In PBC patients, a significant increase in CD14lowand CD16+ monocytes is observed in peripheral blood, which is associated with the extent of liver damage.16 Changes in the levels of immune cells in the body are correlated with liver and bile duct injury.
LMR can predict the prognosis of various liver diseases, including survival after radiofrequency ablation of hepatocellular carcinoma and mortality in HBV-related cirrhosis. A lower LMR is associated with a poorer prognosis,8,17 and it can also be associated with a higher chance of acute-on-chronic liver failure, reflecting the patient’s prognosis.10 Currently, there are no studies or reports on the relationship between LMR and the prognosis of patients with PBC, and previous research has not mentioned the difference in LMR between PBC patients and healthy individuals. This study found that the LMR in the PBC group was significantly lower than that in the physical examination group, and the LMR in the group with poor UDCA treatment response was lower than that in the good response group, suggesting that LMR may have predictive value for UDCA treatment response, with LMR < 6.0167 possibly indicating a poor response to UDCA treatment. Therefore, it is preliminarily considered that a low LMR is more likely to associated with an occurrence of a poor response to UDCA treatment, leading to relatively poor prognosis.
PBC pathological staging is divided into four stages: cholangitis stage (stage I), periportal inflammation stage (stage II) as early stages, and progressive fibrosis stage (stage III), cirrhosis stage (stage IV) as late stages. Studies have found that NLR (Neutrophil-to-Lymphocyte Ratio) is higher in late-stage PBC patients than in early-stage patients. NLR has certain clinical value in assessing the degree of liver damage in PBC patients, with NLR ≥ 1.8 being an independent risk factor for severe liver damage, and its elevation indicating disease progression.4,5 ZHU18 found that a high NLR is an independent risk factor for poor UDCA treatment response, but there is currently no specific consensus on the normal range of NLR. The study by Liu Tingting9 showed that NLR in PBC patients is significantly higher than in healthy controls, and NLR levels can significantly decrease after treatment in PBC patients, with no statistically significant difference in PLR between PBC patients and healthy individuals. Our study results show no statistically significant differences in NLR and PLR between PBC patients after treatment and the physical examination group. However, among PBC patients, the NLR in the good UDCA response group was lower than in the poor response group, consistent with previous research results, supporting that a high NLR indicates a poor treatment response. After plotting the ROC curve, it was found that NLR>2.1376 indicates poor response to UDCA treatment, which is consistent with previous research results and also supports the idea that high NLR indicates poor treatment response.
VD deficiency is common in patients with chronic liver disease,19 and VD deficiency is independently associated with advanced liver fibrosis.20 PBC patients have significantly lower VD levels than the physical examination group, even lower than patients with other types of cirrhosis, possibly due to both synthetic and absorption disorders of VD in PBC patients. Additionally, studies suggest that low VD levels may be an independent pathogenic factor for PBC,21 and a decrease in VD levels may indicate disease progression.22 Serum VD levels are significantly associated with the risk of incomplete response to UDCA, with lower baseline VD levels more likely to result in a poor response.23 In the study by GUO,24 VD levels were negatively correlated with cholestasis markers and positively correlated with ALB (Albumin), with late-stage patients having higher rates of VD deficiency than early-stage patients. Patients with poor UDCA response had significantly lower pre-treatment VD levels than those with good response, and VD deficiency was independently associated with an increased risk of poor UDCA treatment response. In this study, there were no significant statistical differences in treatment response rates and liver function indicators between different VD level groups, which differs from previous research results. This discrepancy may be due to the relatively small sample size, and the significantly fewer patients in the VD sufficient group compared to the VD deficient group, which may have influenced the study results.
Scholars have found that increasing serum VD levels has a protective effect on PBC.21 In the study by GUO et al24 it was found that the VD deficiency rate in late stage PBC patients was higher than that in early stage patients. Studies have indicated that among novel inflammatory indicators, NLR and PLR are negatively correlated with VD levels,13,25 while LMR is positively correlated with VD levels and serves as a protective factor against acute-on-chronic liver failure in cirrhosis.10 Our study results show that VD levels in PBC patients are negatively correlated with PLR, suggesting that higher PLR is more likely to lead to an occurrence of a poor response to UDCA treatment, based on previous related research results.
Conclusion
In conclusion, low LMR and high NLR may indicate a poor treatment response in PBC patients, and PLR also has certain predictive values. But this conclusion still needs further confirmation through large-scale, multicenter studies in the future.
Data Sharing Statement
The datasets generated and analyzed during the current study are not publicly available because of further study in this area but are available from the corresponding author upon reasonable request.
Ethics Approval and Consent to Participate
The study was approved by the Ordos Central Hospital, and all subjects provided written informed consent before participation in the study, which was performed in accordance with the relevant guidelines and regulations. Also this study complies with the Declaration of Helsinki.
Disclosure
The authors declare that they have no conflicts of interest in this work.
References
1. Lindor KD, Bowlus CL, Boyer J, et al. Primary biliary cholangitis: 2018 practice guidance from the American association for the study of liver diseases. Hepatology. 2019;69(1):394–419. doi:10.1002/hep.30145
2. Lindor KD, Gershwin ME, Poupon R, et al. Primary biliary cirrhosis. Hepatology. 2009;50(1):291–308. doi:10.1002/hep.22906
3. Lu M, Zhou Y, Haller IV, et al. Increasing prevalence of primary biliary cholangitis and reduced mortality with treatment. Clin Gastroenterol Hepatol. 2018;16(8):1342–1350. doi:10.1016/j.cgh.2017.12.033
4. Zhang L, Li Yan YN. Clinical application of blood red blood cell distribution width and neutrophil to lymphocyte ratio in evaluating liver damage in patients with primary biliary cholangitis. J Pract Hepatol. 2022;25(03):367–370.
5. Yang L, Chen XJ, Li BL, et al. Value of red blood cell distribution width, mean platelet volume, and neutrophil-lymphocyte ratio in the evaluation of primary biliary cholangitis. Chinese J Clin Hepatol. 2019;35(12):2772–2775.
6. Yoo JJ, Cho EJ, Lee B, et al. Prognostic value of biochemical response models for primary biliary cholangitis and the additional role of the neutrophil-to-lymphocyte ratio. Gut Liver. 2018;12(6):714–721. doi:10.5009/gnl18271
7. Jin L. A novel predictive model to assess the prognosis of hepatitis B-related acute-on-chronic liver failure using indicators of systemicinflammation and cytokines.Anhui Medical University, 2017.
8. Shen Y, Wang H, Chen X, et al. Prognostic significance of lymphocyte-to-monocyte ratio and platelet-to-lymphocyte ratio in patients with hepatocellular carcinoma undergoing transcatheter arterial chemoembolization and radiofrequency ablation. Onco Targets Ther. 2019;12:7129–7137. doi:10.2147/OTT.S217935
9. Liu TT, Gu ML, Zhang L, et al. Clinical significance of neutrophils/lymphocyte of peripheral blood in patients with primary biliary cirrhosis. J Modern Lab Med. 2016;31(05):127–129.
10. Kuo NR, Hou MC, Chu WC, et al. Low lymphocyte-to-monocyte ratio, calcitriol level, and CD206 level predict the development of acute-on-chronic liver failure in patients cirrhosis with acute decompensation. J Chin Med Assoc. 2023;86(3):265–273. doi:10.1097/JCMA.0000000000000867
11. Bartley J. Vitamin D: emerging roles in infection and immunity. Expert Rev Anti Infect Ther. 2010;8(12):1359–1369. doi:10.1586/eri.10.102
12. Jia J, Wang F, Zhang B, et al. Efficacy of ursodeoxycholic acid combined with calcitriol in treatment of patients with primary biliary cirrhosis. J Pract Hepatol. 2020;23(02):240–243.
13. Akbas EM, Gungor A, Ozcicek A, et al. Vitamin D and inflammation: evaluation with neutrophil-to-lymphocyte ratio and platelet-to-lymphocyte ratio. Arch Med Sci. 2016;12(4):721–727. doi:10.5114/aoms.2015.50625
14. Lleo A, Leung P, Hirschfield GM, et al. The pathogenesis of primary biliary cholangitis: a comprehensive review. Semin Liver Dis. 2020;40(1):34–48. doi:10.1055/s-0039-1697617
15. Gulamhusein AF, Hirschfield GM. Primary biliary cholangitis: pathogenesis and therapeutic opportunities. Nat Rev Gastroenterol Hepatol. 2020;17(2):93–110. doi:10.1038/s41575-019-0226-7
16. Peng A, Ke P, Zhao R, et al. Elevated circulating CD14(low)CD16(+) monocyte subset in primary biliary cirrhosis correlates with liver injury and promotes Th1 polarization. Clin Exp Med. 2016;16(4):511–521. doi:10.1007/s10238-015-0381-2
17. Zhang J, Feng G, Zhao Y, et al. Association between lymphocyte-to-monocyte ratio (LMR) and the mortality of HBV-related liver cirrhosis: a retrospective cohort study. BMJ Open. 2015;5(8):e8033. doi:10.1136/bmjopen-2015-008033
18. Zhu H, Zheng M, He H, et al. High neutrophil-lymphocyte ratio indicates a worse response to ursodeoxycholic acid in primary biliary cholangitis: a retrospective cohort study. BMC Gastroenterol. 2023;23(1):400. doi:10.1186/s12876-023-03031-8
19. Keane J, Elangovan H, Stokes R, et al. Vitamin D and the Liver—Correlation or Cause?. Nutrients. 2018;10(4):496. doi:10.3390/nu10040496
20. Ko BJ, Kim YS, Kim SG, et al. Relationship between 25-hydroxyvitamin D levels and liver fibrosis as assessed by transient elastography in patients with chronic liver disease. Gut Liver. 2016;10(5):818–825. doi:10.5009/gnl15331
21. Xu H, Wu Z, Feng F, et al. Low vitamin D concentrations and BMI are causal factors for primary biliary cholangitis: a mendelian randomization study. Front Immunol. 2022;13:1055953. doi:10.3389/fimmu.2022.1055953
22. Wang Z, Peng C, Wang P, et al. Serum vitamin D level is related to disease progression in primary biliary cholangitis. Scand J Gastroenterol. 2020;55(11):1333–1340. doi:10.1080/00365521.2020.1829030
23. Ebadi M, Ip S, Lytvyak E, et al. Vitamin D is associated with clinical outcomes in patients with primary biliary cholangitis. Nutrients. 2022;14(4):878. doi:10.3390/nu14040878
24. Guo GY, Shi YQ, Wang L, et al. Serum vitamin D level is associated with disease severity and response to ursodeoxycholic acid in primary biliary cirrhosis. Aliment Pharmacol Ther. 2015;42(2):221–230. doi:10.1111/apt.13244
25. Konuksever D, Yucel KS, Boluk O, et al. The association of vitamin D deficiency with hemogram-derived inflammatory biomarkers in children. Nutr Metab Cardiovasc Dis. 2022;32(10):2418–2423. doi:10.1016/j.numecd.2022.07.012
 © 2025 The Author(s). This work is published and licensed by Dove Medical Press Limited. The
full terms of this license are available at https://www.dovepress.com/terms
and incorporate the Creative Commons Attribution
- Non Commercial (unported, 3.0) License.
By accessing the work you hereby accept the Terms. Non-commercial uses of the work are permitted
without any further permission from Dove Medical Press Limited, provided the work is properly
attributed. For permission for commercial use of this work, please see paragraphs 4.2 and 5 of our Terms.
© 2025 The Author(s). This work is published and licensed by Dove Medical Press Limited. The
full terms of this license are available at https://www.dovepress.com/terms
and incorporate the Creative Commons Attribution
- Non Commercial (unported, 3.0) License.
By accessing the work you hereby accept the Terms. Non-commercial uses of the work are permitted
without any further permission from Dove Medical Press Limited, provided the work is properly
attributed. For permission for commercial use of this work, please see paragraphs 4.2 and 5 of our Terms.