Back to Journals » International Journal of Chronic Obstructive Pulmonary Disease » Volume 11 » Issue 1
Application of the homology method for quantification of low-attenuation lung region in patients with and without COPD
Authors Nishio M, Nakane K, Tanaka Y
Received 13 April 2016
Accepted for publication 30 May 2016
Published 6 September 2016 Volume 2016:11(1) Pages 2125—2137
DOI https://doi.org/10.2147/COPD.S110504
Checked for plagiarism Yes
Review by Single anonymous peer review
Peer reviewer comments 2
Editor who approved publication: Prof. Dr. Richard Russell
Mizuho Nishio,1 Kazuaki Nakane,2 Yutaka Tanaka3
1Clinical PET Center, Institute of Biomedical Research and Innovation, Hyogo, Japan; 2Department of Molecular Pathology, Osaka University Graduate School of Medicine and Health Science, Osaka, Japan; 3Department of Radiology, Chibune General Hospital, Osaka, Japan
Background: Homology is a mathematical concept that can be used to quantify degree of contact. Recently, image processing with the homology method has been proposed. In this study, we used the homology method and computed tomography images to quantify emphysema.
Methods: This study included 112 patients who had undergone computed tomography and pulmonary function test. Low-attenuation lung regions were evaluated by the homology method, and homology-based emphysema quantification (b0, b1, nb0, nb1, and R) was performed. For comparison, the percentage of low-attenuation lung area (LAA%) was also obtained. Relationships between emphysema quantification and pulmonary function test results were evaluated by Pearson’s correlation coefficients. In addition to the correlation, the patients were divided into the following three groups based on guidelines of the Global initiative for chronic Obstructive Lung Disease: Group A, nonsmokers; Group B, smokers without COPD, mild COPD, and moderate COPD; Group C, severe COPD and very severe COPD. The homology-based emphysema quantification and LAA% were compared among these groups.
Results: For forced expiratory volume in 1 second/forced vital capacity, the correlation coefficients were as follows: LAA%, -0.603; b0, -0.460; b1, -0.500; nb0, -0.449; nb1, -0.524; and R, -0.574. For forced expiratory volume in 1 second, the coefficients were as follows: LAA%, -0.461; b0, -0.173; b1, -0.314; nb0, -0.191; nb1, -0.329; and R, -0.409. Between Groups A and B, difference in nb0 was significant (P-value = 0.00858), and those in the other types of quantification were not significant.
Conclusion: Feasibility of the homology-based emphysema quantification was validated. The homology-based emphysema quantification was useful for the assessment of emphysema severity.
Keywords: homology, emphysema, COPD, low-attenuation lung region
Introduction
According to the Global initiative for chronic Obstructive Lung Disease (GOLD) guidelines, COPD is characterized by chronic airflow limitation, which is usually progressive and associated with an inflammatory response of the lungs to noxious particles or gases.1 The airflow limitation is usually associated with respiratory symptoms (chronic cough, dyspnea, and sputum).1 COPD is a leading cause of morbidity and mortality worldwide and is projected to be the fourth leading cause of death globally by 2030.2
Technical advances in computed tomography (CT) facilitated evaluation of the structural changes caused by COPD, such as emphysema and thickening of airway walls.3–9 Previous studies have shown that quantitative evaluation by CT is useful for assessing the severity of COPD by evaluating these structural changes. Because emphysema and airway disease are two major features of COPD and their contribution to COPD severity varies from patient to patient, the importance of CT-based phenotyping by quantitative evaluation of COPD has been increasingly recognized.8
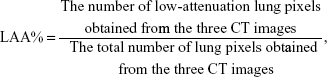
For quantification of emphysema, the percentage of low-attenuation lung area (LAA%) has been frequently determined by CT, and LAA% was obtained as the percentage of the number of low-attenuation lung pixels to the total number of lung pixels,3 where low-attenuation lung pixels were defined as pixels with CT values less than the predefined threshold (eg, −950 HU). Although LAA% has been associated with COPD severity,9 no single type of quantification can guarantee an accurate assessment of emphysema. Because spatial distribution of low-attenuation lung regions was ignored in LAA%, it is expected that emphysema can be quantified more accurately by analyzing the spatial distribution of low-attenuation lung regions. Figure 1 shows representative images for LAA% = 30% obtained from a simulation study (in Figure 1, white pixels represent normal lung pixels, and black pixels represent low-attenuation lung pixels). Although LAA% of Figure 1A and B was the same, the spatial distribution of low-attenuation lung regions was visually different between these images. That is to say, LAA% cannot be used for evaluating the spatial distribution of low-attenuation lung regions. To overcome this problem of LAA%, it is necessary to develop other types of emphysema quantification.
 | Figure 1 Representative images of the binarized images at the percentage of low-attenuation lung area =30% obtained in the simulation study. |
Homology is a mathematical concept that can be used as a basis for the measurement of the degree of connectivity,10,11 and the Betti number is an important index of homology. In general, tissues (structures) consist of different types of elements, and contact (boundary) occurs between the elements. Because the homology method calculates the contact degree of tissues (structures), this method has been applied in many fields.12–16 For example, Nakane et al12,13 proposed a new method for evaluating digital pathology images of the colon, in which the Betti numbers were extracted from the region of interest of the pathology images. Their results show that it was possible to use the Betti numbers for screening of colon cancer. This method does not require training using a library of images because the Betti numbers are derived directly from the images. Notably, the time required to calculate these numbers is very short; using an ordinary computer, calculation of the Betti numbers only requires approximately 3.0 seconds.12,13
In this study, we hypothesized that homology could be used for evaluating the spatial distribution of low-attenuation lung regions, and that homology-based emphysema quantification would be useful for determining the severity of emphysema. Visually, emphysema corresponds to the “holes” in the lung tissue. Originally, the concept of homology was that figures can be distinguished by their “holes”. Therefore, we speculated that the homology method could be applied in order to quantify emphysema. The purpose of this study was 1) to validate the usefulness of homology-based emphysema quantification to evaluate the spatial distribution of low-attenuation lung regions, 2) to evaluate the feasibility of the homology method for determining the severity of emphysema, and 3) to compare the homology-based emphysema quantification with LAA% and the pulmonary function test (PFT) in patients with and without COPD.
Methods
This retrospective study was approved by the institutional review boards of Institute of Biomedical Research and Innovation and Chibune General Hospital. Acquisition of informed consent was waived by the review board.
Homology
Although expert knowledge of mathematics is required to fully comprehend the concept of homology, in two-dimensional cases (eg, image analysis), use of homology is quite simple. In the two-dimensional cases, the Betti numbers consist of two numbers: b0 (the zero-dimensional Betti number), which is the number of connected components, and b1 (the one-dimensional Betti number), which is the number of one-dimensional or “circular” holes. In the current study, b0 corresponded to the number of low-attenuation lung regions caused by emphysema, and b1 corresponded to the number of normal lung regions surrounded by the low-attenuation lung regions. To calculate b0 and b1, we used the free software, CHomP.12,13,17 In calculating the homology-based emphysema quantification, CT image must be converted to a binarized image in which each pixel could have two values: 0 and 1 (0 representing a low-attenuation lung pixel and 1 representing a normal lung pixel).
Simulation study
First, a simulation study was conducted in order to investigate the relationship between the homology-based emphysema quantification and LAA% and to validate whether the homology was associated with the spatial distribution of low-attenuation lung regions. A binarized image (image size 256×256) was prepared in which each pixel could have two values: 0 and 1. Before the simulation started, the values of all pixels in the binarized images were 1. Then, in one simulation (simulation A), the pixel value was randomly replaced with 0. In the other simulation (simulation B), the pixel value was randomly replaced with 0 at a probability of 20%, and the neighboring pixel value of the existing low-attenuation lung regions was replaced with 0 at a probability of 80%. In both simulations, the replacement was continued until the LAA% of the images reached the predefined value. For the predefined value of LAA%, the following values were used: 10%, 15%, 20%, 25%, 30%, 35%, 40%, 45%, and 50%. The binarized images after the replacement were evaluated by CHomP, and b0 and b1 were calculated. In this simulation, because LAA% was the same in simulations A and B, and the generation process of low-attenuation lung pixels was different, we speculated that the differences in the homology-based emphysema quantification reflected the spatial distribution of the normal lung regions and low-attenuation lung regions caused by the generation process. In addition, the relationship between R (= b1/b0)12,13 and LAA% was examined by plotting R and LAA%.
Patients
Next, a clinical study was conducted. Patients who visited our institution because of their respiratory symptoms were examined retrospectively. If the patient underwent both CT and PFT and the interval between CT and PFT was <90 days, the patient was included in the study. Diagnosis and classification of COPD were performed according to the GOLD guideline.1 This study included 112 consecutive patients (84 males and 28 females; age, 67.8±10.9 years). The mean smoking history of these patients was 36.8±44.7 pack-years, and the mean interval between CT and PFT was 17.7±36.7 days. Among the 112 patients, 49 patients were diagnosed as having COPD; 48 were smokers without COPD, and 15 were nonsmokers without COPD.
CT scan
Non-contrast helical CT scans were acquired from the lung apices through the lung bases using a 320-detector row scanner (Aquilion ONE; Toshiba Medical Systems, Otawara, Japan) with automated exposure control. After receiving careful instruction about breathing, the patients were scanned in the supine position during a deep inspiratory breath hold. The scan parameters were as follows: tube current, 193±67.5 mA; tube potential, 120 kV; gantry rotation time, 0.35 seconds in one patient, 0.6 seconds in two patients, and 0.5 seconds in all other patients; and noise index of automated exposure control, 10. Raw CT data were reconstructed into 5 mm thick images using a soft-tissue kernel (FC 13 or 14). The CT scanner was calibrated regularly.
PFT
The PFT was performed by an automated spirometer (HI-801 or CHESTAC-8900, Chest M.I., Inc., Tokyo, Japan). Forced expiratory volume in 1 second (FEV1), forced vital capacity (FVC), and the ratio of FEV1 to FVC (FEV1/FVC) were obtained. Apart from FEV1/FVC, these parameters were expressed as percentages of the standard predicted values.
Quantitative evaluation of emphysema
As previously described, three CT images of the upper, middle, and lower (Figure 2) lung fields were selected for each patient.4 Then, the lungs were automatically segmented from the three CT images by region-growing and a threshold of −500 HU. The results of lung segmentation were validated visually by one board-certified radiologist (MN). The results of lung segmentation were represented as binary images, as shown in Figure 2B. After the lung segmentation, LAA% was calculated as follows:
|
|
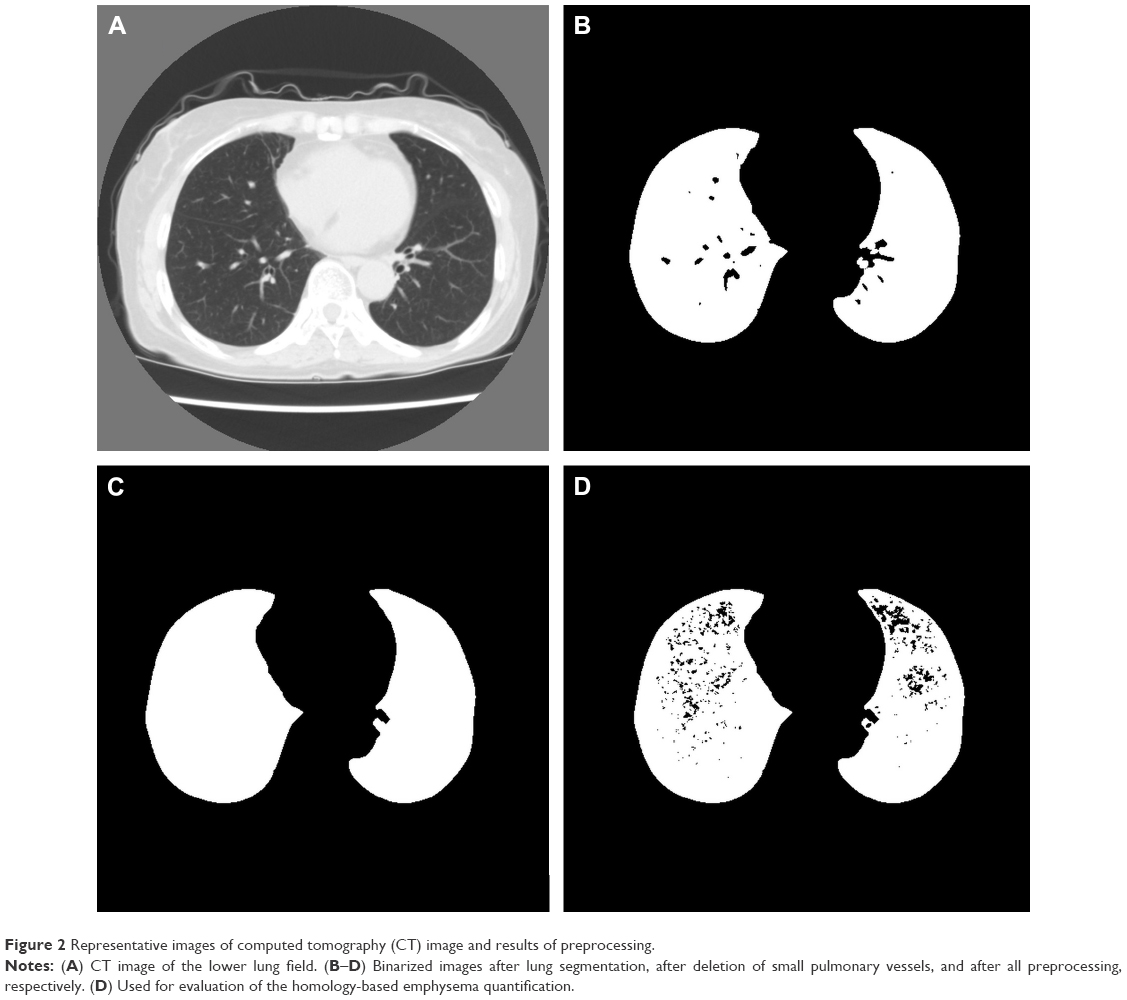 | Figure 2 Representative images of computed tomography (CT) image and results of preprocessing. |
where low-attenuation lung pixels were defined as pixels with CT values less than −950 HU. Approximately, LAA% corresponds to the percentage of black lung pixels in Figure 2D.
To calculate the homology-based emphysema quantification, preprocessing of the three CT images was necessary. First, small pulmonary vessels in the results of lung segmentation were deleted by morphological closing to emphasize the low-attenuation lung pixels caused by emphysema. Representative images of lung segmentation before and after the deletion of small pulmonary vessels are shown in Figure 2B and C, respectively. Then, the results of lung segmentation and CT images were analyzed pixel by pixel. If the pixel belonged to a lung pixel and the CT value of the pixel was <-950 HU, the value of the results of lung segmentation was replaced with 0. After this step, 1 in the binarized image indicated a normal lung pixel, and 0 indicated a non-lung pixel or low-attenuation lung pixel. A representative image after the whole preprocessing step is shown in Figure 2D.
After preprocessing, the binarized images were evaluated with CHomP to calculate the homology-based emphysema quantification. For each patient, b0 and b1 for the three binarized images were summed, and the summed value was used for the following statistical analyses. R (= b1/b0) was also calculated. In addition, b0 and b1 were normalized to the total number of lung pixels obtained from the three CT images and referred to as nb0 and nb1, respectively.
Statistical analysis
To test whether the quantification reflected the severity of COPD, Pearson’s correlation coefficients were calculated between the results of CT quantification and PFT. Correlation between LAA% and the homology-based emphysema quantification was also evaluated.
Next, the 112 patients were divided into three groups: Group A, nonsmokers; Group B, smokers without COPD, mild COPD, and moderate COPD; Group C, severe COPD and very severe COPD. Here, COPD severity was determined based on the GOLD guidelines.1 The homology-based emphysema quantification and LAA% were compared among these three groups. The difference in the homology-based emphysema quantification and LAA% was tested by a Student’s t-test, and P-values <0.0167 determined by Bonferroni correction were considered to indicate statistical significance.
Finally, linear models were used to investigate the relationship between the PFT results and emphysema quantification. One linear model was built to predict FEV1, and another was built to predict FEV1/FVC. In each model, the homology-based emphysema quantification (nb0, nb1, and R), patient sex, patient age, and smoking history were included as predictive variables, and uninformative variables were excluded from the models by stepwise regression on the basis of Akaike information criterion (AIC) values.18 For comparison, linear models with LAA%, patient sex, patient age, and smoking history were also evaluated by stepwise regression and AIC. The model with a lower AIC was better for predicting PFT results. Because the correlation coefficients between R and LAA% were high, LAA% and the homology-based emphysema quantification were not included in the same linear model. The coefficients of the predictive variables were evaluated according to their P-values. P-values <0.05 were considered to indicate statistical significance. All analyses were performed by R-3.1.1 (available at http://www.r-project.org/). The MASS package was used for stepwise regression.
Results
The results of homology-based emphysema quantification in the simulation study are shown in Table 1. Figure 1A and B show representative images for LAA% = 30% obtained from the simulations A and B, respectively. Figure S1 shows all images used in the simulations. Table 1 shows that b0, b1, and R were different between simulations A and B even when LAA% was the same. Because the generation process of low-attenuation lung pixels was different between simulations A and B, this result suggests that the differences in the spatial distribution of normal lung regions and low-attenuation lung regions were associated with those of the homology-based emphysema quantification. In Figure 3, R and LAA% of Table 1 are plotted on semi-log graphs. According to Figure 3, the relationships between R and LAA% were exponential and represented as:
R = 0.000307 × e0.193 × LAA% | (2) |
in Figure 3A and
R = 0.0496 × e0.0682 × LAA% | (3) |
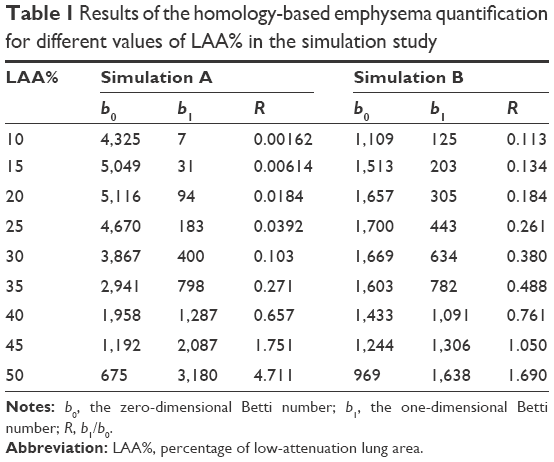 | Table 1 Results of the homology-based emphysema quantification for different values of LAA% in the simulation study |
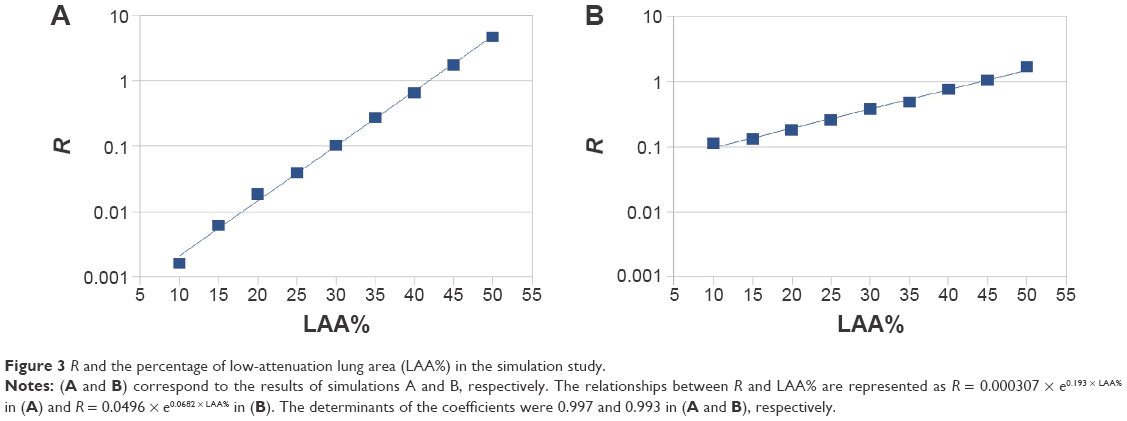 | Figure 3 R and the percentage of low-attenuation lung area (LAA%) in the simulation study. |
in Figure 3B.
Patient characteristics, PFT results, and emphysema quantification results are summarized in Table 2. These values in nonsmokers, smokers without COPD, mild COPD, moderate COPD, severe COPD, and very severe COPD are summarized in Tables S1 and S2 of the Supplementary materials. Figures S2–S4 in the Supplementary materials show representative CT images and the binarized images after preprocessing.
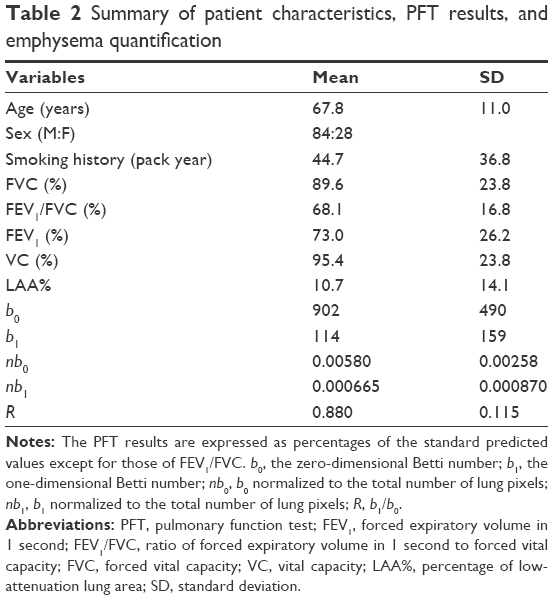 | Table 2 Summary of patient characteristics, PFT results, and emphysema quantification |
Table 3 shows the Pearson’s correlation coefficients among the homology-based emphysema quantification, PFT results, and LAA%. Table 3 shows that b1, nb1, and R had moderate correlation with FEV1. In contrast, the correlation coefficients of b0 and nb0 were weak. For FEV1/FVC, each of the homology-based emphysema quantifications had moderate correlation. The Pearson’s correlation coefficients between R and FEV1 and between R and FEV1/FVC were −0.409 and −0.574, respectively. The Pearson’s correlation coefficients between LAA% and FEV1 and between LAA% and FEV1/FVC were −0.461 and −0.603, respectively. The homology-based emphysema quantification had relatively strong correlation with LAA%. Especially, the coefficient between R and LAA% was more than 0.9.
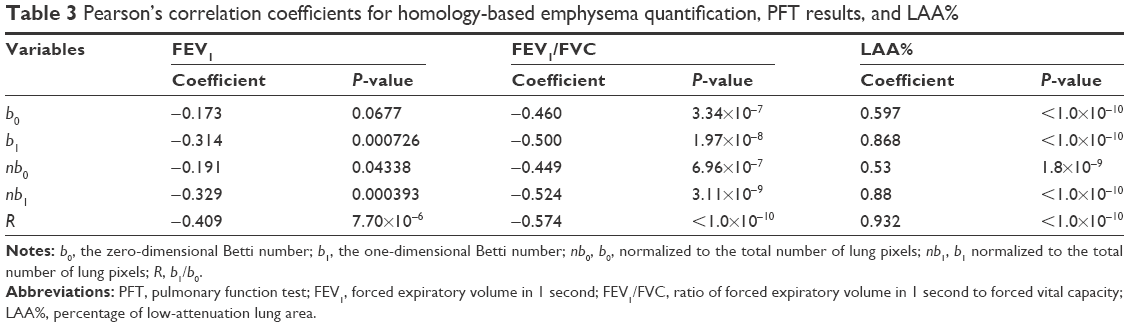 | Table 3 Pearson’s correlation coefficients for homology-based emphysema quantification, PFT results, and LAA% |
The emphysema quantification among Groups A, B, and C are summarized in Table S1. And, the results of Student’s t-tests among Groups A, B, and C are summarized in Table 4. As shown in Table 4, between Groups A and B, the difference in nb0 was statistically significant, and those in the other types of quantification were not statistically significant. On the contrary, between Groups B and C, the difference in nb0 was not statistically significant.
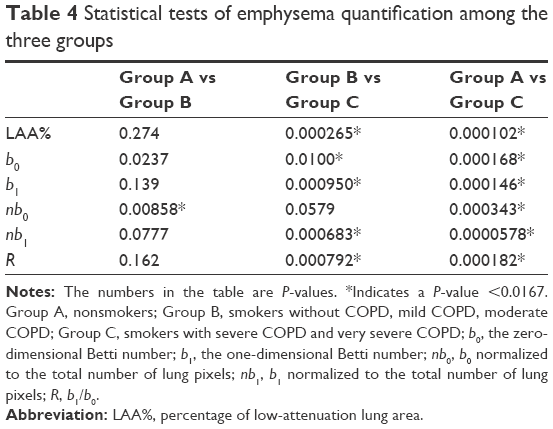 | Table 4 Statistical tests of emphysema quantification among the three groups |
Table 5 shows the results of the linear models. As shown in Table 5, the model predicting FEV1 was:
|
|
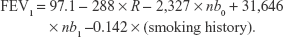
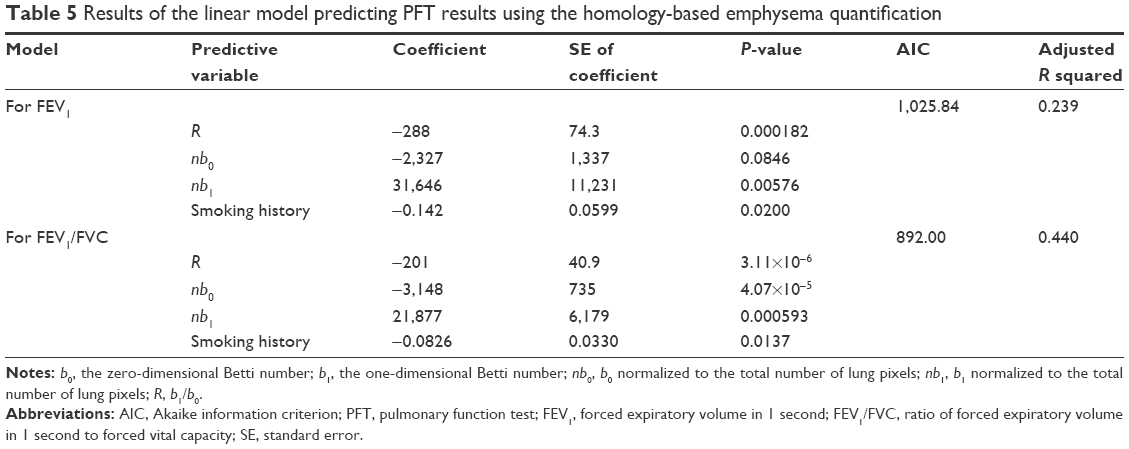 | Table 5 Results of the linear model predicting PFT results using the homology-based emphysema quantification |
Stepwise regression excluded patient age and patient sex from the model. Although the model included nb0, the coefficients of this variable were not statistically significant. In this model, the adjusted R squared and AIC were 0.239 and 1,025.84, respectively. In the LAA% model predicting FEV1, LAA% and smoking history were selected by stepwise regression, and adjusted R squared and AIC were 0.228 and 1,025.52, respectively. The model predicting FEV1/FVC was:
|
|
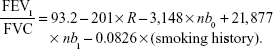
Stepwise regression excluded patient age and patient sex from the model. In this model, the adjusted R squared and AIC were 0.440 and 892.00, respectively. In the LAA% model predicting FEV1/FVC, LAA% and smoking history were selected by stepwise regression, and the adjusted R squared and AIC were 0.372 and 902.93, respectively. According to the AIC values, for predicting FEV1 and FEV1/FVC, the models with homology-based emphysema quantification were comparable with or better than the models with LAA%.
Discussion
To our knowledge, this was the first study to perform homology-based emphysema quantification. The results of the simulation study clarified the usefulness of the homology-based emphysema quantification for assessing the spatial distribution of low-attenuation lung regions and validated that the relationship between R and LAA% was exponential. The clinical study demonstrated that the correlation between the homology-based emphysema quantification and PFT was comparable with that between LAA% and PFT. In addition, Table 4 shows that nb0 was more useful for evaluating early changes in COPD than was LAA%. The results of linear models predicting PFT showed that the models with homology-based emphysema quantification were comparable with or better than the models with LAA%. According to these results, the homology-based emphysema quantification obtained by the dedicated software was useful for assessing emphysema.
Because the disease distribution of emphysema was ignored in LAA%, it is expected that emphysema can be quantified more accurately by analyzing the size and spatial distribution of low-attenuation lung regions. For example, Mishima et al showed that D, obtained by analyzing the size distribution of low-attenuation lung regions, is a parameter for detection of the terminal airspace enlargement.4 In line with this trend, we hypothesized that the spatial distribution of emphysema could be evaluated by the homology method. The two parameters of homology, b0 and b1, correspond to the numbers of connected components and “circular” holes, respectively.10,11 The connected components corresponded to the low-attenuation lung regions in the present study. Therefore, b0 is large in patients with emphysema. Concerning b1, the “circular” holes corresponded to the normal lung regions surrounded by the low-attenuation lung regions in the present study. Therefore, on the CT images of the patients without emphysema, b1 was low. In contrast, in the patients with emphysema, because the normal lung regions were divided into several regions by the low-attenuation lung regions, b1 was increased. Considering these properties of the two parameters, we speculated that b0 and b1 are associated with the spatial distribution of normal lung regions and low-attenuation lung regions. The results of the simulation study also suggest that it was possible to evaluate the difference in the spatial distribution of normal lung regions and low-attenuation lung regions by the homology method. In addition, the results of Table 3 show that the homology-based emphysema quantification correlated with FEV1 and FEV1/FVC. These results validated the usefulness of homology for emphysema quantification.
According to Table 4, the difference in nb0 values was statistically significant between Groups A and B, and that in LAA% was not significant. This implies that nb0 was more useful for evaluating early changes in COPD than was LAA%. LAA% was easily affected by noise, especially when LAA% was low. Consequently, it was difficult to differentiate between Groups A and B using LAA%. We speculate that, by evaluating the spatial distribution of low-attenuation lung regions, nb0 can provide more accurate information about early changes in COPD than can LAA%. In contrast, nb0 was less sensitive to the progression of COPD than was LAA%. According to the simulation study (Table 1), b0 at low LAA% was higher than b0 at high LAA%. Because large low-attenuation lung regions were formed in high LAA%, b0 was low in high LAA%. In short, in severe emphysema, b0 or nb0 was not suitable for assessing emphysema. Considering these results, we suggest that although nb0 is less useful in severe emphysema than was LAA%, nb0 can be used for evaluating early changes in COPD.
Table 5 shows that the homology-based emphysema quantification was useful for predicting airflow limitations measured by PFT. In the models with homology-based emphysema quantification of Table 5, R was the strongest variable among the predictors. Because R was highly correlated with LAA%, airflow limitation was mainly associated with the percentage of emphysema. In contrast, because nb0 and nb1 were also used in the linear models, the homology-based emphysema quantification provided additional value for assessment of airflow limitation. According to a previous study, combined use of LAA% and D led to better evaluation of COPD.19 The results of the previous study and the current study suggest that COPD severity could be quantified more accurately by analyzing the size and spatial distribution of low-attenuation lung regions.
Although the results of the simulation study show that the relationship between R and LAA% was exponential, this relationship was retained only when the generation process of low-attenuation lung pixels was fixed. In the clinical cases, the generation process of low-attenuation lung pixels, which is associated with the mechanism of emphysema progression, was not apparent. Conversely, we speculated that by analyzing the spatial distribution of normal lung regions and low-attenuation lung regions with b0, b1, and R, the generation process of low-attenuation lung pixels could be evaluated. For example, according to the simulation study, R was lower in Figure 1A than in Figure 1B, whereas LAA% was the same. Considering this example, combined use of LAA% and R can help to evaluate whether the spatial distribution of low-attenuation lung regions is random or not. Previous studies have shown that, by evaluating the spatial distribution of emphysema, homogeneous distribution of emphysema tended to result in worse pulmonary function in COPD patients.20,21 In these studies, LAA% values were used to assess the spatial distribution of emphysema. Although our results are preliminary, LAA% and the homology-based emphysema quantification may provide more detailed information about the spatial distribution of emphysema than can LAA% only.
There were several limitations in this study. First, this was a retrospective study, and the number of patients was relatively small. Second, two-dimensional image analyses were performed. Recently, CT quantification based on thin-slice CT images has been used frequently. In the present study, two-dimensional image analyses were used to validate the feasibility and usefulness of the homology-based emphysema quantification. In the future, we will extend our method to the three-dimensional cases. Finally, the homology-based emphysema quantification was mainly related to the spatial distribution of low-attenuation lung regions, and the size distribution was ignored in this method. To evaluate emphysema severity accurately, we think that the size and spatial distribution of low-attenuation lung regions should be evaluated for accurate quantification of emphysema.
Conclusion
In conclusion, feasibility of the homology-based emphysema quantification was validated. By evaluating the spatial distribution of low-attenuation lung regions, the homology-based emphysema quantification could provide more accurate information about early changes in COPD than can LAA%. The homology-based emphysema quantification was useful for the assessment of emphysema severity.
Acknowledgment
This study was supported by JSPS KAKENHI Grant-in-Aid for Scientific Research (B) (Grant Number 26310209).
Disclosure
The authors report no conflicts of interest in this work.
References
Vestbo J, Hurd SS, Agustí AG, et al. Global strategy for the diagnosis, management, and prevention of chronic obstructive pulmonary disease: GOLD executive summary. Am J Respir Crit Care Med. 2013;187(4):347–365. | ||
Mathers CD, Loncar D. Projections of global mortality and burden of disease from 2002 to 2030. PLoS Med. 2006;3(11):e442. | ||
Müller NL, Staples CA, Miller RR, Abboud RT. “Density mask”. An objective method to quantitate emphysema using computed tomography. Chest. 1988;94(4):782–787. | ||
Mishima M, Hirai T, Itoh H, et al. Complexity of terminal airspace geometry assessed by lung computed tomography in normal subjects and patients with chronic obstructive pulmonary disease. Proc Natl Acad Sci U S A. 1999;96(16):8829–8834. | ||
Nakano Y, Muro S, Sakai H, et al. Computed tomographic measurements of airway dimensions and emphysema in smokers. Correlation with lung function. Am J Respir Crit Care Med. 2000;162(3 Pt 1):1102–1108. | ||
Lee YK, Oh YM, Lee JH, et al. Quantitative assessment of emphysema, air trapping, and airway thickening on computed tomography. Lung. 2008;186(3):157–165. | ||
Mets OM, Murphy K, Zanen P, et al. The relationship between lung function impairment and quantitative computed tomography in chronic obstructive pulmonary disease. Eur Radiol. 2012;22(1):120–128. | ||
Galbán CJ, Han MK, Boes JL, et al. Computed tomography-based biomarker provides unique signature for diagnosis of COPD phenotypes and disease progression. Nat Med. 2012;18(11):1711–1715. | ||
Tanabe N, Muro S, Hirai T, et al. Impact of exacerbations on emphysema progression in chronic obstructive pulmonary disease. Am J Respir Crit Care Med. 2011;183(12):1653–1659. | ||
Herzog J, Hibi T. Monomial Ideals. London: Springer-Verlag; 2010. | ||
Gross JL, Tucker TW. Topological Graph Theory. Wiley Interscience; 1987. Paperback edition by Dover Publications; 2001. | ||
Nakane K, Takiyama A, Mori S, Matsuura N. Homology-based method for detecting regions of interest in colonic digital images. Diagn Pathol. 2015;10:36. | ||
Nakane K, Tsuchihashi Y, Matsuura N. A simple mathematical model utilizing topological invariants for automatic detection of tumor areas in digital tissue images. Diagn Pathol. 2013;8(Suppl 1):S27. | ||
Ishida M, Kida K, Mizobe K, et al. Relation between the Betti Number of Fatigue Fracture Surfaces and Stress Intensity Factors of Low Carbon Steel (JIS, S45C). Advanced Materials Research. 2015;1102:59–63. | ||
Nakane K, Santos EC, Honda T, et al. Homology analysis of structures of high carbon bearing steel: effect of repeated quenching on prior austenite grain size. Materials Research Innovations. 2014;18(Suppl 1):33–37. | ||
Adcock A, Rubin D, Carlsson G. Classification of hepatic lesions using the matching metric. Computer Vision and Image Understanding. 2014;121:36–42. | ||
Mischaikow K. CHomP, Computational Homology Project. Available from: http://chomp.rutgers.edu/. Accessed July 14, 2016. | ||
Akaike H. A new look at the statistical model identification. IEEE Transactions on Automatic Control. 1974;19(6):716–723. | ||
Nishio M, Matsumoto S, Koyama H, et al. Emphysema quantification by combining percentage and size distribution of low-attenuation lung regions. AJR Am J Roentgenol. 2014;202(5):W453–W458. | ||
Ju J, Li R, Gu S, et al. Impact of emphysema heterogeneity on pulmonary function. PLoS One. 2014;9(11):e113320. | ||
Tanabe N, Muro S, Tanaka S, et al. Emphysema distribution and annual changes in pulmonary function in male patients with chronic obstructive pulmonary disease. Respir Res. 2012;13:31. |
Supplementary materials
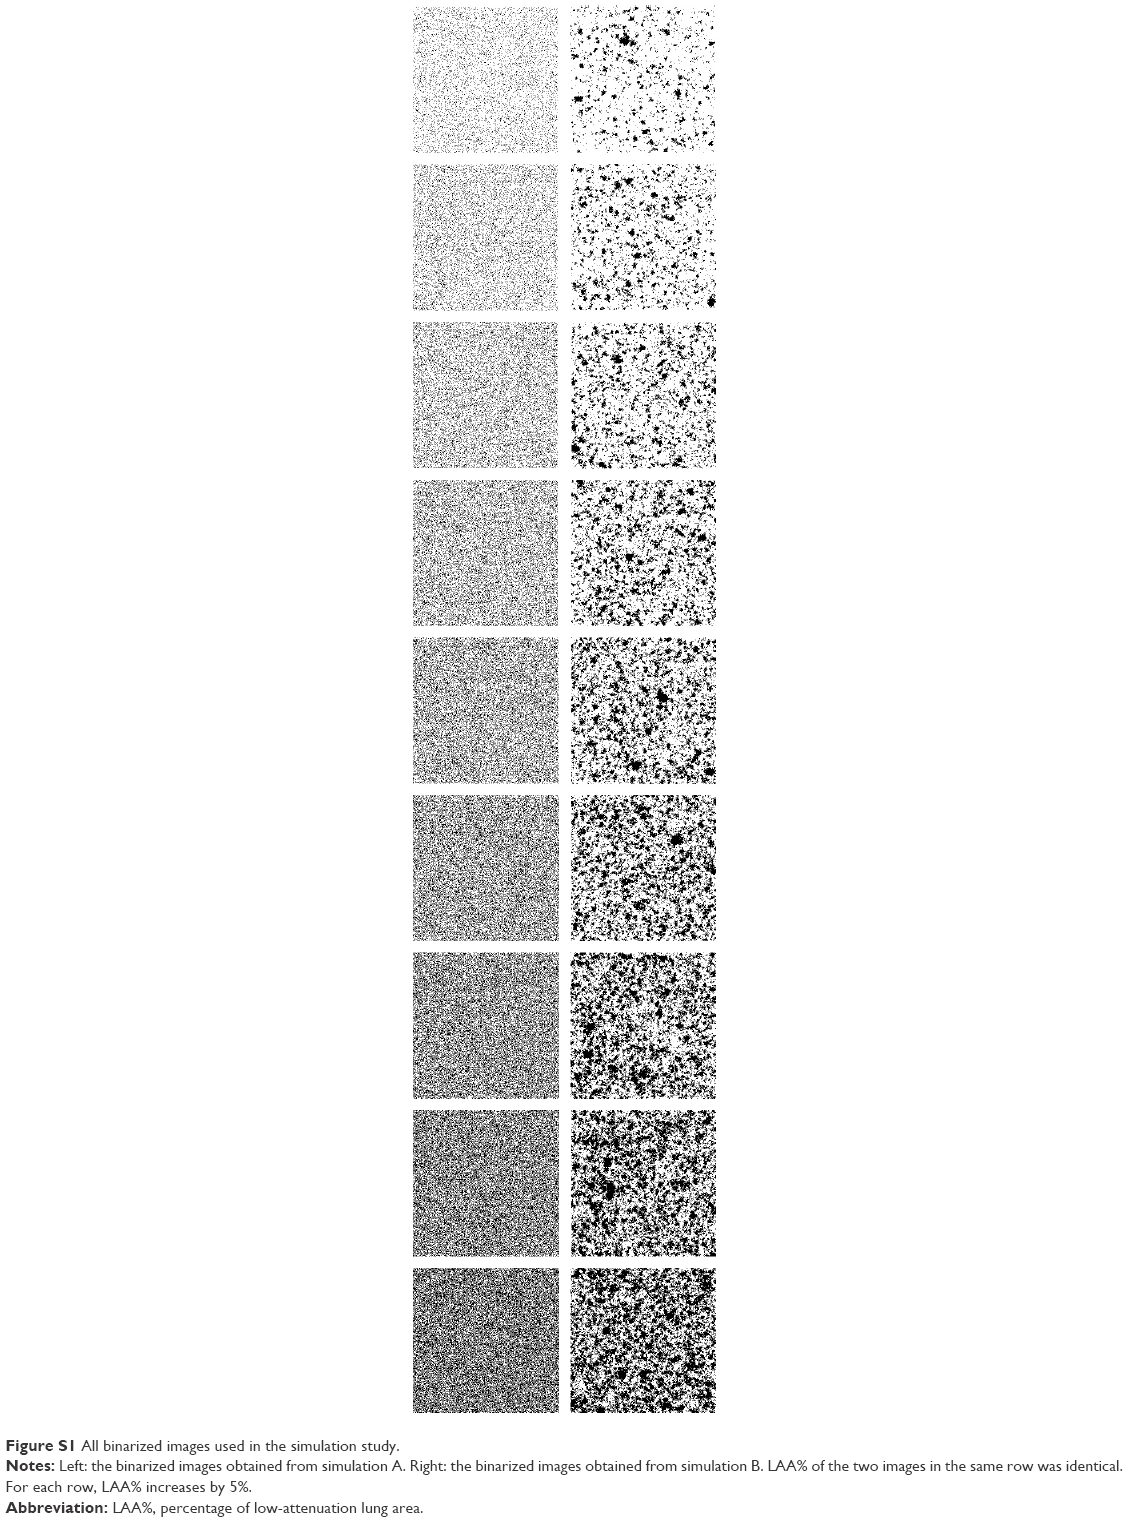 | Figure S1 All binarized images used in the simulation study. |
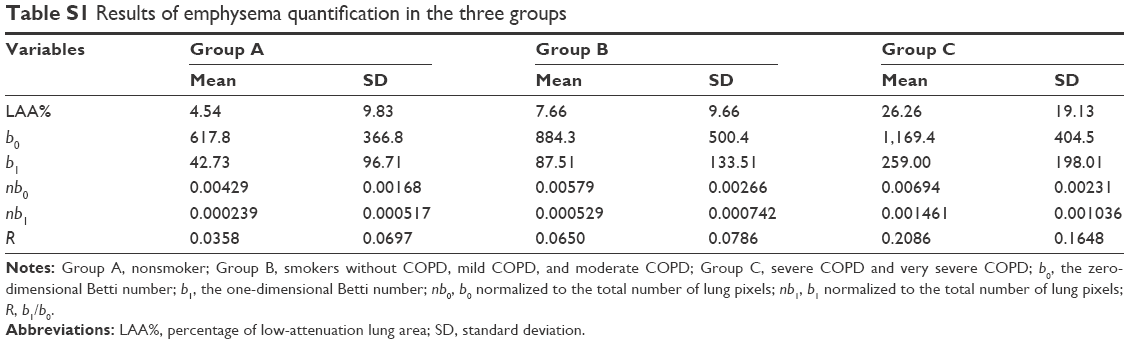 | Table S1 Results of emphysema quantification in the three groups |
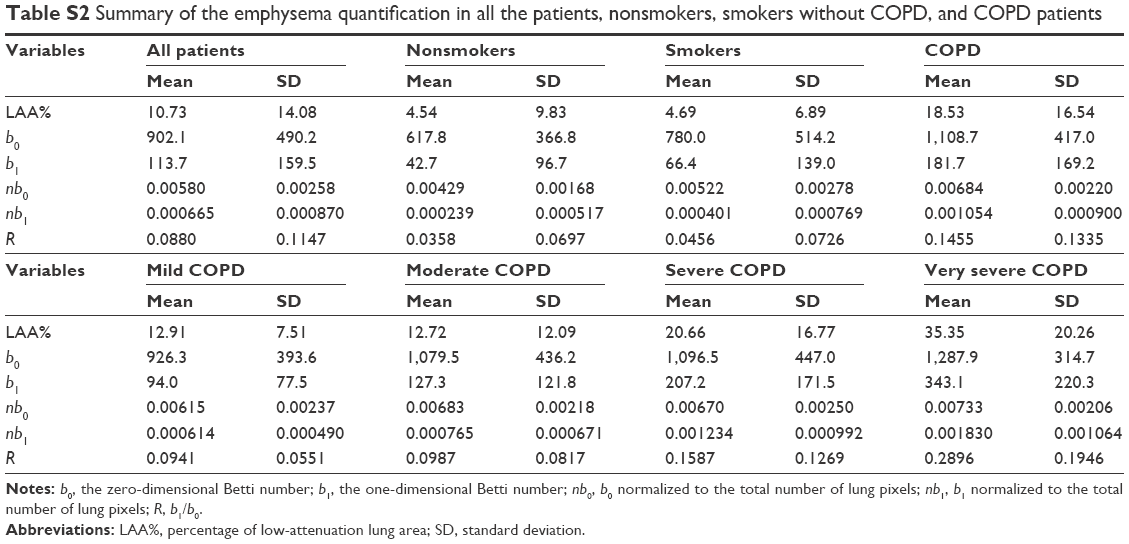 | Table S2 Summary of the emphysema quantification in all the patients, nonsmokers, smokers without COPD, and COPD patients |
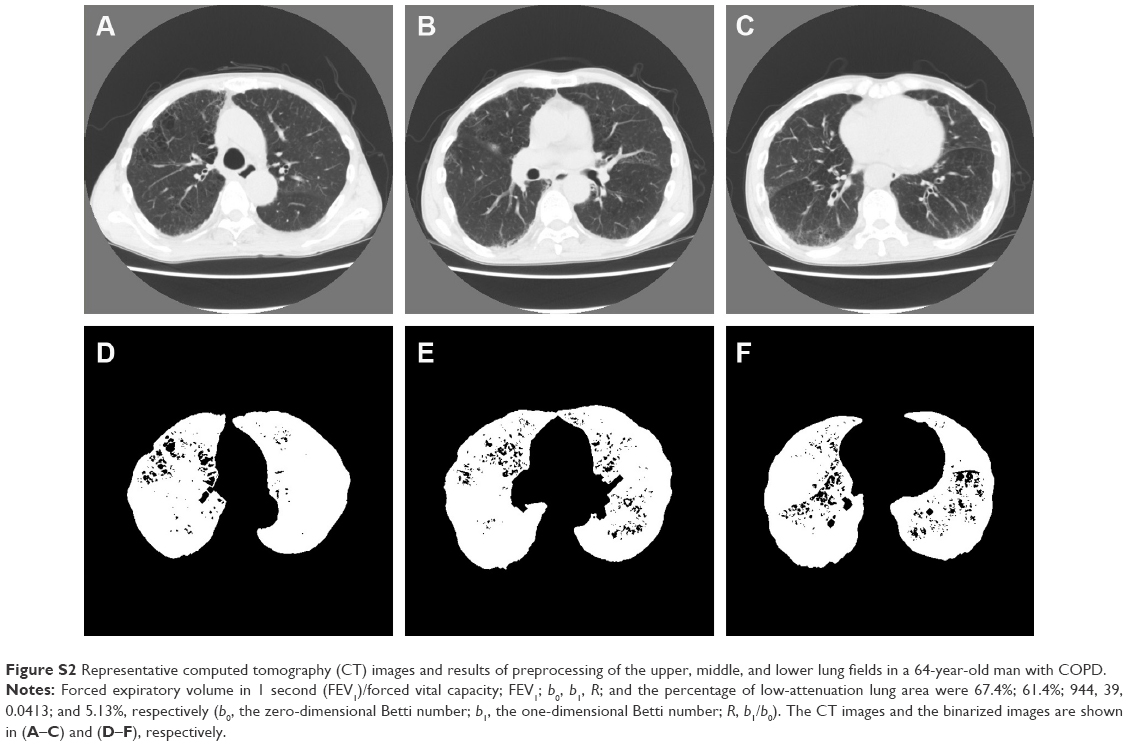 | Figure S2 Representative computed tomography (CT) images and results of preprocessing of the upper, middle, and lower lung fields in a 64-year-old man with COPD. |
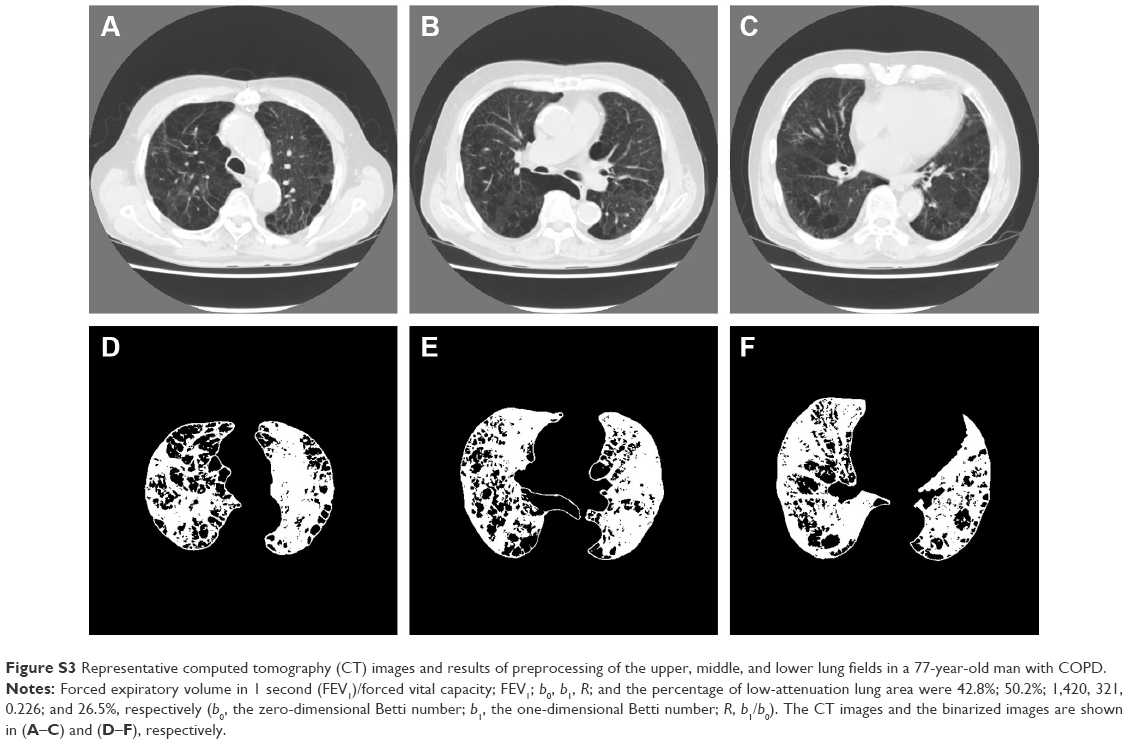 | Figure S3 Representative computed tomography (CT) images and results of preprocessing of the upper, middle, and lower lung fields in a 77-year-old man with COPD. |
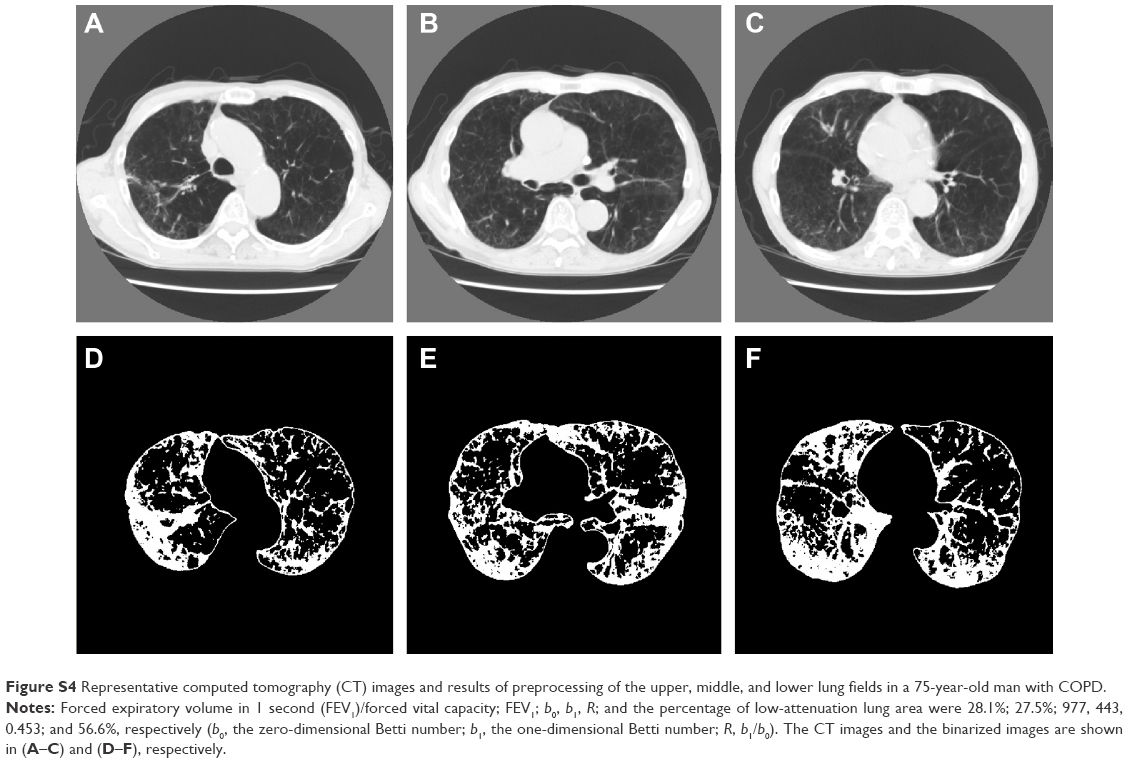 | Figure S4 Representative computed tomography (CT) images and results of preprocessing of the upper, middle, and lower lung fields in a 75-year-old man with COPD. |
 © 2016 The Author(s). This work is published and licensed by Dove Medical Press Limited. The
full terms of this license are available at https://www.dovepress.com/terms
and incorporate the Creative Commons Attribution
- Non Commercial (unported, 3.0) License.
By accessing the work you hereby accept the Terms. Non-commercial uses of the work are permitted
without any further permission from Dove Medical Press Limited, provided the work is properly
attributed. For permission for commercial use of this work, please see paragraphs 4.2 and 5 of our Terms.
© 2016 The Author(s). This work is published and licensed by Dove Medical Press Limited. The
full terms of this license are available at https://www.dovepress.com/terms
and incorporate the Creative Commons Attribution
- Non Commercial (unported, 3.0) License.
By accessing the work you hereby accept the Terms. Non-commercial uses of the work are permitted
without any further permission from Dove Medical Press Limited, provided the work is properly
attributed. For permission for commercial use of this work, please see paragraphs 4.2 and 5 of our Terms.