Back to Journals » Clinical Epidemiology » Volume 12
Application of the Adaptive Validation Substudy Design to Colorectal Cancer Recurrence
Authors Collin LJ ![]() , Riis AH, MacLehose RF, Ahern TP, Erichsen R
, Riis AH, MacLehose RF, Ahern TP, Erichsen R ![]() , Thorlacius-Ussing O, Lash TL
, Thorlacius-Ussing O, Lash TL ![]()
Received 9 September 2019
Accepted for publication 19 December 2019
Published 3 February 2020 Volume 2020:12 Pages 113—121
DOI https://doi.org/10.2147/CLEP.S230314
Checked for plagiarism Yes
Review by Single anonymous peer review
Peer reviewer comments 3
Editor who approved publication: Professor Irene Petersen
Lindsay J Collin,1,2 Anders H Riis,2 Richard F MacLehose,3 Thomas P Ahern,4 Rune Erichsen,2,5 Ole Thorlacius-Ussing,6 Timothy L Lash1
1Department of Epidemiology, Emory University, Atlanta, GA, USA; 2Department of Clinical Epidemiology, Aarhus University Hospital, Aarhus, Denmark; 3Division of Epidemiology and Community Health, University of Minnesota, Minneapolis, MN, USA; 4Department of Surgery, The Robert Larner, M.D. College of Medicine at the University of Vermont, Burlington, VT, USA; 5Department of Surgery, Randers Regional Hospital, Randers, Denmark; 6Department of Gastrointestinal Surgery, Aalborg University Hospital, Aalborg, Denmark
Correspondence: Lindsay J Collin
Department of Epidemiology, Emory University, 1518 Clifton RoadNE, Atlanta, GA 30322, USA
Tel +1 530-386-3341
Email [email protected]
Background: Among men and women diagnosed with colorectal cancer (CRC), 20– 50% will develop a cancer recurrence. Cancer recurrences are not routinely captured by most population-based registries; however, linkage across Danish registries allows for the development of predictive models to detect recurrence. Successful application of such models in population-based settings requires validation against a gold standard to ensure the accuracy of recurrence identification.
Objective: We apply a recently developed validation study design for prospectively collected validation data to validate predicted CRC recurrences against gold standard diagnoses from medical records in an actively followed cohort of CRC patients in Denmark.
Methods: We use a Bayesian monitoring framework, traditionally used in clinical trials, to iteratively update classification parameters (positive and negative predictive values, and sensitivity and specificity) in an adaptive validation substudy design. This design allows determination of the sample size necessary to estimate the corresponding parameters and to identify when validation efforts can cease based on predefined criteria for parameter values and levels of precision.
Results: Among 355 men and women diagnosed with CRC in Denmark and actively followed semi-annually, there were 63 recurrences diagnosed by active follow-up and 70 recurrences identified by a predictive algorithm. The adaptive validation design met stopping criteria for the classification parameters after 120 patients had their recurrence information validated. This stopping point yielded parameter estimates for the classification parameters similar to those obtained when the entire cohort was validated, with 66% less patients needed for the validation study.
Conclusion: In this proof of concept application of the adaptive validation study design for outcome misclassification, we demonstrated the ability of the method to accurately determine when sufficient validation data have been collected. This method serves as a novel validation substudy design for prospectively collected data with simultaneous implementation of a validation study.
Keywords: validation study design, colorectal cancer recurrence
Introduction
Colorectal cancer (CRC) is the third most commonly diagnosed malignancy and the third leading cause of cancer-related mortality among men and women globally.1 Improvements in diagnostic workup, including screening and in surgical techniques and medical treatments, have contributed to an increase in the survival rates for CRC patients.2,3 Current survival estimates are largely dependent on the stage at diagnosis, with estimated 5-year survival proportions of 90%, 70%, and 10% for stage I–II, stage III, and metastatic disease, respectively.4
A cancer recurrence is broadly defined as a return of the original cancer following an initial disease-free period.5,6 A cancer recurrence can happen locally (at or near the original site), regionally (in surrounding lymph nodes), or distally (at a distant anatomical site).7 Among individuals diagnosed with CRC, the 5-year risk of recurrence is between 20% and 50%, depending on stage and other tumor characteristics at diagnosis.7–11 Treatments for local or regional (stage I–III) disease include surgery alone or combinations of surgery, chemotherapy, and radiation therapy, with the intent of curing the patient of their disease.12 Following curative treatment and an apparent disease-free period, a recurrence is a necessary preceding condition before CRC-specific mortality. However, due to the lack of population-wide surveillance data on the rate of recurrence, CRC-specific mortality is the most often used outcome to measure population-wide progress in CRC treatment. The use of mortality as the primary surveillance endpoint may be suboptimal, as recurrent tumors are amenable to therapy, so not all patients who have a recurrence will die from it. Furthermore, focusing on mortality impedes the identification of factors related directly to recurrence. We have, for example, shown a different relation between use of statins and colorectal cancer recurrence versus colorectal cancer-specific mortality in the same cohort of early-stage colorectal cancer patients, suggesting that the two outcomes can yield different epidemiologic estimates of association.13 Direct study of recurrence is therefore often the preferable approach for clinical epidemiology studies of CRC outcomes.
Unfortunately, recurrence data are not routinely collected by most population-based registries, including the Danish registries. The Danish registry system does allow unambiguous linkage across registries,14 and these linkages facilitated the development of an algorithm to predict CRC recurrences using diagnostic and procedure codes across multiple registries.15 Development and use of such algorithms in epidemiologic research requires a validation substudy to compare quantitatively algorithm-defined recurrences with gold standard—clinically recorded—diagnoses. Validation substudies measure the accuracy of the algorithm’s classification of recurrences, and the validation parameters they produce can be used in quantitative bias analyses to bias-adjust the influence of measurement error on association estimates. However, methods for validation substudy design using prospectively collected data have not been fully developed. Historically, validation study design has received far less methodologic development than standard study designs, such as case-control or cohort studies. What limited research exists on validation studies often pertains to selecting sample sizes. Further, most previous guidance on designing validation substudies pertained to scenarios in which study enrolment and follow-up had been completed before the validation study has been implemented.16–18 In this proof of concept study, we apply a recently developed validation study design for prospectively collected validation data to validate CRC recurrences identified through an algorithm against gold standard diagnoses from medical records in an actively followed cohort of CRC patients in Denmark. We use the adaptive validation design to model when sufficient validation data would have been collected to meet a predefined stopping rule and estimate the classification parameters.
Materials and Methods
Study Population
We included Danish CRC patients who underwent surgery and were registered with the Danish Colorectal Cancer Group (DCCG) database.19 All patients had been enrolled at Aalborg Hospital into an observation cohort or into a randomized trial. The observation cohort consisted of consenting patients admitted between October 2003 and November 2005 for intended curative surgery.20 The COLOFOL randomized trial (clinicaltrials.gov identifier NCT00225641) enrolled in stage II and III patients from January 2006 to January 2011 and compared two follow-up regimens after surgical resection.21 Both cohorts received active biennial follow-up for colorectal cancer recurrence after completion of primary therapy, and this follow-up information was treated as the gold standard.
Analytic Variables
Recurrences: We defined CRC recurrences as tumor growth at or near the site of the original tumor and in the same organ, or metastases to tissue adjacent to the original tumor site, or metastases to a distant organ. The CRC recurrence prediction algorithm used four independent data sources.15 Briefly, recurrences based on the algorithm were defined as the presence of at least one of the following:
- Danish National Patient Registry (DNPR)-registered or Danish Cancer Registry (DCR)-registered metastasis codes (ICD10 DC76–DC80), 180 days or more after first colorectal cancer surgery.22,23
- DNPR-registered cytostatic therapy codes, 180 days or more after first colorectal cancer surgery.
- Danish Pathology Registry SNOMED code combinations recorded 180 days or more after first colorectal cancer surgery, and without a new primary cancer diagnosis registered in DNPR or DCR.24
- A code specific for local or regional colorectal cancer recurrence in the DNPR any time after primary diagnosis.
This algorithm was previously applied to a cohort of all Danish colorectal cancer patients to understand the population-wide descriptive epidemiology of colorectal cancer recurrence.7
Statistical Analysis
We used the actively followed CRC cohort’s recurrence diagnoses as the gold standard and performed two sets of validation studies to estimate positive and negative predictive values (PPV and NPV, respectively), and sensitivity and specificity classification parameters. Conditioning on the algorithm’s classification of recurrence status allowed calculation of the PPV and NPV. Conversely, conditioning on gold standard recurrence status allowed calculation of the sensitivity and specificity of recurrence classification. For each of the two validation sets, we used the framework of Bayesian monitoring methods to identify when a sufficient sample size had been obtained to meet a prespecified threshold value and level of precision for these four classification parameters.25 Bayesian monitoring techniques have been used in clinical trials to estimate treatment efficacy while trial data accumulate, and to optimize randomization allocation schemes as data accrue. We extended this framework to prospectively collected validation data to optimize use of study resources when estimating classification parameters. Our main goal in this analysis was to model when sufficient validation data would have been collected to establish the validity of the algorithm, or, conversely, to determine whether to view the algorithm as untenable for use in classifying CRC recurrence. Although the data from the actively followed CRC cohort were already complete, we simulated the two validation scenarios as if the data were being collected prospectively. To estimate the PPV and NPV, validation study members were ordered chronologically by the date of their algorithm-ascertained CRC recurrence. Similarly, to estimate the sensitivity and specificity, validation study members were ordered chronologically by the date of their CRC recurrence recorded from active follow-up. This ordering allowed for the selection of participants and calculation of classification parameters as if validation data were accruing simultaneously with other cohort data over follow-up.
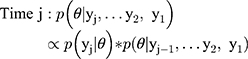
Once cohort members were chronologically ordered, we used an iterative beta-binomial Bayesian model, which updates the PPV/NPV or sensitivity/specificity, which we designate θ, over regular follow-up intervals. Each classification parameter is a proportion, so can be modelled with a beta prior distribution and binomial likelihood. We began by assigning a noninformative beta prior for each parameter,  , where
  is the validation parameter of interest. We update this distribution iteratively with the likelihood contributed by new validation data (yj) to calculate a new posterior distribution for each parameter for each sample:


Each time interval represents the updated classification parameter after new validation data have been added to the prior validation data collected, and this iterative process can be continued until stopping criteria have been met or until data collection is complete. To establish intervals after which to update estimates, we evaluated the design under two scenarios. First, once five algorithm-ascertained recurrences had accumulated over the follow-up period, we selected those five individuals and also, at random and without replacement, we sampled five individuals without algorithm-ascertained recurrences from the set of cohort participants without an algorithm-ascertained recurrence by that point in the study’s follow-up (i.e., a 10-person validation set at each time interval). These were used to estimate the PPVs and NPVs, updating the estimate from the preceding time interval. This updating was done iteratively over the complete study period. We used identification of five recurrences to trigger the computation because recurrences were (and were expected to be) much less common than lack of recurrence, so the latter were always relatively abundant. Second, we repeated the analysis using 10 recurrences instead of five to trigger the computation (ie, a 20-person validation set at each time interval). Use of five or ten recurrences to trigger computation was meant to simulate the accrual of sufficient sample (10 or 20) to justify sending a medical record abstractor to a site to complete the validation. In the second validation set, we repeated these two scenarios using the recurrences recorded from the actively followed cohort, which allowed for estimation of sensitivity and specificity.
In each validation substudy, we assumed that sufficient validation data had been collected once the classification parameters met 1) a predefined threshold and 2) a corresponding level of precision. When estimating the PPV and NPV, we assumed that the validation sample was sufficiently large if the lower credible bound (2.5th percentile) of both the PPV and NPV exceeded 0.80. We likewise assumed that validation was futile if the upper credible bound (97.5th percentile) was less than 0.80. The choice of 0.80 as the threshold was informed by the content. Assuming that the algorithm would be considered valid if the point estimate for PPV and NPV were near 0.90, then the lower bound for the CI would need to reach at least 0.80. For the precision criterion for PPV and NPV, we assumed that validation efforts would cease if the credible interval width—defined as the absolute difference between the upper and lower CI—was less than 0.15. In our estimation of sensitivity and specificity, we used results from the Danish population-wide cohort study to inform an allowable false-positive rate.7 In this population-based study, the observed 5-year risk of recurrence, using recurrences identified from the algorithm, was approximately 25%. If we assumed that the true risk of recurrence has a lower bound of 20% (informed by content), this limits the false-positive rate to 0.10, leading to the cut-off of ≥0.90 for the 2.5th percentile of the lower credible bound for both the sensitivity and specificity classification parameters as an indicator that validation had been optimized. For the precision criterion, we assumed that validation efforts could cease if the credible interval width was less than 0.08.
Results
The combined CRC cohort and clinical trial cohorts used for this analysis included 355 CRC patients, of whom 63 (18%) had a recurrence detected by gold-standard active follow-up. According to the predictive algorithm we are validating, there were 70 (20%) recurrences over the course of follow-up. In the complete validation data,15 the PPV and NPV at the end of the study period were 0.86 (95% CI 0.75, 0.93) and 0.99 (95% CI 0.97, 1.00), respectively (Table 1). The sensitivity and specificity of classification of recurrence at the end of follow-up were 0.95 (95% CI 0.87, 0.99) and 0.97 (95% CI 0.94, 0.98), respectively (Table 1).
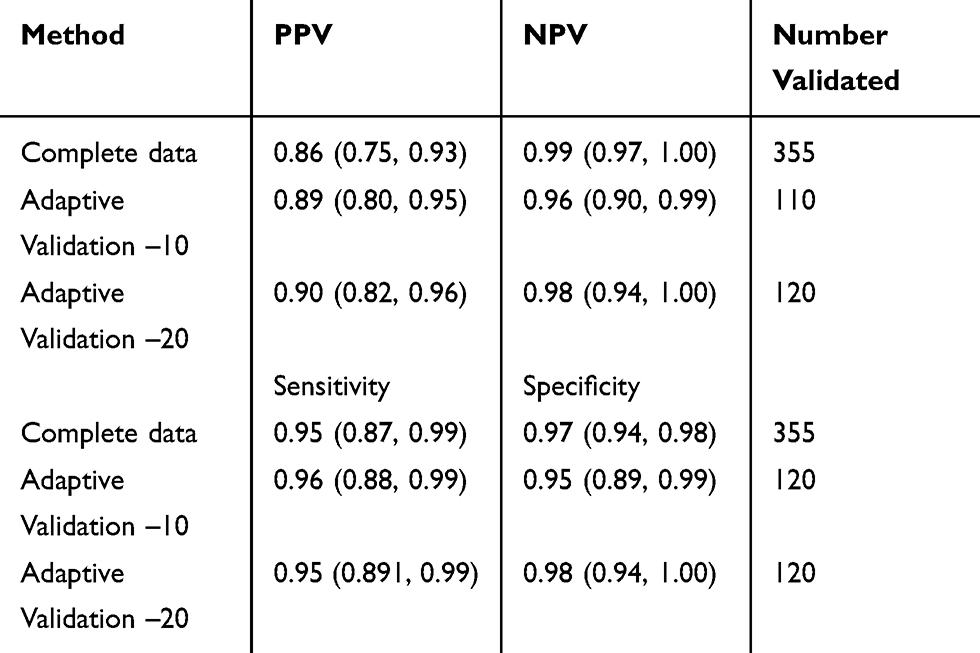 |
Table 1 Estimates of PPV, NPV, Sensitivity and Specificity Classification Parameters for Possible Outcome Misclassification of CRC Recurrence from the Adaptive Validation Substudy Design |
PPV and NPV Classification Parameters
When recurrences were identified by the algorithm, the adaptive validation design identified when sufficient information had been collected to cease validation efforts (Table 1 and Figure 1). When 10 individuals were included in the validation set at each time interval, the adaptive validation approach reached the stopping rule for threshold and for precision after validation data from 110 individuals had been collected. The final estimated PPV and NPV classification parameters were 0.89 (95% CI 0.80, 0.95) and 0.96 (95% CI 0.90, 0.99) respectively, which are good approximations to the values obtained from the complete data (Table 1). When 20 individuals were included in the validation at each time interval, the adaptive validation approach identified that the stopping criteria had been reached after validation information from 120 persons had been collected. The final estimated PPV and NPV classification parameters were 0.90 (95% CI 0.82, 0.96) and 0.98 (95% CI 0.94, 1.00), respectively, which are again good approximations to the values obtained from the complete data (Table 1). In general, estimates were more precise when 20 individuals were sampled at each update step.
Sensitivity and Specificity Classification Parameters
Similar to the PPV and NPV validation, the adaptive validation method identified when sufficient validation efforts had been expended, although this did not reach the desired stopping criteria when 10 individuals were included in the validation set at each time interval. When 10 individuals were included in the validation set at each time interval, the estimates of sensitivity and specificity were closest to the criteria for stopping once 120 individuals had their recurrence information validated. The sensitivity and specificity estimates were 0.95 (95% CI 0.89, 0.99) and 0.95 (95% CI 0.89, 0.99), respectively (Figure 2), which are good approximations to the values obtained from the complete data. When 20 individuals were included in the validation set at each time interval, the estimates of sensitivity and specificity met the criteria for stopping once 120 individuals were included, with improved precision over the 10-person validation approach. The sensitivity and specificity estimates were 0.95 (95% CI 0.89, 1.00) and 0.98 (95% CI 0.94, 1.00), respectively (Figure 2), which are again good approximations to the values obtained from the complete data.
Discussion
In this proof of concept validation study, we illustrate that the adaptive validation approach readily optimized the estimates of classification parameters for the ascertainment of CRC recurrences by a predictive algorithm. This evaluation was carried out for the PPV, NPV, sensitivity, and specificity—all of which showed that validation information from only ~120 individuals was needed to meet the predefined threshold and precision criteria of the estimates of the parameters of interest. As the original development of the algorithm used the actively followed cohort (n=355) as a validation substudy, we knew the overall classification parameters, allowing comparison of the parameters estimated using the adaptive design to the underlying parameters when the entire cohort’s complete data had been validated. These results suggest that 235 of the 355 cohort members (66%) added only marginal value to the validation study results. Were these 235 validated by a resource-intensive strategy, such as medical record review, use of an adaptive validation design would have saved considerable research resources.
As interest expands in cancer recurrences as an endpoint for cancer survivorship studies, population-based registries without standardized collection of recurrence information may apply similar algorithms with multiple data streams to identify recurrences.26,27 Such an undertaking requires extensive and often expensive validation, and monitoring of the validation results as well the expenses allocated to them. Previous methods to design validation studies, such as the simple random sample or balanced design, require completed data collection before implementation.17 The adaptive validation design allows thoughtful consideration of which validation data will be most informative for the study as follow-up data accrue. Through iterative updating of estimates of bias parameters, researchers can ensure a purposeful design of internal validation substudies, stopping validation data collection when additional information will add only marginal value or when additional information is likely to be futile. This approach may save researchers valuable resources that can be redirected to additional data collection without sacrificing the quality of the validation data collected. For prospectively collected data, this design allows the simultaneous implementation of the validation with the collection of the cohort’s data instead of the traditional study designs that require waiting until all data have been collected before beginning validation.
This study is not without limitations. We used data that had already been collected and validated, then simulated the validation studies as if they were happening in real time, so estimates of the classification parameters from the complete data were known. The advantage was that use of a complete validation study allowed a comparison of estimates obtained when the stopping rule was met with estimates in the complete data. However, our choice of stopping point was inevitably informed by knowledge of the results from the complete data, which would not be available when undertaking a truly prospective design. In that case, the stopping rule would have to be informed by another strategy or by content-specific knowledge, possibly from similar validation studies in external populations or desired endpoints. Additionally, validation data were only available from two actively followed patient populations at one hospital site in Denmark, which may have led to bias in the classification parameters if there are regional differences in clinical practice. Furthermore, we did not base our stopping rule on an estimate of an exposure-outcome association of interest, which would have changed our sampling strategy by requiring sampling and estimation of at least the predictive values within categories of the exposure. An interesting finding was that the majority of the misclassified individuals occurred in the last time period of the study’s follow-up, which may suggest that the actively followed cohort lost patients to follow-up before a recurrence could be documented, and that the accuracy of the algorithm was better than previously reported (Supplemental Figures 1 and 2).13 The previous validation compared the cumulation of recurrences in the actively followed cohort using the complete data at the end without insight into the trend in classification over time. Our results indicate that the trend over time may be an important consideration, which was only apparent when we evaluated the time-dependence of the estimates of the classification parameters.
Conclusions
In this proof of concept application of the adaptive validation study design for outcome misclassification, we demonstrated the ability of the method to accurately determine when sufficient validation data have been collected. This method serves as a novel validation substudy design for prospectively collected data with simultaneous implementation of a validation study.
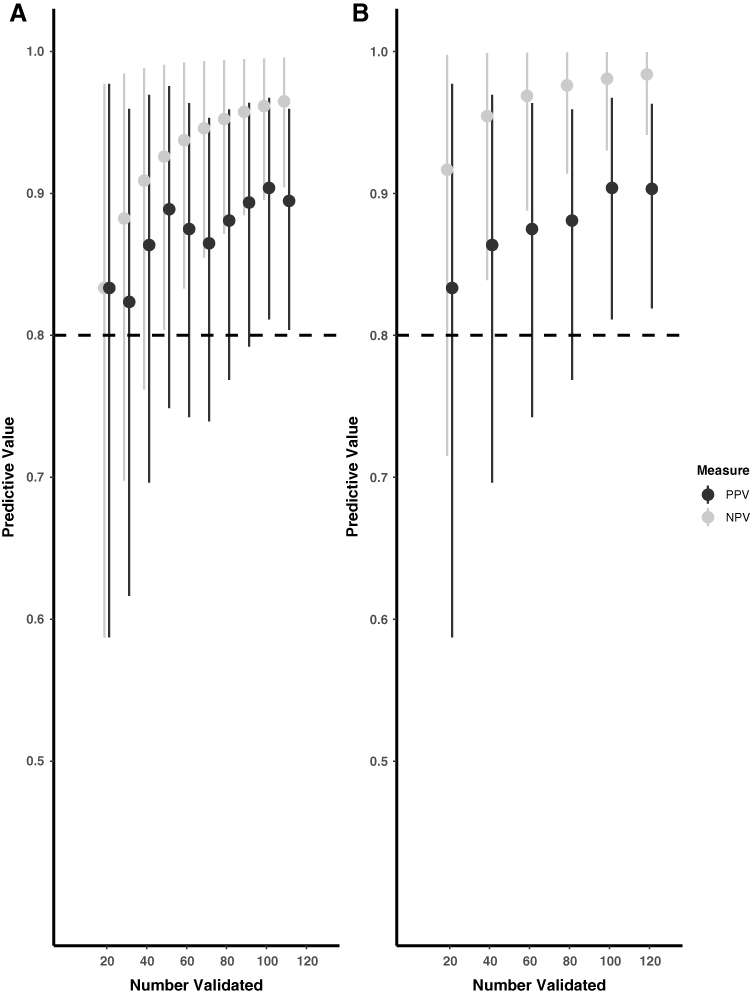 |
Figure 1 Adaptive validation using (A) 10-person and (B) 20-person validation at a time among CRC recurrences identified through the algorithm to estimate the positive and negative predictive values. |
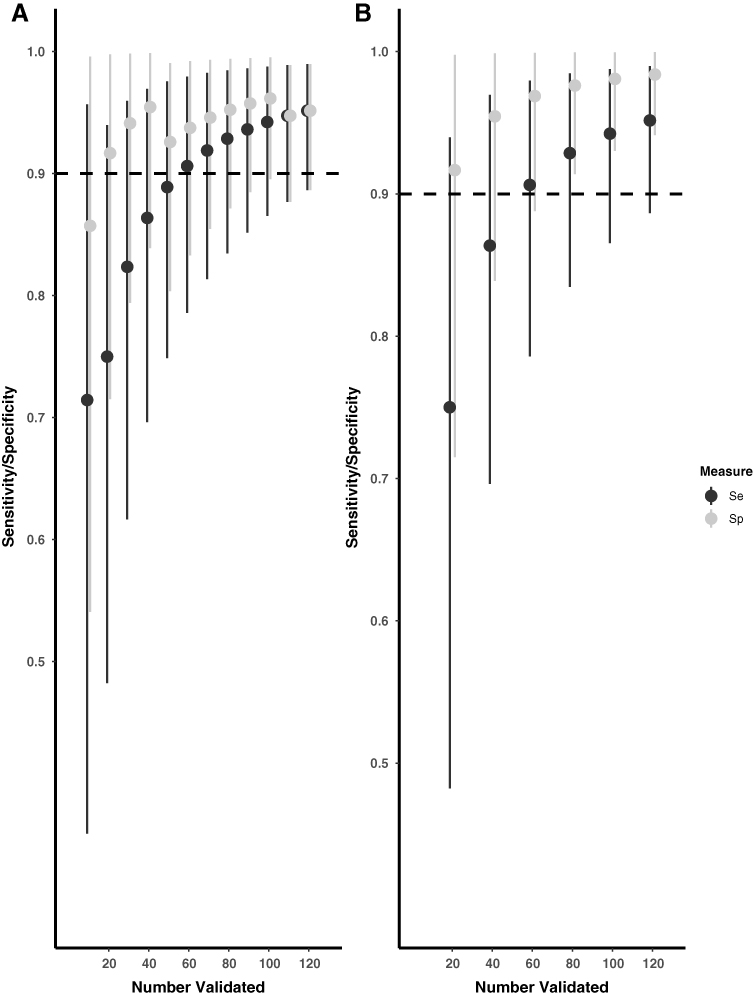 |
Figure 2 Adaptive validation using (A) 10-person and (B) 20-person validation at a time among CRC recurrences identified in the actively followed cohort to estimate the sensitivity and specificity. |
Abbreviations
CRC, colorectal cancer; PPV, positive predictive value; NPV, negative predictive value; DCR, Danish Cancer Registry; DNPR, Danish National Patient Registry.
Ethics Approval and Informed Consent
The study protocol was approved by the Danish Data Protection Agency (record number 2011‐41‐6968) and the North Denmark Region Committee on Health Research Ethics’ (record number N‐20130027). All participants provided written informed consent for participation in both parent studies. Additional informed consent was not required for this study as it was reliant on registry data and a secondary analysis of collected data. The study was carried out in accordance with the principles of the Declaration of Helsinki.
Data Sharing Statement
Data are available through processes established by Danish law. Example code used to perform the adaptive validation studies is available from GitHub (https://github.com/lcolli5/Adaptive-Validation).
Disclosure
The authors report no conflicts of interest in this work.
References
1. Bray F, Ferlay J, Soerjomataram I, Siegel RL, Torre LA, Jemal A. Global cancer statistics 2018: GLOBOCAN estimates of incidence and mortality worldwide for 36 cancers in 185 countries. CA Cancer J Clin. 2018;68(6):394–424. doi:10.3322/caac.21492
2. Zauber AG. The impact of screening on colorectal cancer mortality and incidence: has it really made a difference? Dig Dis Sci. 2015;60(3):681–691. doi:10.1007/s10620-015-3600-5
3. Welch HG, Robertson DJ. Colorectal cancer on the decline–why screening can’t explain it all. N Engl J Med. 2016;374(17):1605–1607. doi:10.1056/NEJMp1600448
4. Siegel RL, Miller KD, Fedewa SA, et al. Colorectal cancer statistics, 2017. CA Cancer J Clin. 2017;67(3):177–193. doi:10.3322/caac.21395
5. Rex DK, Kahi CJ, Levin B, et al. Guidelines for colonoscopy surveillance after cancer resection: a consensus update by the American Cancer Society and US multi-society task force on colorectal cancer. CA Cancer J Clin. 2006;56(3):
6. Abulafi AM, Williams NS. Local recurrence of colorectal cancer: the problem, mechanisms, management and adjuvant therapy. Br J Surg. 1994;81(1):7–19. doi:10.1002/(ISSN)1365-2168
7. Holmes AC, Riis AH, Erichsen R, et al. Descriptive characteristics of colon and rectal cancer recurrence in a Danish population-based study. Acta Oncol. 2017;56(8):1111–1119. doi:10.1080/0284186X.2017.1304650
8. Yoshii S, Nojima M, Nosho K, et al. Factors associated with risk for colorectal cancer recurrence after endoscopic resection of T1 tumors. Clin Gastroenterol Hepatol. 2014;12(2):292–302.e293. doi:10.1016/j.cgh.2013.08.008
9. Primrose JN, Perera R, Gray A, et al. Effect of 3 to 5 years of scheduled CEA and CT follow-up to detect recurrence of colorectal cancer: the FACS randomized clinical trial. JAMA. 2014;311(3):263–270. doi:10.1001/jama.2013.285718
10. Walker AS, Johnson EK, Maykel JA, et al. Future directions for the early detection of colorectal cancer recurrence. J Cancer. 2014;5(4):272–280. doi:10.7150/jca.8871
11. Wille-Jorgensen P, Syk I, Smedh K, et al. Effect of more vs less frequent follow-up testing on overall and colorectal cancer-specific mortality in patients with stage II or III colorectal cancer: the COLOFOL randomized clinical trial. JAMA. 2018;319(20):2095–2103. doi:10.1001/jama.2018.5623
12. Punt CJ, Koopman M, Vermeulen L. From tumour heterogeneity to advances in precision treatment of colorectal cancer. Nat Rev Clin Oncol. 2017;14(4):235–246. doi:10.1038/nrclinonc.2016.171
13. Lash TL, Riis AH, Ostenfeld EB, et al. Associations of statin use with colorectal cancer recurrence and mortality in a Danish cohort. Am J Epidemiol. 2017;186(6):679–687. doi:10.1093/aje/kww245
14. Schmidt M, Schmidt SAJ, Adelborg K, et al. The Danish health care system and epidemiological research: from health care contacts to database records. Clin Epidemiol. 2019;11:563–591. doi:10.2147/CLEP.S179083
15. Lash TL, Riis AH, Ostenfeld EB, Erichsen R, Vyberg M, Thorlacius-Ussing O. A validated algorithm to ascertain colorectal cancer recurrence using registry resources in Denmark. Int J Cancer. 2015;136(9):2210–2215. doi:10.1002/ijc.v136.9
16. Spiegelman D, Rosner B, Logan R. Estimation and inference for logistic regression with covariate misclassification and measurement error in main study/validation study designs. J Am Stat Assoc. 2000;95(449):51–61.
17. Holcroft CA, Spiegelman D. Design of validation studies for estimating the odds ratio of exposure-disease relationships when exposure is misclassified. Biometrics. 1999;55(4):1193–1201. doi:10.1111/j.0006-341X.1999.01193.x
18. Holford TR, Stack C. Study design for epidemiologic studies with measurement error. Stat Methods Med Res. 1995;4(4):339–358. doi:10.1177/096228029500400405
19. Ingeholm P, Gogenur I, Iversen LH. Danish colorectal cancer group database. Clin Epidemiol. 2016;8:465–468. doi:10.2147/CLEP.S99481
20. Stender MT, Frokjaer JB, Larsen TB, Lundbye-Christensen S, Thorlacius-Ussing O. Preoperative plasma D-dimer is a predictor of postoperative deep venous thrombosis in colorectal cancer patients: a clinical, prospective cohort study with one-year follow-up. Dis Colon Rectum. 2009;52(3):446–451. doi:10.1007/DCR.0b013e318197e2b2
21. Hansdotter Andersson P, Wille-Jorgensen P, Horvath-Puho E, et al. The COLOFOL trial: study design and comparison of the study population with the source cancer population. Clin Epidemiol. 2016;8:15–21. doi:10.2147/CLEP.S92661
22. Gjerstorff ML. The Danish cancer registry. Scand J Public Health. 2011;39(7 Suppl):42–45. doi:10.1177/1403494810393562
23. Schmidt M, Schmidt SA, Sandegaard JL, Ehrenstein V, Pedersen L, Sorensen HT. The Danish National Patient Registry: a review of content, data quality, and research potential. Clin Epidemiol. 2015;7:449–490. doi:10.2147/CLEP.S91125
24. Erichsen R, Lash TL, Hamilton-Dutoit SJ, Bjerregaard B, Vyberg M, Pedersen L. Existing data sources for clinical epidemiology: the Danish National Pathology Registry and Data Bank. Clin Epidemiol. 2010;2:51–56. doi:10.2147/CLEP.S9908
25. Fayers PM, Ashby D, Parmar MK. Tutorial in biostatistics Bayesian data monitoring in clinical trials. Stat Med. 1997;16(12):1413–1430. doi:10.1002/(SICI)1097-0258(19970630)16:12<1413::AID-SIM578>3.0.CO;2-U
26. Hassett MJ, Ritzwoller DP, Taback N, et al. Validating billing/encounter codes as indicators of lung, colorectal, breast, and prostate cancer recurrence using 2 large contemporary cohorts. Med Care. 2014;52(10):e65–73. doi:10.1097/MLR.0b013e318277eb6f
27. McClish D, Penberthy L, Pugh A. Using Medicare claims to identify second primary cancers and recurrences in order to supplement a cancer registry. J Clin Epidemiol. 2003;56(8):760–767. doi:10.1016/S0895-4356(03)00091-X
 © 2020 The Author(s). This work is published and licensed by Dove Medical Press Limited. The
full terms of this license are available at https://www.dovepress.com/terms
and incorporate the Creative Commons Attribution
- Non Commercial (unported, 3.0) License.
By accessing the work you hereby accept the Terms. Non-commercial uses of the work are permitted
without any further permission from Dove Medical Press Limited, provided the work is properly
attributed. For permission for commercial use of this work, please see paragraphs 4.2 and 5 of our Terms.
© 2020 The Author(s). This work is published and licensed by Dove Medical Press Limited. The
full terms of this license are available at https://www.dovepress.com/terms
and incorporate the Creative Commons Attribution
- Non Commercial (unported, 3.0) License.
By accessing the work you hereby accept the Terms. Non-commercial uses of the work are permitted
without any further permission from Dove Medical Press Limited, provided the work is properly
attributed. For permission for commercial use of this work, please see paragraphs 4.2 and 5 of our Terms.