Back to Journals » Drug Design, Development and Therapy » Volume 10
Application of physiologically based pharmacokinetic modeling in predicting drug–drug interactions for sarpogrelate hydrochloride in humans
Authors Min JS, Kim D, Park JB, Heo H, Bae SH, Seo JH, Oh E, Bae SK ![]()
Received 28 March 2016
Accepted for publication 11 May 2016
Published 14 September 2016 Volume 2016:10 Pages 2959—2972
DOI https://doi.org/10.2147/DDDT.S109141
Checked for plagiarism Yes
Review by Single anonymous peer review
Peer reviewer comments 4
Editor who approved publication: Prof. Dr. Wei Duan
Jee Sun Min,1 Doyun Kim,1 Jung Bae Park,1 Hyunjin Heo,1 Soo Hyeon Bae,2 Jae Hong Seo,1 Euichaul Oh,1 Soo Kyung Bae1
1Integrated Research Institute of Pharmaceutical Sciences, College of Pharmacy, The Catholic University of Korea, Bucheon, 2Department of Pharmacology, College of Medicine, The Catholic University of Korea, Seocho-gu, Seoul, South Korea
Background: Evaluating the potential risk of metabolic drug–drug interactions (DDIs) is clinically important.
Objective: To develop a physiologically based pharmacokinetic (PBPK) model for sarpogrelate hydrochloride and its active metabolite, (R,S)-1-{2-[2-(3-methoxyphenyl)ethyl]-phenoxy}-3-(dimethylamino)-2-propanol (M-1), in order to predict DDIs between sarpogrelate and the clinically relevant cytochrome P450 (CYP) 2D6 substrates, metoprolol, desipramine, dextromethorphan, imipramine, and tolterodine.
Methods: The PBPK model was developed, incorporating the physicochemical and pharmacokinetic properties of sarpogrelate hydrochloride, and M-1 based on the findings from in vitro and in vivo studies. Subsequently, the model was verified by comparing the predicted concentration-time profiles and pharmacokinetic parameters of sarpogrelate and M-1 to the observed clinical data. Finally, the verified model was used to simulate clinical DDIs between sarpogrelate hydrochloride and sensitive CYP2D6 substrates. The predictive performance of the model was assessed by comparing predicted results to observed data after coadministering sarpogrelate hydrochloride and metoprolol.
Results: The developed PBPK model accurately predicted sarpogrelate and M-1 plasma concentration profiles after single or multiple doses of sarpogrelate hydrochloride. The simulated ratios of area under the curve and maximum plasma concentration of metoprolol in the presence of sarpogrelate hydrochloride to baseline were in good agreement with the observed ratios. The predicted fold-increases in the area under the curve ratios of metoprolol, desipramine, imipramine, dextromethorphan, and tolterodine following single and multiple sarpogrelate hydrochloride oral doses were within the range of ≥1.25, but <2-fold, indicating that sarpogrelate hydrochloride is a weak inhibitor of CYP2D6 in vivo. Collectively, the predicted low DDIs suggest that sarpogrelate hydrochloride has limited potential for causing significant DDIs associated with CYP2D6 inhibition.
Conclusion: This study demonstrated the feasibility of applying the PBPK approach to predicting the DDI potential between sarpogrelate hydrochloride and drugs metabolized by CYP2D6. Therefore, it would be beneficial in designing and optimizing clinical DDI studies using sarpogrelate as an in vivo CYP2D6 inhibitor.
Keywords: sarpogrelate hydrochloride, M-1, CYP2D6 inhibition, PBPK modeling
Introduction
The physiologically based pharmacokinetics (PBPK) modeling and simulation approach is a very useful mechanistic tool for quantitatively predicting complicated drug–drug interactions (DDIs). They provide numerous advantages over static models. PBPK models dynamically incorporate both drug-specific properties and system-specific factors. The interindividual variability of the physiological and anatomical parameters can be integrated to account for the differences in population subgroups related to age, sex, ethnicity, and disease impact. Recently, PBPK models have been increasingly used in pharmaceutical research and drug development, and have gained acceptance in regulatory decision-making processes.1–6 Software products for the PBPK models that have been customized to date are Simcyp® Simulator version 15 (Certara L.P., Princeton, NJ, USA), GastroPlus® (Simulations Plus, Lancaster, CA, USA), and PK-Sim® (Bayer Technology Services, Leverkusen, Germany).
Sarpogrelate hydrochloride, (R,S)-1-{2-[2-(3-methoxyphenyl)ethyl]-phenoxy}-3-(dimethylamino)-2-propyl hydrogen succinate hydrochloride, is a highly selective serotonin (5-hydroxytryptamine, 5-HT2A) receptor antagonist, which has been used for many years to treat peripheral artery disease in Japan, the People’s Republic of China, and South Korea.7,8 Sarpogrelate inhibits serotonin-mediated reactions such as platelet aggregation9 and vasoconstriction10 as well as thrombus formation.11 Additionally, it has beneficial effects against restenosis and thrombosis after coronary stenting,12,13 recurrence in patients with recent ischemic stroke,14 and diabetes mellitus.15 Sarpogrelate is metabolized to (R,S)-1-{2-[2-(3-methoxyphenyl)ethyl]-phenoxy}-3-(dimethylamino)-2-propanol (M-1) following hydrolysis by esterases.12,16 M-1, an active metabolite of sarpogrelate, possesses more potent in vitro inhibitory effects than the parent sarpogrelate does, although the plasma concentration of M-1 is less than one-tenth of that of sarpogrelate.16
Recently, it was reported that sarpogrelate and its active metabolite, M-1, competitively inhibited cytochrome P450 (CYP) 2D6 with Ki values of 1.24 and 0.12 μM, respectively, in vitro.17 To predict the risk of a clinical DDI, static models of reversible inhibition were used. In accordance with the US Food and Drug Administration (FDA)18 and European Medicines Agency (EMA)19 guidelines on the investigation of drug interactions, [I]/Ki and [I]u/Ki values were calculated to relate in vitro to in vivo risk, where [I] and [I]u are the total (unbound and bound) and unbound maximum plasma concentration (Cmax) at the highest recommended dose, respectively, and Ki is the unbound reversible inhibition constant determined in vitro. The highest mean Cmax of sarpogrelate observed in clinical trials was 1.7 μM after a single 100 mg dose of sarpogrelate hydrochloride.20–24 The reported plasma protein binding of sarpogrelate was approximately 95%17 and the predicted nonspecific binding to microsomes was 3.1% (Table 1). Using the FDA guidance equation, the resulting R value (1+ [I]/Ki) was 2.45 for CYP2D6. Using the similar EMA equation, with [I]u value taking into consideration the unbound fraction, the [I]u/Ki value was 0.07. A clinical interaction study with sensitive probe substrates is recommended if the R value is >1.1, using FDA static model, or if the ratio of [I]u/Ki is ≥0.02 using the EMA static model. In both instances, the clinical DDI potential associated with CYP2D6 inhibition could not be excluded for sarpogrelate hydrochloride, and clinical studies were warranted. It was reported that the area under the curve at time t (AUCt) and Cmax of metoprolol, a CYP2D6 substrate, were increased by 1.53- and 1.62-fold (multiple, 1.51- and 1.67-fold), respectively, after single or multiple coadministration with sarpogrelate hydrochloride 100 mg.25
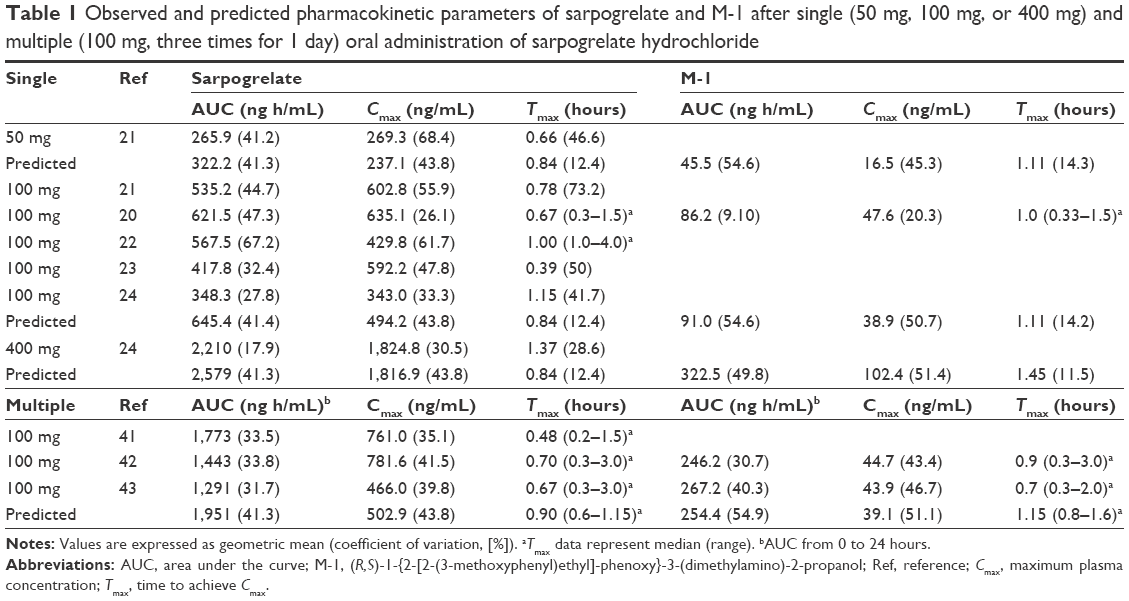 | Table 1 Observed and predicted pharmacokinetic parameters of sarpogrelate and M-1 after single (50 mg, 100 mg, or 400 mg) and multiple (100 mg, three times for 1 day) oral administration of sarpogrelate hydrochloride |
In the static model, the inhibitor concentration is assumed to be maintained at Cmax over the time course; however, that is not what happens in the human body.26,27 Therefore, the static model often overestimates the DDI potential of a perpetrator drug. In contrast, the PBPK model used the actual concentration-time profiles of both the inhibitor and substrate drugs to assess real-time interactions between them. An inhibitor and substrate with a high and low clearance rate, respectively, would exhibit a short duration of inhibition even if the enzyme activity was completely inhibited at its Cmax. Therefore, the overall effect on the metabolism of the substrate would be low. On the other hand, the coadministration of a long duration inhibitor and a substrate with a high clearance rate would likely exhibit a persistent inhibition. Thus, in PBPK modeling, the concentration-time profiles of both the inhibitor and substrate drugs including the metabolites, the inhibition potency of the inhibitor, and the percentage metabolism of the substrate by the corresponding enzyme(s) are all considered.18,19,26
Therefore, the three main aims of this study were: 1) to build a PBPK model for sarpogrelate hydrochloride and M-1 by incorporating existing in vitro and in vivo pharmacokinetic data in the literature; 2) to verify the performance of the PBPK model in predicting the clinical pharmacokinetic profiles of sarpogrelate and M-1 after oral single and multiple doses, by using previously reported clinical data sets that had not been used in the model; 3) to use this model to simulate the DDIs of sarpogrelate with the FDA-recommended in vivo substrates for studying CYP2D6 inhibition, metoprolol, desipramine, dextromethorphan, imipramine, and tolterodine.18,28 Moreover, several studies have reported that imipramine and desipramine are P-glycoprotein (P-gp) substrates, although they were mainly performed in vitro.29,30 To accurately predict the DDIs of CYP2D6-targeted drugs, especially imipramine and desipramine, with sarpogrelate, we performed in vitro bidirectional transport assays using Madin-Darby canine kidney (MDCK-II) cells stably expressing human P-gp or breast cancer resistance protein (BCRP).
The PBPK models of metoprolol, desipramine, dextromethorphan, imipramine, and tolterodine were used as obtained in the compound files included in the Simcyp® software (version 15). In addition, the predicted results of the interaction between metoprolol and sarpogrelate were compared with our previously observed clinical data.25
Materials and methods
Ethics
The MDCK-II cells and human liver microsomes studies were performed in accordance with the Declaration of Helsinki and designated exempt from review by the Catholic University of Korea Institutional Review Board.
Materials
The MDCK-II cells stably expressing human P-gp (MDCK-II-P-gp) or BCRP (MDCK-II-BCRP) were kindly provided by Drs Alfred H. Schinkel and Piet Borst (The Netherlands Cancer Institute, Amsterdam, the Netherlands). Cyclosporine A, loperamide, Ko143, prazosin, β-nicotinamide adenine dinucleotide phosphate (NADP+), glucose 6-phosphate, glucose 6-phosphate dehydrogenase, MgCl2, alamethicin, and uridine 5′-diphosphoglucuronic acid (UDPGA) trisodium salt were obtained from Sigma-Aldrich Co. (St Louis, MO, USA). Pooled human liver microsomes (HLM) from 150 donors (75 males and 75 females), Dulbecco’s Modified Eagle’s Medium, Hank’s balanced salt solution, fetal bovine serum, nonessential amino acids, and other cell culture reagents were purchased from Corning Life Sciences (Corning, NY, USA). The Transwell culture plates (24-well, 6.4 mm diameter, 0.4 μm pore size) were purchased from BD Biosciences (Bedford, MA, USA). M-1 (purity: 98.9%) was synthesized by Dr Jae-Hong Seo (The Catholic University of Korea, Bucheon, South Korea). All solvents were of high-performance liquid chromatography grade and were obtained from Honeywell Burdick & Jackson (Morris Plains, NJ, USA), and other chemicals were of the highest quality available.
Bidirectional transport assay of sarpogrelate- and M-1-induced inhibition of P-gp and BCRP
The cell culture and bidirectional transport studies were performed as previously described.31–33 Briefly, for the transport inhibition studies, 24-well Millicell® inserts were preincubated with culture medium (30 minutes at 37°C), seeded at a density of 3×10⁵ cells/cm2, and then cultured for 4 days to obtain a monolayer. On day 5, the integrity of the cell monolayers was evaluated by measuring the transepithelial electrical resistance using a Millicell ohmmeter at the beginning and end of the experiments. The cells were considered suitable for use in the transport assay when their transepithelial electrical resistance values were at least 200 Ω cm2. To investigate P-gp inhibition, the P-gp probe substrate, loperamide (10 μM)31 was added to either the apical (AP) or basolateral (BL) side of a confluent monolayer of MDCK-II-P-gp cells in the presence and absence of sarpogrelate or M-1 (0.2, 1, and 10 μM). After 1 hour incubation at 37°C, samples (0.1 mL) were withdrawn from the opposite side of the membrane, and then 0.3 mL of acetonitrile containing 2 μM chlorpropamide as an internal standard was added with mixing. The mixture was then centrifuged (13,000 g for 8 minutes at 4°C) and the supernatant was subsequently injected into the liquid chromatography-tandem mass spectrometry (LC-MS/MS) system for the determination of loperamide. The BCRP probe substrate, prazosin (10 μM)32 was used in a confluent monolayer of MDCK-II-BCRP cells to investigate the BCRP inhibition. Other procedures used were similar to those of the P-gp inhibition studies. The well-known inhibitors, cyclosporine A and Ko143 (10 μM each) were included as positive controls for P-gp and BCRP, respectively, to evaluate the suitability of these experiments.31,32 The concentrations of loperamide and prazosin were quantified using previously reported LC-MS/MS methods.34,35 Three independent experiments were performed, and their mean values were used for analysis. The apparent permeability coefficient (Papp) of the cellular monolayers was calculated using the following equation:33
|
|
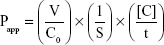
where V is the volume of medium in the receiver chamber, C0 is the donor compartment concentration at time zero, S is the area of the cell monolayer, t is the treatment time of the drug, and [C] is the drug concentration in the receiver chamber. The percent inhibition of P-gp and BCRP was calculated using the following equation:33
|
|
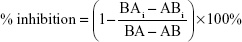
where BA and AB are the BL to AP and AP to BL permeability, respectively, of loperamide (or prazosin for BCRP) alone while BAi and ABi are the BL to AP and AP to BL permeability, respectively, of loperamide (or prazosin for BCRP) in the presence of specific inhibitors.
All the data are expressed as mean ± standard deviation (SD), and statistical analysis was performed by Dunnett’s test for multiple comparisons. The criterion of significance was taken to be P<0.05.
Metabolic stability of sarpogrelate and M-1 in human liver microsomes for determining intrinsic clearance (CLint)
Prior to the metabolic stability, human liver microsomal concentrations (0.05–0.5 mg/mL), reaction times (0–90 minutes), and substrate concentrations (0.1–50 μM) were optimized. The metabolic stability study of sarpogrelate and M-1 was subsequently conducted at an enzyme content of 0.1 mg/mL, a substrate concentration of 400 nM, and an incubation time up to 60–90 minutes.
To determine the carboxylesterase-mediated hydrolysis, incubation mixtures (final volume, 1 mL) containing pooled HLM (final concentrations, 0.1 mg/mL) and 50 mM phosphate buffer (pH 7.4) were preincubated for 5 minutes at 37°C. The reaction was initiated by the addition of an aliquot of sarpogrelate (400 nM) and incubated for 0–60 minutes. To determine the NADPH-dependent metabolic stability and carboxylesterases-mediated hydrolysis, incubation mixtures (final volume, 1 mL) containing pooled HLM (final concentrations: 0.1 mg/mL), 50 mM phosphate buffer (pH 7.4), and an NADPH-generating system (1.3 mM NADP+, 3.3 mM glucose 6-phosphate, 3.3 mM MgCl2, and 0.4 unit/mL glucose-6-phosphate dehydrogenase) were preincubated for 5 minutes at 37°C. The reaction was initiated by the addition of an aliquot of sarpogrelate (400 nM) and incubated for 0–90 minutes. The NADPH-dependent metabolic stability of M-1 in HLM was also evaluated.
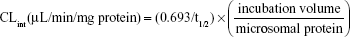
To determine the UDPGA-dependent metabolic stability and carboxylesterase-mediated hydrolysis, the incubation mixtures (final volume, 1 mL) containing pooled HLM (final concentration, 0.1 mg/mL), 100 mM Tris buffer (pH 7.5), 25 μg/mL alamethicin, 5 mM MgCl2, and 5 mM UDPGA were preincubated for 15 minutes on ice to allow the formation of alamethicin pores. The reaction was initiated by the addition of an aliquot of sarpogrelate (400 nM), and incubated for 0–60 minutes at 37°C. Then, at 0, 5, 10, 20, 30, and 60 minutes, 50 μL samples were withdrawn and 300 μL ice-cold acetonitrile containing the internal standard, ketanserin (100 ng/mL) was added to stop the reaction. Then, the mixtures were centrifuged (13,000× g for 10 minutes at 4°C) and 5-μL aliquots of the supernatants were injected into an LC-MS/MS system. All the incubations were performed in duplicate and mean values were used in the analysis. The LC-MS/MS conditions for the determination of sarpogrelate and M-1 were the same as previously described.20 The metabolic stability expressed as a percentage of the test compound (sarpogrelate or M-1) remaining was calculated by comparing the peak area ratios of sarpogrelate and M-1 to the internal standard at specific time points relative to time 0 minutes. The t1/2 was estimated from the slope of the initial linear range of the logarithmic curve of the residual sarpogrelate (%) versus time, assuming a first-order kinetics. The intrinsic clearance (CLint) was calculated using the following equation:
|
|
Physiologically based pharmacokinetic model development and validation
A PBPK model was constructed for sarpogrelate and its active metabolite, M-1, using a Simcyp® Simulator version 15. The detailed input parameters for sarpogrelate and M-1 are shown in Table 2. In humans, sarpogrelate was rapidly absorbed (Tmax, 0.889±0.651 hours), and no unchanged sarpogrelate was detected in either urine or feces up to 24 hours after a 100 mg oral dose of sarpogrelate.21 In addition, sarpogrelate is known to be a biopharmaceutics classification system (BCS) Class I drug with a high solubility and permeability profile.36 Taken together, these findings suggest that sarpogrelate is completely and rapidly absorbed after oral dosing. Therefore, the absorbed fraction (fa) and lag time available for absorption from the dosage form were assumed to be 1 and 0, respectively. The Simcyp® segmental advanced dissolution absorption metabolism (ADAM) model37 was used for the absorption studies. The sarpogrelate tablets used in this study were formulated for immediate release and, therefore, the reported in vitro dissolution profiles were input into the ADAM model. Since the permeability of sarpogrelate is high, its distribution was assumed to be perfusion-limited in all organs. The steady-state volume of distribution (Vss) of sarpogrelate and M-1 was predicted using the mathematical model 238 implemented in Simcyp®. The results showed that the predicted Vss values of sarpogrelate and M-1 were 0.1 and 0.485 L/kg, respectively (Table 2). The value of CLR was set to zero because no intact sarpogrelate was detected in the urine up to 24 hours after oral dosing of sarpogrelate 100 mg in humans.21 Thus, in the metabolism module, the in vitro CLint of sarpogrelate and M-1 in HLM was obtained from the aforementioned experiment. Esterases in the blood, intestine, and liver play important roles in drug metabolism and detoxication.39 To clarify the role of other tissues in sarpogrelate hydrolysis, we examined the metabolic stability of sarpogrelate (400 nM) in human blood and human intestinal microsomes. After 60-minute incubation of sarpogrelate, the formation of M-1 blood was not observed in the human intestinal microsomes and human blood (data not shown). This finding suggests that the carboxylesterases in the liver might be important for sarpogrelate hydrolysis into M-1. The values of the unbound fraction in HLM and the CLint in the recombinant UGTs (UGT1A4, UGT1A9, UGT2B4, and UGT2B7) of M-1 used were from previous studies.17,40 The additional systemic clearance of sarpogrelate was back-calculated using the retrograde calculation method based on the oral clearance and in vitro carboxylesterase- and UDPGA-dependent CLint of sarpogrelate. The result was then incorporated into the model to fit the observed values. For the interaction module, our previous published data17 of the in vitro CYP2D6 competitive inhibition of sarpogrelate and M-1 were incorporated into the PBPK model (Table 2).
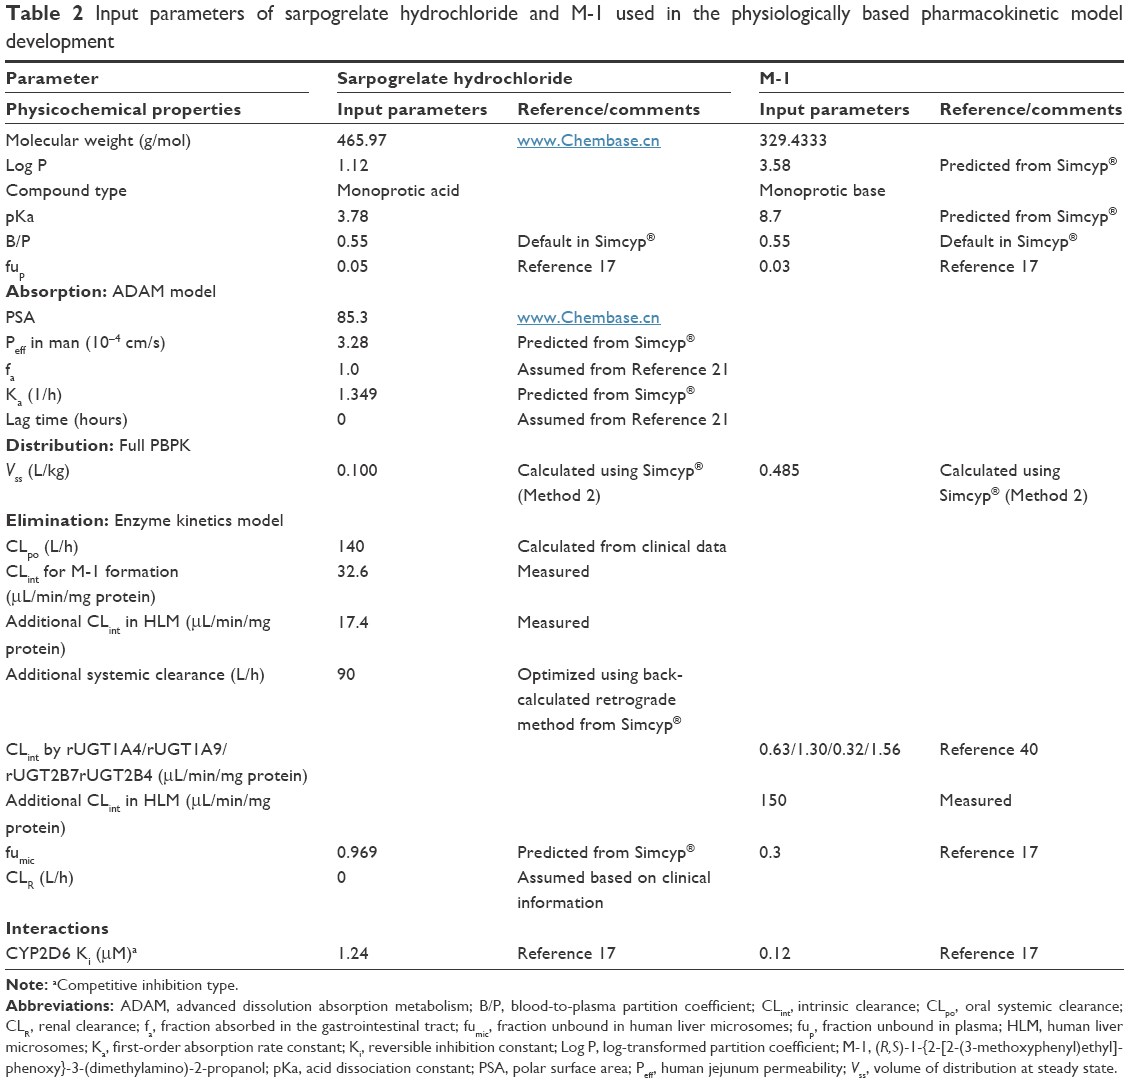 | Table 2 Input parameters of sarpogrelate hydrochloride and M-1 used in the physiologically based pharmacokinetic model development |
The simulations were performed with the data of randomly selected individuals aged from 20 to 50 years with a sex ratio of 1:1 from a Sim-Healthy Volunteer population built into the Simcyp® Simulator version 15 unless stated otherwise. The existing virtual populations showed frequencies of the CYP2D6 extensive, poor, and ultra-rapid metabolizer (EM, PM, and UM, respectively) phenotypes to be 0.865, 0.082, and 0.053, respectively. Simulations of ten trials with ten subjects each were performed with oral administration of sarpogrelate 100 mg either as single or as multiple doses, three times for 1 day. The plasma concentration-time profiles of sarpogrelate and M-1 after a 100-mg oral dose of sarpogrelate obtained from a previously published study were used to build the PBPK model.20 The PBPK model was evaluated by comparing the predicted pharmacokinetics profiles of sarpogrelate and M-1 with the observed published data.20–24,41–43 Then, the predicted pharmacokinetic parameters such as AUC, Cmax, and time to achieve Cmax (Tmax) were calculated to compare with reported clinical data.20–24,40–42
Sensitivity analysis
A sensitivity analysis was performed to evaluate the effects of input parameters of interest (log-transformed partition coefficient [log P]; blood-to-plasma partition coefficient [B/P]; fraction unbound in plasma [fup]; first-order absorption rate constant [Ka]; acid dissociation constant [pKa]; fraction unbound in HLM [fumic]; and reversible inhibition constant for sarpogrelate hydrochloride [Ki]) on the AUC and Cmax of sarpogrelate, and the CYP2D6 inhibition (AUC fold ratio of metoprolol) using a Simcyp® Simulator version 15. The following values within a tenfold range were entered in the PBPK model: log P (0.11–11.20), B/P (0.1–1.0), fup (0.00–1.49), Ka (0.13–13.49), pKa (0.38–14.00), fumic (0.10–1.00), and Ki (0.12–12.40). In addition, sensitive analysis was performed to assess the effect of Ki for M-1 on the CYP2D6 inhibition. Sensitivity index was used to judge the extent of sensitivity, for which the normal range was from −1.12 to 1.44,45
DDI prediction using PBPK model of sarpogrelate
The PBPK model with the incorporated in vitro inhibition potency data of sarpogrelate and M-1 on CYP2D6 was used to simulate the effect of single (100 mg) or multiple (100 mg, three times daily [tid] for 3 days) oral dosing of sarpogrelate hydrochloride on the pharmacokinetic profiles of coadministered clinically relevant CYP2D6 substrates. The specific substrates were metoprolol, desipramine, dextromethorphan, imipramine, and tolterodine, and their PBPK models, which are available in the Simcyp® compound library, were directly used in the simulation. The DDI predictions were performed by using the dosing regimens and trial sizes described in Table 3. The simulation with metoprolol included only EMs for CYP2D6 to enable a direct comparison with the observed clinical data.25
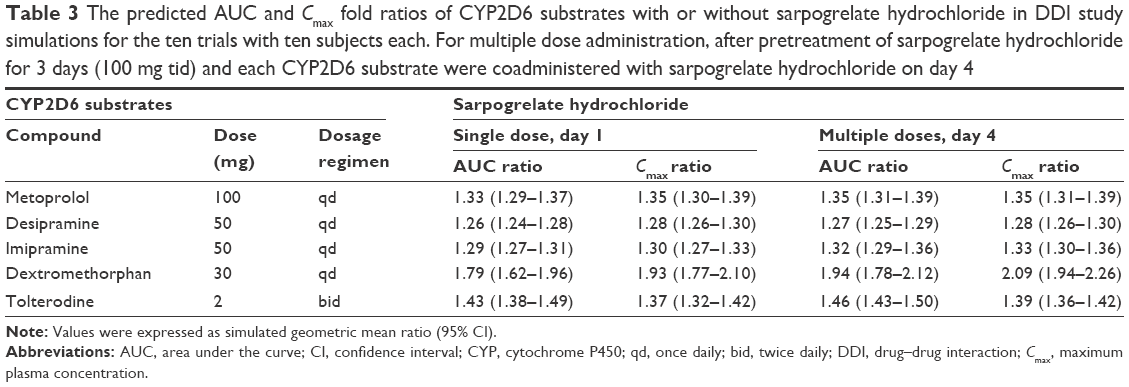 | Table 3 The predicted AUC and Cmax fold ratios of CYP2D6 substrates with or without sarpogrelate hydrochloride in DDI study simulations for the ten trials with ten subjects each. For multiple dose administration, after pretreatment of sarpogrelate hydrochloride for 3 days (100 mg tid) and each CYP2D6 substrate were coadministered with sarpogrelate hydrochloride on day 4 |
Results
Bidirectional transport assay of sarpogrelate- and M-1-induced inhibition of P-gp or BCRP
The inhibitory effects of sarpogrelate or M-1 on P-gp- and BCRP-mediated loperamide and prazosin transport were investigated in MDCK-II-P-gp and MDCK-II-BCRP cells, respectively. The cytotoxicity of sarpogrelate and M-1 was determined by using the MTT assay before evaluating their effects on the functions of P-gp or BCRP. The MDCK-II-P-gp and MDCK-II-BCRP cells exhibited a viability of >97% after 1 hour incubation with the highest drug concentration tested (10 μM). As shown in Table 4, both sarpogrelate and M-1 had no apparent inhibitory effects on P-gp-mediated loperamide transport, showing a <10% inhibition. Sarpogrelate and M-1 also did not inhibit the BCRP-mediated prazosin transport. These results suggest that the inhibitory effects of sarpogrelate and M-1 via P-gp and BCRP transporters appear to be negligible and, therefore, the input parameters related to the inhibition of efflux transporters for the interaction module were not included in this study.
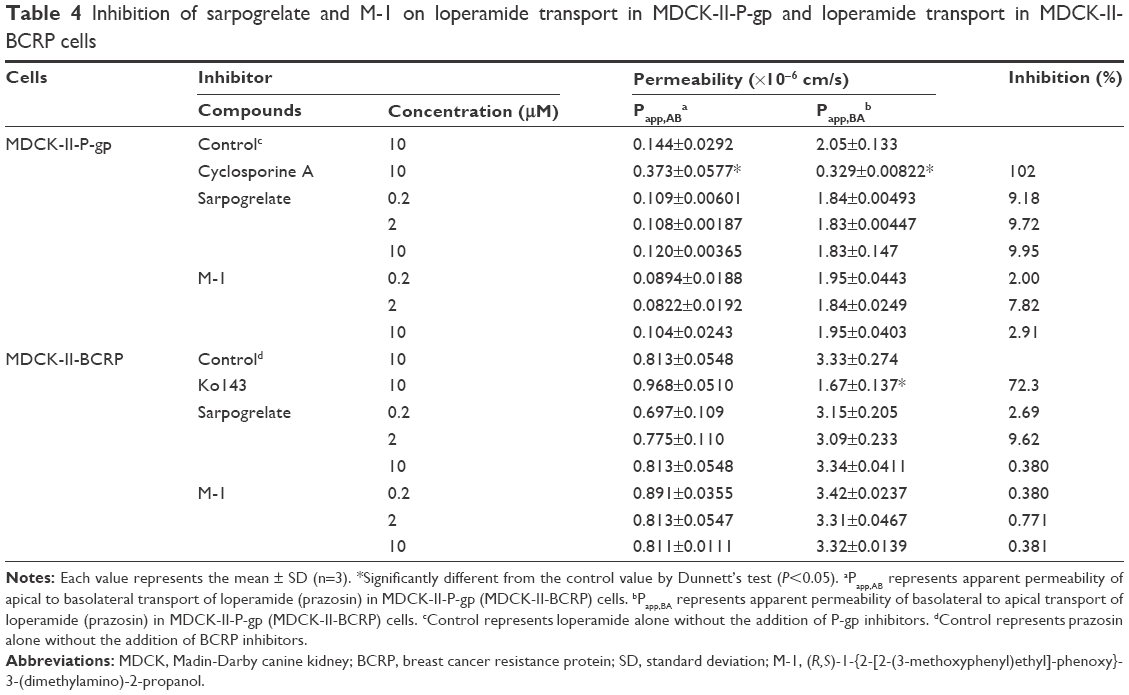 | Table 4 Inhibition of sarpogrelate and M-1 on loperamide transport in MDCK-II-P-gp and loperamide transport in MDCK-II-BCRP cells |
Metabolic stability of sarpogrelate and M-1 in human liver microsomes for determination of CLint
The carboxylesterase-mediated CLint, which represents M-1 generation, and the carboxylesterase and UDPGA-dependent CLint were calculated to be 32.6±3.18 μL/min/mg and 50.0±7.89 μL/min/mg protein, respectively, when incubated with 400 nM sarpogrelate in HLM. However, the carboxylesterase and NADPH-dependent CLint of sarpogrelate was calculated to be 36.9±5.20 μL/min/mg protein, which was not significantly different from the carboxylesterase-mediated CLint (32.6±3.18 μL/min/mg protein). This result indicates that sarpogrelate was mainly metabolized to M-1 by carboxylesterase (CLint =32.6 μL/min/mg protein), and directly conjugated to glucuronides with a relatively lower contribution (CLint =17.4 μL/min/mg protein). For M-1, the calculated CLint at 400 nM in HLM in the presence of the NADPH generating system was 150±10.9 μL/min/mg protein, indicating that M-1 was extensively metabolized by the CYP isoforms. It has been reported that UGT1A9, UGT1A4, UGT2B4, and UGT2B7 (CLint =1.30, 0.63, 0.94, and 0.32 μL/min/mg protein, respectively) are the major isoforms responsible for M-1 glucuronidation by the respective recombinant UGTs.40 Based on these results, the generated M-1 from sarpogrelate was extensively metabolized by CYP isoforms and also conjugated into glucuronides to a lesser extent. Therefore, the metabolic conversion of sarpogrelate to M-1 might be a rate-limiting process in the disposition of M-1.
PBPK model development and validation for sarpogrelate hydrochloride and M-1
The comparison of the observed and predicted time–concentration curves of sarpogrelate and M-1 after single oral dosing sarpogrelate hydrochloride 100 mg revealed that the line shapes of both profiles were similar (Figure 1). The simulated AUC and Cmax (geometric mean) values of sarpogrelate were approximately 645.4 ng h/mL and 494.2 ng/mL, respectively, for the ten trials with ten subjects each, in line with the observed values20–24 of AUC and Cmax at 348.3–621.5 ng h/mL and 343.0–635.1 ng/mL, respectively (Table 1). The predicted AUC and Cmax of M-1 were approximately 91.0 ng h/mL and 38.9 ng/mL, respectively, for the ten trials, which were in good agreement with the observed values of 86.2 ng h/mL and 47.6 ng/mL, respectively (Table 1). Furthermore, the ratio of predicted mean AUC values of M-1 to sarpogrelate was 0.129, in agreement with the observed ratio of 0.139.
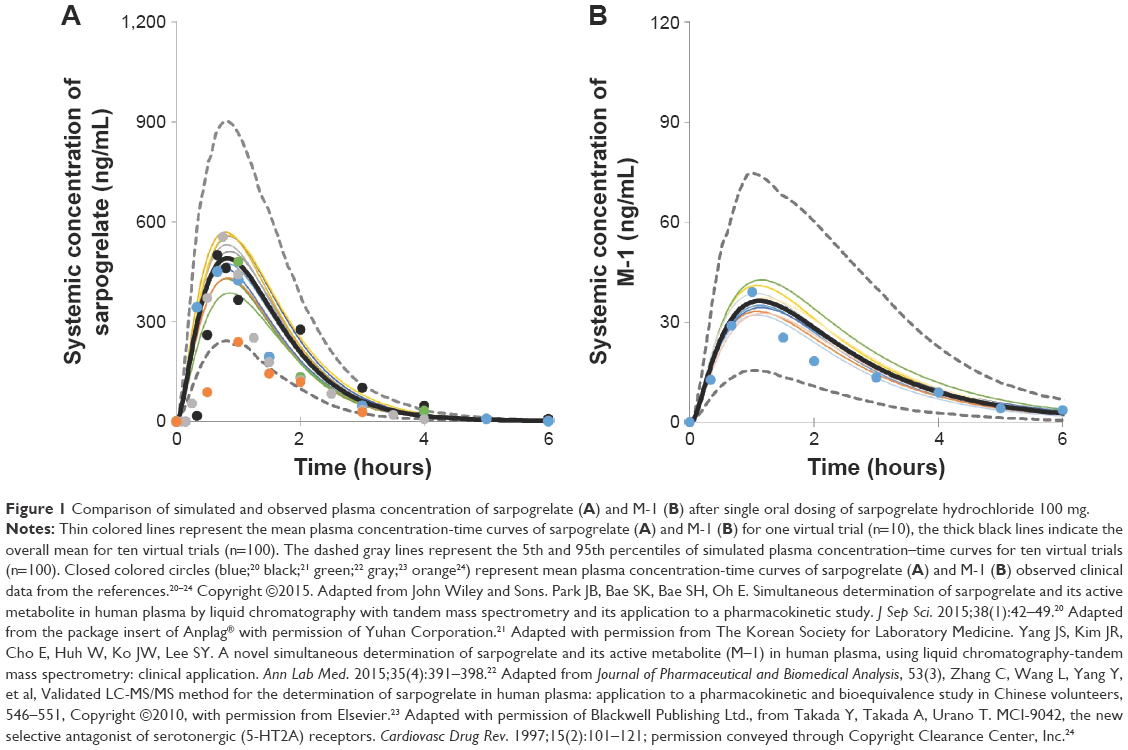 | Figure 1 Comparison of simulated and observed plasma concentration of sarpogrelate (A) and M-1 (B) after single oral dosing of sarpogrelate hydrochloride 100 mg. |
The simulated and observed mean plasma concentration-time profiles of sarpogrelate and M-1 after multiple doses of sarpogrelate hydrochloride (100 mg tid, for 1 day) match reasonably well (data not shown). After multiple doses, the simulated AUC0–24 h and Cmax values of sarpogrelate were 1,951 ng h/mL and 502.9 ng/mL, respectively, which were in good agreement with the observed values41–43 of 1,291–1,773 ng h/mL and 466.0–781.6 ng/mL, respectively (Table 1). The predicted AUC0–24 h of M-1 was 254.4 ng h/mL, which is in the range of values of 246.2–267.2 ng h/mL observed (Table 1).
Sensitivity analysis
Sensitivity analysis of log P, B/P, fup, Ka, pKa, fumic, and Ki for sarpogrelate hydrochloride would help identify whether the input parameters can significantly affect prediction of AUC and Cmax of sarpogrelate, and the CYP2D6 inhibition (AUC fold ratio of metoprolol). Sensitivity analysis was performed in Simcyp® software (version 15) and sensitivity index plots of log P, B/P, fup, and fumic are shown in Figure 2. The sensitivity index was used to assess the sensitivity, which demonstrated sensitivity when it was out of range between −1.12 and 1. Finally, the free fraction in plasma (fup) was observed significantly sensitive to AUC and Cmax of sarpogrelate, and the CYP2D6 inhibition, which showed an increase in fup would increase the predicted exposure of sarpogrelate and decrease the CYP2D6 inhibition (Figure 2G–I). As expected, the Ki for sarpogrelate or M-1 were significantly affected on the CYP2D6 inhibition, a lower Ki value led to greater the predicted fold-increase in the AUC of metoprolol (data not shown). The other input parameters were shown to have no effects on the exposure of sarpogrelate and the CYP2D6 inhibition.
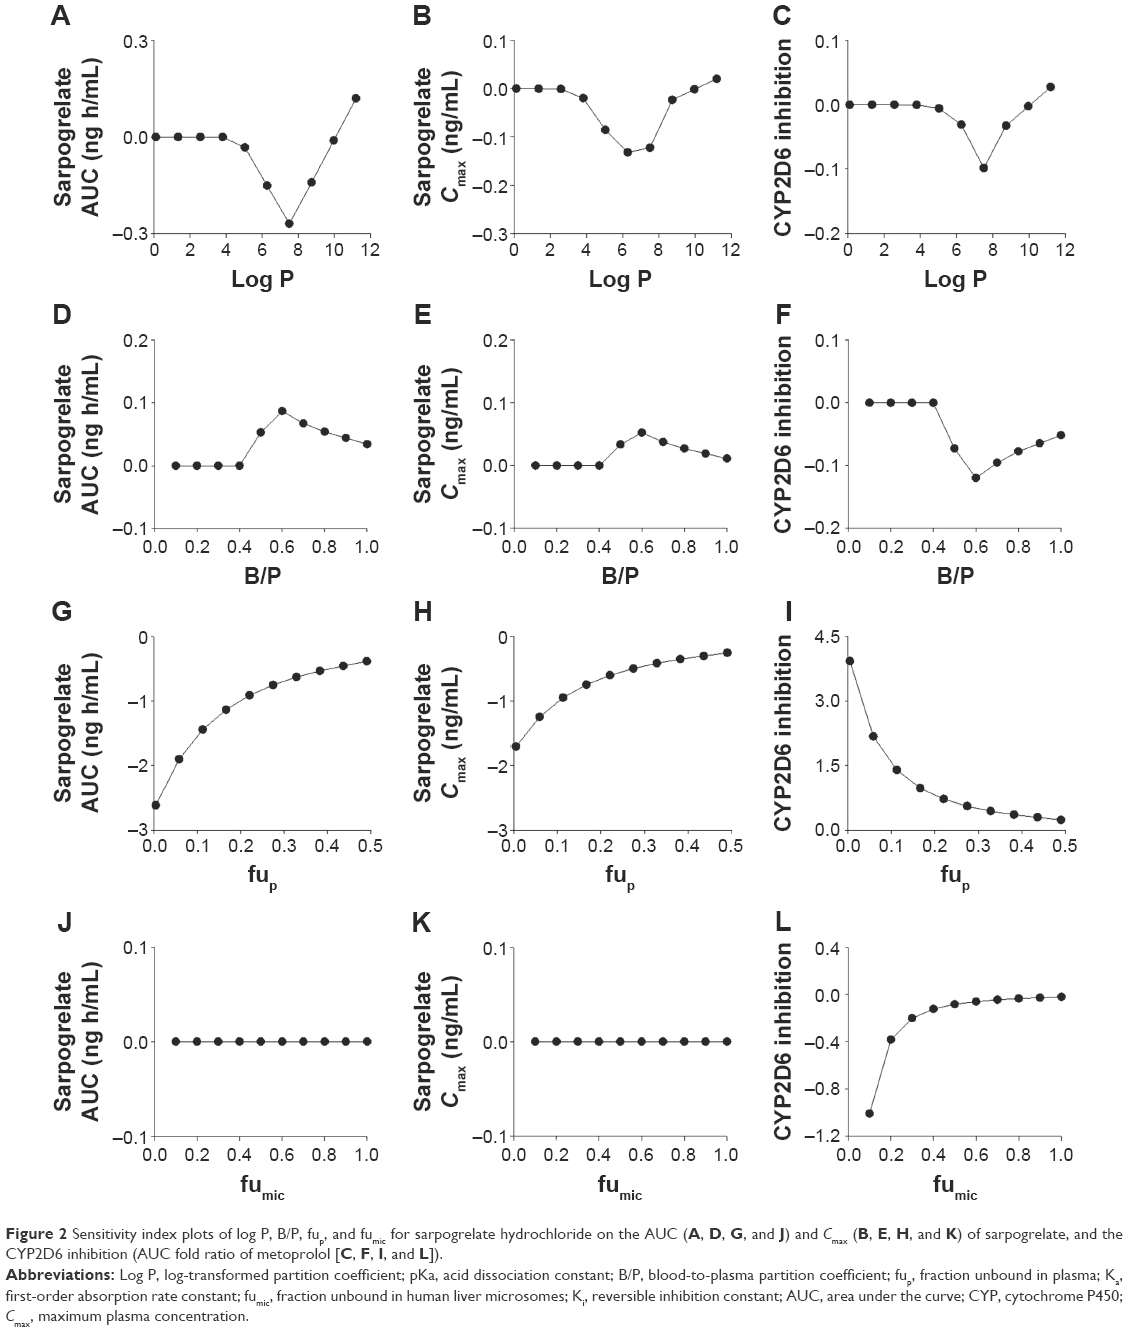 | Figure 2 Sensitivity index plots of log P, B/P, fup, and fumic for sarpogrelate hydrochloride on the AUC (A, D, G, and J) and Cmax (B, E, H, and K) of sarpogrelate, and the CYP2D6 inhibition (AUC fold ratio of metoprolol [C, F, I, and L]). |
Prediction of DDIs using sarpogrelate hydrochloride and M-1 PBPK model
The developed PBPK model for sarpogrelate hydrochloride and M-1 was used to simulate DDIs between sarpogrelate hydrochloride and the clinically relevant CYP2D6 substrates, metoprolol, desipramine, dextromethorphan, imipramine, and tolterodine. The simulated pharmacokinetic profiles of metoprolol following single and multiple oral doses of sarpogrelate hydrochloride, considering both sarpogrelate and M-1 as CYP2D6 inhibitors, are shown in Figure 3. The predicted AUC and Cmax of metoprolol, desipramine, dextromethorphan, imipramine, and tolterodine following coadministration with oral single or multiple doses of sarpogrelate hydrochloride (100 mg tid, for 3 days) are summarized in Table 3. The predicted fold-increase (geometric mean) in the AUC and Cmax of metoprolol after a single administration of sarpogrelate hydrochloride 100 mg was approximately 1.33-fold (95% confidence interval [CI], 1.29–1.37) and 1.35-fold (95% CI, 1.30–1.39), respectively for ten trials (Table 3), which closely agreed with the observed values of 1.53 (95% CI, 1.09–2.32) and 1.62-fold (95% CI, 1.16–2.58), respectively.25 Furthermore, the simulated increase (geometric mean) in the AUC and Cmax for metoprolol after sarpogrelate hydrochloride (100 mg tid, for 3 days) was 1.35 (95% CI, 1.31–1.39) and 1.35 (95% CI, 1.31–1.39) for ten trials. These values were reasonably close to the observed values of 1.51 (95% CI, 1.04–2.30) and 1.67 (95% CI, 1.23–2.55), respectively (Table 3).25 This result indicates that the developed PBPK model adequately predicted the pharmacokinetics of sarpogrelate and M-1, as well as the associated DDIs mediated by CYP2D6 inhibition. The predicted fold-increases in the AUC and Cmax for desipramine, imipramine, dextromethorphan, tolterodine after a single or multiple administration of sarpogrelate hydrochloride are summarized in Table 3. It is noteworthy that dextromethorphan exhibited the largest change in the AUC and Cmax induced by sarpogrelate coadministration with the tested five CYP2D6 substrates since the highest fraction of dextromethorphan was cleared by CYP2D6 compared with the other substrates (Table 3).
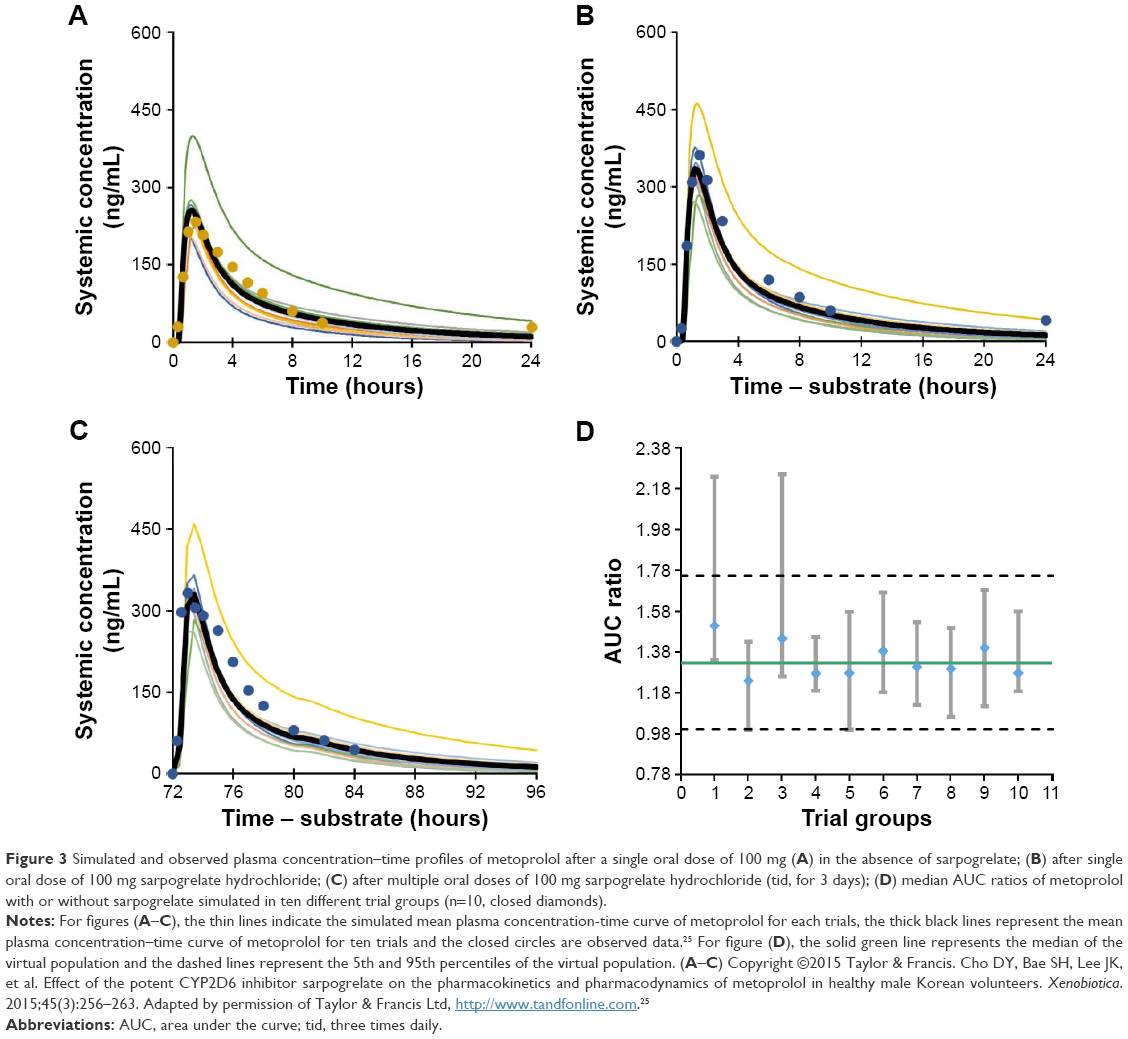 | Figure 3 Simulated and observed plasma concentration–time profiles of metoprolol after a single oral dose of 100 mg (A) in the absence of sarpogrelate; (B) after single oral dose of 100 mg sarpogrelate hydrochloride; (C) after multiple oral doses of 100 mg sarpogrelate hydrochloride (tid, for 3 days); (D) median AUC ratios of metoprolol with or without sarpogrelate simulated in ten different trial groups (n=10, closed diamonds). |
In addition, the developed PBPK model reasonably predicted the pharmacokinetics of the CYP2D6-sensitive substrates, metoprolol, desipramine, dextromethorphan, imipramine, and tolterodine independent of the CYP2D6 phenotype in the presence of sarpogrelate, as a CYP2D6 inhibitor. The existing virtual populations, with the exception of the simulation of metoprolol, exhibited frequencies for the CYP2D6 EM, PM, and UM phenotypes of 0.865, 0.082, and 0.053, respectively. For instance, in the presence of single dose of 100 mg sarpogrelate hydrochloride, the mean predicted AUC fold-increase in dextromethorphan in the CYP2D6 PM and UM (frequency, 1.0 each) subjects were 1.00 and 2.91, respectively (data not shown). Furthermore, similar patterns were observed with the mean predicted Cmax fold-increase for dextromethorphan, which was 1.00 and 3.12 (frequency, 1.0 each) in the PM and UM CYP2D6 phenotypes (data not shown). When the frequency of PM phenotype is set to 1.0, the inhibition of CYP2D6 does not have any significant effects of the CYP2D6-mediated DDI.
Discussion
Although sarpogrelate hydrochloride, a selective 5-HT2A antagonist, has been widely used as an antiplatelet agent for the treatment of peripheral artery disease, clinical DDI studies with other drugs have not been well investigated. As mentioned in the Introduction section, from in vitro and in vivo data, the clinical DDI potential associated with CYP2D6 inhibition could not be excluded for sarpogrelate hydrochloride, and clinical studies were warranted.
Here, we developed a PBPK model that linked sarpogrelate hydrochloride to its active metabolite M-1 for simulating the DDIs of sarpogrelate with the clinically relevant CYP2D6 substrates, metoprolol, desipramine, dextromethorphan, imipramine, and tolterodine. We achieved this by using the physicochemical and pharmacokinetic properties of sarpogrelate hydrochloride and M-1 based on the findings of in vitro and clinical in vivo studies. To the best of our knowledge, there are no clear guidelines regarding the error range that should be used for the evaluation of predictions obtained by PBPK models. The range most commonly used in research studies in this field is a twofold error range.46,47 The predicted/observed ratios of the AUC, Cmax, and Tmax for both sarpogrelate and M-1 were within the twofold error range, suggesting that this constructed PBPK model appropriately described the process determining the human pharmacokinetics of sarpogrelate and M-1 (Table 1). Furthermore, we successfully used the developed model to simulate the pharmacokinetics and DDI potentials of sarpogrelate hydrochloride and the CYP2D6-targeted drugs, metoprolol, desipramine, dextromethorphan, imipramine, and tolterodine. The predicted data showed 1.33- and 1.35-fold increases in metoprolol AUC and Cmax, which were reasonably close to its observed values (1.53- and 1.62-fold, respectively) after a single oral dose of sarpogrelate hydrochloride. Furthermore, the simulated increase in the AUC and Cmax (1.35- and 1.35-fold) for metoprolol after 100 mg of sarpogrelate hydrochloride administered tid for 3 days was also reasonably close to the observed values (1.51- and 1.67-fold, respectively). The magnitude of the simulated DDIs was slightly lower than the observed values, but they were at an acceptable level (twofold lower). A large variability in the mean DDI ratio was observed in the different trial groups (Figure 3D). Hence, the differences between the observed and predicted data could be due to the subjects in the actual trial being similar to those sampled from the trial group 1, but different from subjects sampled in the other trial groups. Considering the limited number of subjects (n=9) in the clinical study, the PBPK modeling could potentially provide a superior perspective of the DDI between sarpogrelate hydrochloride and the CYP2D6-sensitive substrates.
The predicted fold-increase in the AUC ratios of metoprolol, desipramine, imipramine, dextromethorphan, and tolterodine following single and multiple oral doses of sarpogrelate hydrochloride was within the range of ≥1.25 but <2-fold, indicating that sarpogrelate hydrochloride might be a weak inhibitor of CYP2D6 in vivo (Table 3). From predicted results, dextromethorphan exhibited the highest sensitivity (1.79- and 1.93-fold, AUC and Cmax, respectively) to coadministration with sarpogrelate of the five tested CYP2D6 substrates. This was likely because dextromethorphan is a most sensitive substrate to CYP2D6 among the other substrates are.28 The metabolized fractions by CYP2D6 for dextromethorphan, desipramine, and metoprolol were reported to be 0.96, 0.88, and 0.83, respectively.28 Taken together, the predicted low DDI results suggest that sarpogrelate hydrochloride has a limited potential to cause significant DDIs with drugs associated with CYP2D6-mediated metabolism. Furthermore, the pharmacokinetics of the CYP2D6-sensitive substrate, metoprolol, desipramine, dextromethorphan, imipramine, and tolterodine were predicted by the developed PBPK model independent of the CYP2D6 phenotype in the presence of the CYP2D6 inhibitory actions of sarpogrelate. These simulated results were consistent with the expectation that the administration of a potent CYP2D6 inhibitor is not expected to cause a marked CYP2D6-mediated DDI in individuals exhibiting the PM phenotype.28 Several reports have shown that patients lacking the CYP2D6 genes or who are PMs of CYP2D6 substrates, have little or no CYP2D6 activity and, therefore, further enzyme inhibition by a CYP2D6 inhibitor does not affect their exposure to a CYP2D6-sensitive substrate.48–51
To the best of our knowledge, this study is the first demonstration that the inhibitory effects of sarpogrelate and M-1 mediated by the P-gp and BCRP transporters appear to be negligible, and the possibility of DDIs between sarpogrelate and other P-gp or BCRP substrates is unlikely. However, the current model has some limitations that are worth mentioning. The UGTs and CYP isoforms involved in the metabolism of sarpogrelate and M-1, respectively, were not characterized. The calculated CLint for sarpogrelate and M-1 was assigned collectively as an additional clearance. These metabolic pathways may be critical in predicting the DDIs if an inhibitor or inducer of the relevant enzymes is coadministered with sarpogrelate hydrochloride. In this study, we focused on sarpogrelate as a CYP2D6 inhibitor and, therefore, the effects of sarpogrelate on the pharmacokinetics of CYP2D6-sensitive substrates in vivo were our priority. The incorporation of additional in vitro data would lead to a more informative analysis in the assessment of the likelihood of DDIs.
Conclusion
In the present study, the developed PBPK model was successfully used to simulate the pharmacokinetic profiles of sarpogrelate and its active metabolite, M-1 after single and multiple oral doses of sarpogrelate hydrochloride (100 mg). Considering that this model has successfully predicted the magnitude of the sarpogrelate hydrochloride-metoprolol interaction, it is conceivable that DDIs with other CYP2D6 substrates, desipramine, dextromethorphan, imipramine, and tolterodine, can be predicted reasonably well by our developed PBPK model. As a result, sarpogrelate hydrochloride might be a weak inhibitor of CYP2D6 in vivo, suggesting that it has limited potential for causing significant DDIs associated with CYP2D6 inhibition. These results collectively indicated that this model would be beneficial in the design and optimization of clinical DDI studies using sarpogrelate as an in vivo CYP2D6 inhibitor.
Acknowledgments
The authors would like to thank Drs Alfred H Schinkel and Piet Borst (the Netherlands Cancer Institute, Amsterdam, the Netherlands) for kindly donating the MDCK-II-P-gp and MDCK-II-BCRP cells. This research was supported by the Bio & Medical Technology Development Program of the National Research Foundation funded by the Ministry of Science, ICT & Future Planning, Korea (No 2013M3A9B5075838 and No 2013M3A9B5075840) and the Research Fund of The Catholic University of Korea.
Author contributions
JH Seo, E Oh, SH Bae and SK Bae participated in the research design. JS Min, D Kim, and JB Park conducted experiments. JS Min, H Heo, and SH Bae collected the data and performed data analysis. JS Min and SK Bae wrote the manuscript. All authors contributed toward data analysis, drafting and critically revising the paper and agree to be accountable for all aspects of the work.
Disclosure
The authors reports no conflicts of interest in this work.
References
Huang SM. PBPK as a tool in regulatory review. Biopharm Drug Dispos. 2012;33(2):51–52. | ||
Jones H, Rowland-Yeo K. Basic concepts in physiologically based pharmacokinetic modeling in drug discovery and development. CPT Pharmacometrics Syst Pharmacol. 2013;2:e63. | ||
Leong R, Vieira ML, Zhao P, et al. Regulatory experience with physiologically based pharmacokinetic modeling for pediatric drug trials. Clin Pharmacol Ther. 2012;91(5):926–931. | ||
Rowland M, Peck C, Tucker G. Physiologically-based pharmacokinetics in drug development and regulatory science. Annu Rev Pharmacol Toxicol. 2011;51:45–73. | ||
Sinha V, Zhao P, Huang SM, Zineh I. Physiologically based pharmacokinetic modeling: from regulatory science to regulatory policy. Clin Pharmacol Ther. 2014;95(5):478–480. | ||
Zhao P, Rowland M, Huang SM. Best practice in the use of physiologically based pharmacokinetic modeling and simulation to address clinical pharmacology regulatory questions. Clin Pharmacol Ther. 2012;92(1):17–20. | ||
Doggrell SA. Sarpogrelate: cardiovascular and renal clinical potential. Expert Opin Investig Drugs. 2004;13(7):865–874. | ||
Miyazaki M, Higashi Y, Goto C, et al. Sarpogrelate hydrochloride, a selective 5-HT2A antagonist, improves vascular function in patients with peripheral arterial disease. J Cardiovasc Pharmacol. 2007;49(4):221–227. | ||
Hara H, Osakabe M, Kitajima A, Tamao Y, Kikumoto R. MCI-9042, a new antiplatelet agent is a selective S2-serotonergic receptor antagonist. Thromb Haemost. 1991;65(4):415–420. | ||
Rashid M, Manivet P, Nishio H, et al. Identification of the binding sites and selectivity of sarpogrelate, a novel 5-HT2 antagonist, to human 5-HT2A, 5-HT2B and 5-HT2C receptor subtypes by molecular modeling. Life Sci. 2003;73(2):193–207. | ||
Yamashita T, Kitamori K, Hashimoto M, Watanabe S, Giddings JC, Yamamoto J. Conjunctive effects of the 5HT(2) receptor antagonist, sarpogrelate, on thrombolysis with modified tissue plasminogen activator in different laser-induced thrombosis models. Haemostasis. 2000;30(6):321–332. | ||
Saini HK, Takeda N, Goyal RK, Kumamoto H, Arneja AS, Dhalla NS. Therapeutic potentials of sarpogrelate in cardiovascular disease. Cardiovasc Drug Rev. 2004;22(1):27–54. | ||
Noh Y, Lee J, Shin S, et al. Antiplatelet therapy of cilostazol or sarpogrelate with aspirin and clopidogrel after percutaneous coronary intervention: a retrospective cohort study using the Korean national health insurance claim database. PLoS One. 2016;11(3):e0150475. | ||
Shinohara Y, Nishimaru K, Sawada T, et al; S-ACCESS Study Group. Sarpogrelate-Aspirin Comparative Clinical Study for Efficacy and Safety in Secondary Prevention of cerebral infarction (S-ACCESS): a randomized, double-blind, aspirin-controlled trial. Stroke. 2008;39(6):1827–1833. | ||
Park SY, Rhee SY, Oh S, et al. Evaluation of the effectiveness of sarpogrelate on the surrogate markers for macrovascular complications in patients with type 2 diabetes. Endocr J. 2012;59(8):709–716. | ||
Shimizu T, Yamada Y, Tashita A, et al. [Pharmacokinetic analysis of antiplatelet effect of sarpogrelate hydrochloride and its application to drug dosage regimen – modeling based on reversible inhibition of 5-HT2 serotonergic receptor in the platelet membrane by sarpogrelate hydrochloride and its metabolite]. Yakugaku Zasshi. 1999;119(11):850–860. Japanese. | ||
Cho DY, Bae SH, Lee JK, Kim YW, Kim BT, Bae SK. Selective inhibition of cytochrome P450 2D6 by sarpogrelate and its active metabolite, M-1, in human liver microsomes. Drug Metab Dispos. 2014;42(1):33–39. | ||
Food and Drug Administration (FDA). Guidance for industry drug interaction studies-study design, data analysis, implications for dosing, and labeling recommendations. Available from: http://www.fda.gov/downloads/Drugs/GuidanceComplianceRegulatoryInformation/Guidances/UCM292362.pdf. Accessed May 8, 2016. | ||
European Medicines Agency (EMA). Guideline on the investigation of drug interactions. Available from: http://www.ema.europa.eu/docs/en_GB/document_library/Scientific_guideline/2012/07/WC500129606.pdf. Accessed May 8, 2016. | ||
Park JB, Bae SK, Bae SH, Oh E. Simultaneous determination of sarpogrelate and its active metabolite in human plasma by liquid chromatography with tandem mass spectrometry and its application to a pharmacokinetic study. J Sep Sci. 2015;38(1):42–49. | ||
Anplag® (sarpogrelate hydrochloride) [package insert]. Osaka: Mitsubishi Tanabe Pharma Corporation; 2012. | ||
Yang JS, Kim JR, Cho E, Huh W, Ko JW, Lee SY. A novel simultaneous determination of sarpogrelate and its active metabolite (M-1) in human plasma, using liquid chromatography-tandem mass spectrometry: clinical application. Ann Lab Med. 2015;35(4):391–398. | ||
Zhang C, Wang L, Yang Y, et al. Validated LC-MS/MS method for the determination of sarpogrelate in human plasma: application to a pharmacokinetic and bioequivalence study in Chinese volunteers. J Pharm Biomed Anal. 2010;53(3):546–551. | ||
Takada Y, Takada A, Urano T. MCI-9042, the new selective antagonist of serotonergic (5-HT2A) receptors. Cardiovasc Drug Rev. 1997;15(2):101–121. | ||
Cho DY, Bae SH, Lee JK, et al. Effect of the potent CYP2D6 inhibitor sarpogrelate on the pharmacokinetics and pharmacodynamics of metoprolol in healthy male Korean volunteers. Xenobiotica. 2015;45(3):256–263. | ||
Lu C, Suri A, Shyu WC, Prakash S. Assessment of cytochrome P450-mediated drug–drug interaction potential of orteronel and exposure changes in patients with renal impairment using physiologically based pharmacokinetic modeling and simulation. Biopharm Drug Dispos. 2014;35(9):543–552. | ||
Rowland-Yeo K, Jamei M, Yang J, Tucker GT, Rostami–Hodjegan A. Physiologically based mechanistic modelling to predict complex drug-drug interactions involving simultaneous competitive and time-dependent enzyme inhibition by parent compound and its metabolite in both liver and gut-the effect of diltiazem on the time-course of exposure to triazolam. Eur J Pharm Sci. 2010;39(5):298–309. | ||
VandenBrink BM, Foti RS, Rock DA, Wienkers LC, Wahlstrom JL. Prediction of CYP2D6 drug interactions from in vitro data: evidence for substrate-dependent inhibition. Drug Metab Dispos. 2012;40(1):47–53. | ||
Clarke G, O’Mahony SM, Cryan JF, Dinan TG. Verapamil in treatment resistant depression: a role for the P-glycoprotein transporter? Hum Psychopharmacol. 2009;24(3):217–223. | ||
O’Brien FE, Dinan TG, Griffin BT, Cryan JF. Interactions between antidepressants and P-glycoprotein at the blood-brain barrier: clinical significance of in vitro and in vivo findings. Br J Pharmacol. 2012;165(2):289–312. | ||
Rautio J, Humphreys JE, Webster LO, et al. In vitro p-glycoprotein inhibition assays for assessment of clinical drug interaction potential of new drug candidates: a recommendation for probe substrates. Drug Metab Dispos. 2006;34(5):786–792. | ||
Mao Q, Unadkat JD. Role of the breast cancer resistance protein (BCRP/ABCG2) in drug transport – an update. AAPS J. 2015;17(1):65–82. | ||
Balimane PV, Marino A, Chong S. P-gp inhibition potential in cell-based models: which “calculation” method is the most accurate? AAPS J. 2008;10(4):577–586. | ||
Arafat T, Arafat B, Awad R, Abu-Awwad A. Determination of loperamide in human plasma and saliva by liquid chromatography-tandem mass spectrometry. J Chromatogr B Analyt Technol Biomed Life Sci. 2014;972:81–88. | ||
Erceg M, Cindric M, Pozaic Frketic L, Vertzoni M, Cetina-Cizmek B, Reppas C. A LC-MS-MS method for determination of low doxazosin concentrations in plasma after oral administration to dogs. J Chromatogr Sci. 2010;48(2):114–119. | ||
Yamashita S, Tachiki H. Analysis of risk factors in human bioequivalence study that incur bioinequivalence of oral drug products. Mol Pharm. 2009;6(1):48–59. | ||
Jamei M, Turner D, Yang J, et al. Population-based mechanistic prediction of oral drug absorption. AAPS J. 2009;11(2):225–237. | ||
Rodgers T, Leahy D, Rowland M. Physiologically based pharmacokinetic modeling 1: predicting the tissue distribution of moderate-to-strong bases. J Pharm Sci. 2005;94(6):1259–1276. | ||
Satoh T, Taylor P, Bosron WF, Sanghani SP, Hosokawa M, La Du BN. Current progress on esterases: from molecular structure to function. Drug Metab Dispos. 2002;30(5):488–493. | ||
Kim HJ, Jeong ES, Seo KA, et al. Glucuronidation of a sarpogrelate active metabolite is mediated by UDP-glucuronosyltransferases 1A4, 1A9, and 2B4. Drug Metab Dispos. 2013;41(8):1529–1537. | ||
Kim TE, Kim JR, Jung JA, et al. Pharmacokinetics of a new once-daily controlled-release sarpogrelate hydrochloride compared with immediate-release formulation and the effect of food. J Clin Pharm Ther. 2014;39(2):192–195. | ||
Kim TE, Kim JR, Jung JA, et al. Comparison of pharmacokinetics between sarpogrelate hydrochloride immediate-release formulation and controlled-release formulation. Int J Clin Pharmacol Ther. 2013;51(2):114–119. | ||
Lee SY, Kim JR, Jung JA, et al. Multiple-dose study to evaluate pharmacokinetics, pharmacodynamics, and safety in healthy subjects: a comparison of controlled-release sarpogrelate and immediate-release sarpogrelate. Pharmacology. 2015;96(1–2):68–75. | ||
Chen J, Liu D, Zheng X, Zhao Q, Jiang J, Hu P. Relative contributions of the major human CYP450 to the metabolism of icotinib and its implication in prediction of drug-drug interaction between icotinib and CYP3A4 inhibitors/inducers using physiologically based pharmacokinetic modeling. Expert Opin Drug Metab Toxicol. 2015;11(6):857–868. | ||
Evans MV, Crank WD, Yang HM, Simmons JE. Applications of sensitivity analysis to a physiologically based pharmacokinetic model for carbon tetrachloride in rats. Toxicol Appl Pharmacol. 1994;128(1):36–44. | ||
Parrott N, Paquereau N, Coassolo P, Lavé T. An evaluation of the utility of physiologically based models of pharmacokinetics in early drug discovery. J Pharm Sci. 2005;94(10):2327–2343. | ||
Abduljalil K, Cain T, Humphries H, Rostami–Hodjegan A. Deciding on success criteria for predictability of pharmacokinetic parameters from in vitro studies: an analysis based on in vivo observations. Drug Metab Dispos. 2014;42(9):1478–1484. | ||
Damy T, Pousset F, Caplain H, Hulot JS, Lechat P. Pharmacokinetic and pharmacodynamic interactions between metoprolol and dronedarone in extensive and poor CYP2D6 metabolizers healthy subjects. Fundam Clin Pharmacol. 2004;18(1):113–123. | ||
Feld R, Woo MM, Leighl N, et al. A clinical investigation of inhibitory effect of panobinostat on CYP2D6 substrate in patients with advanced cancer. Cancer Chemother Pharmacol. 2013;72(4):747–755. | ||
Hamelin BA, Bouayad A, Méthot J, et al. Significant interaction between the nonprescription antihistamine diphenhydramine and the CYP2D6 substrate metoprolol in healthy men with high or low CYP2D6 activity. Clin Pharmacol Ther. 2000;67(5):466–477. | ||
Lessard E, Yessine MA, Hamelin BA, et al. Diphenhydramine alters the disposition of venlafaxine through inhibition of CYP2D6 activity in humans. J Clin Psychopharmacol. 2001;21(2):175–184. |
 © 2016 The Author(s). This work is published and licensed by Dove Medical Press Limited. The
full terms of this license are available at https://www.dovepress.com/terms
and incorporate the Creative Commons Attribution
- Non Commercial (unported, 3.0) License.
By accessing the work you hereby accept the Terms. Non-commercial uses of the work are permitted
without any further permission from Dove Medical Press Limited, provided the work is properly
attributed. For permission for commercial use of this work, please see paragraphs 4.2 and 5 of our Terms.
© 2016 The Author(s). This work is published and licensed by Dove Medical Press Limited. The
full terms of this license are available at https://www.dovepress.com/terms
and incorporate the Creative Commons Attribution
- Non Commercial (unported, 3.0) License.
By accessing the work you hereby accept the Terms. Non-commercial uses of the work are permitted
without any further permission from Dove Medical Press Limited, provided the work is properly
attributed. For permission for commercial use of this work, please see paragraphs 4.2 and 5 of our Terms.